The same plot in 14 other libraries — JavaScript: Chart.js, D3.js, Highcharts, MUI X Charts; Python: Altair, Bokeh, lets-plot, Matplotlib, Plotly, plotnine, Pygal, Seaborn; R: ggplot2; Julia: Makie.jl. Compare all 15 side by side: Density Contour Plot in Python, R, Julia and JavaScript.
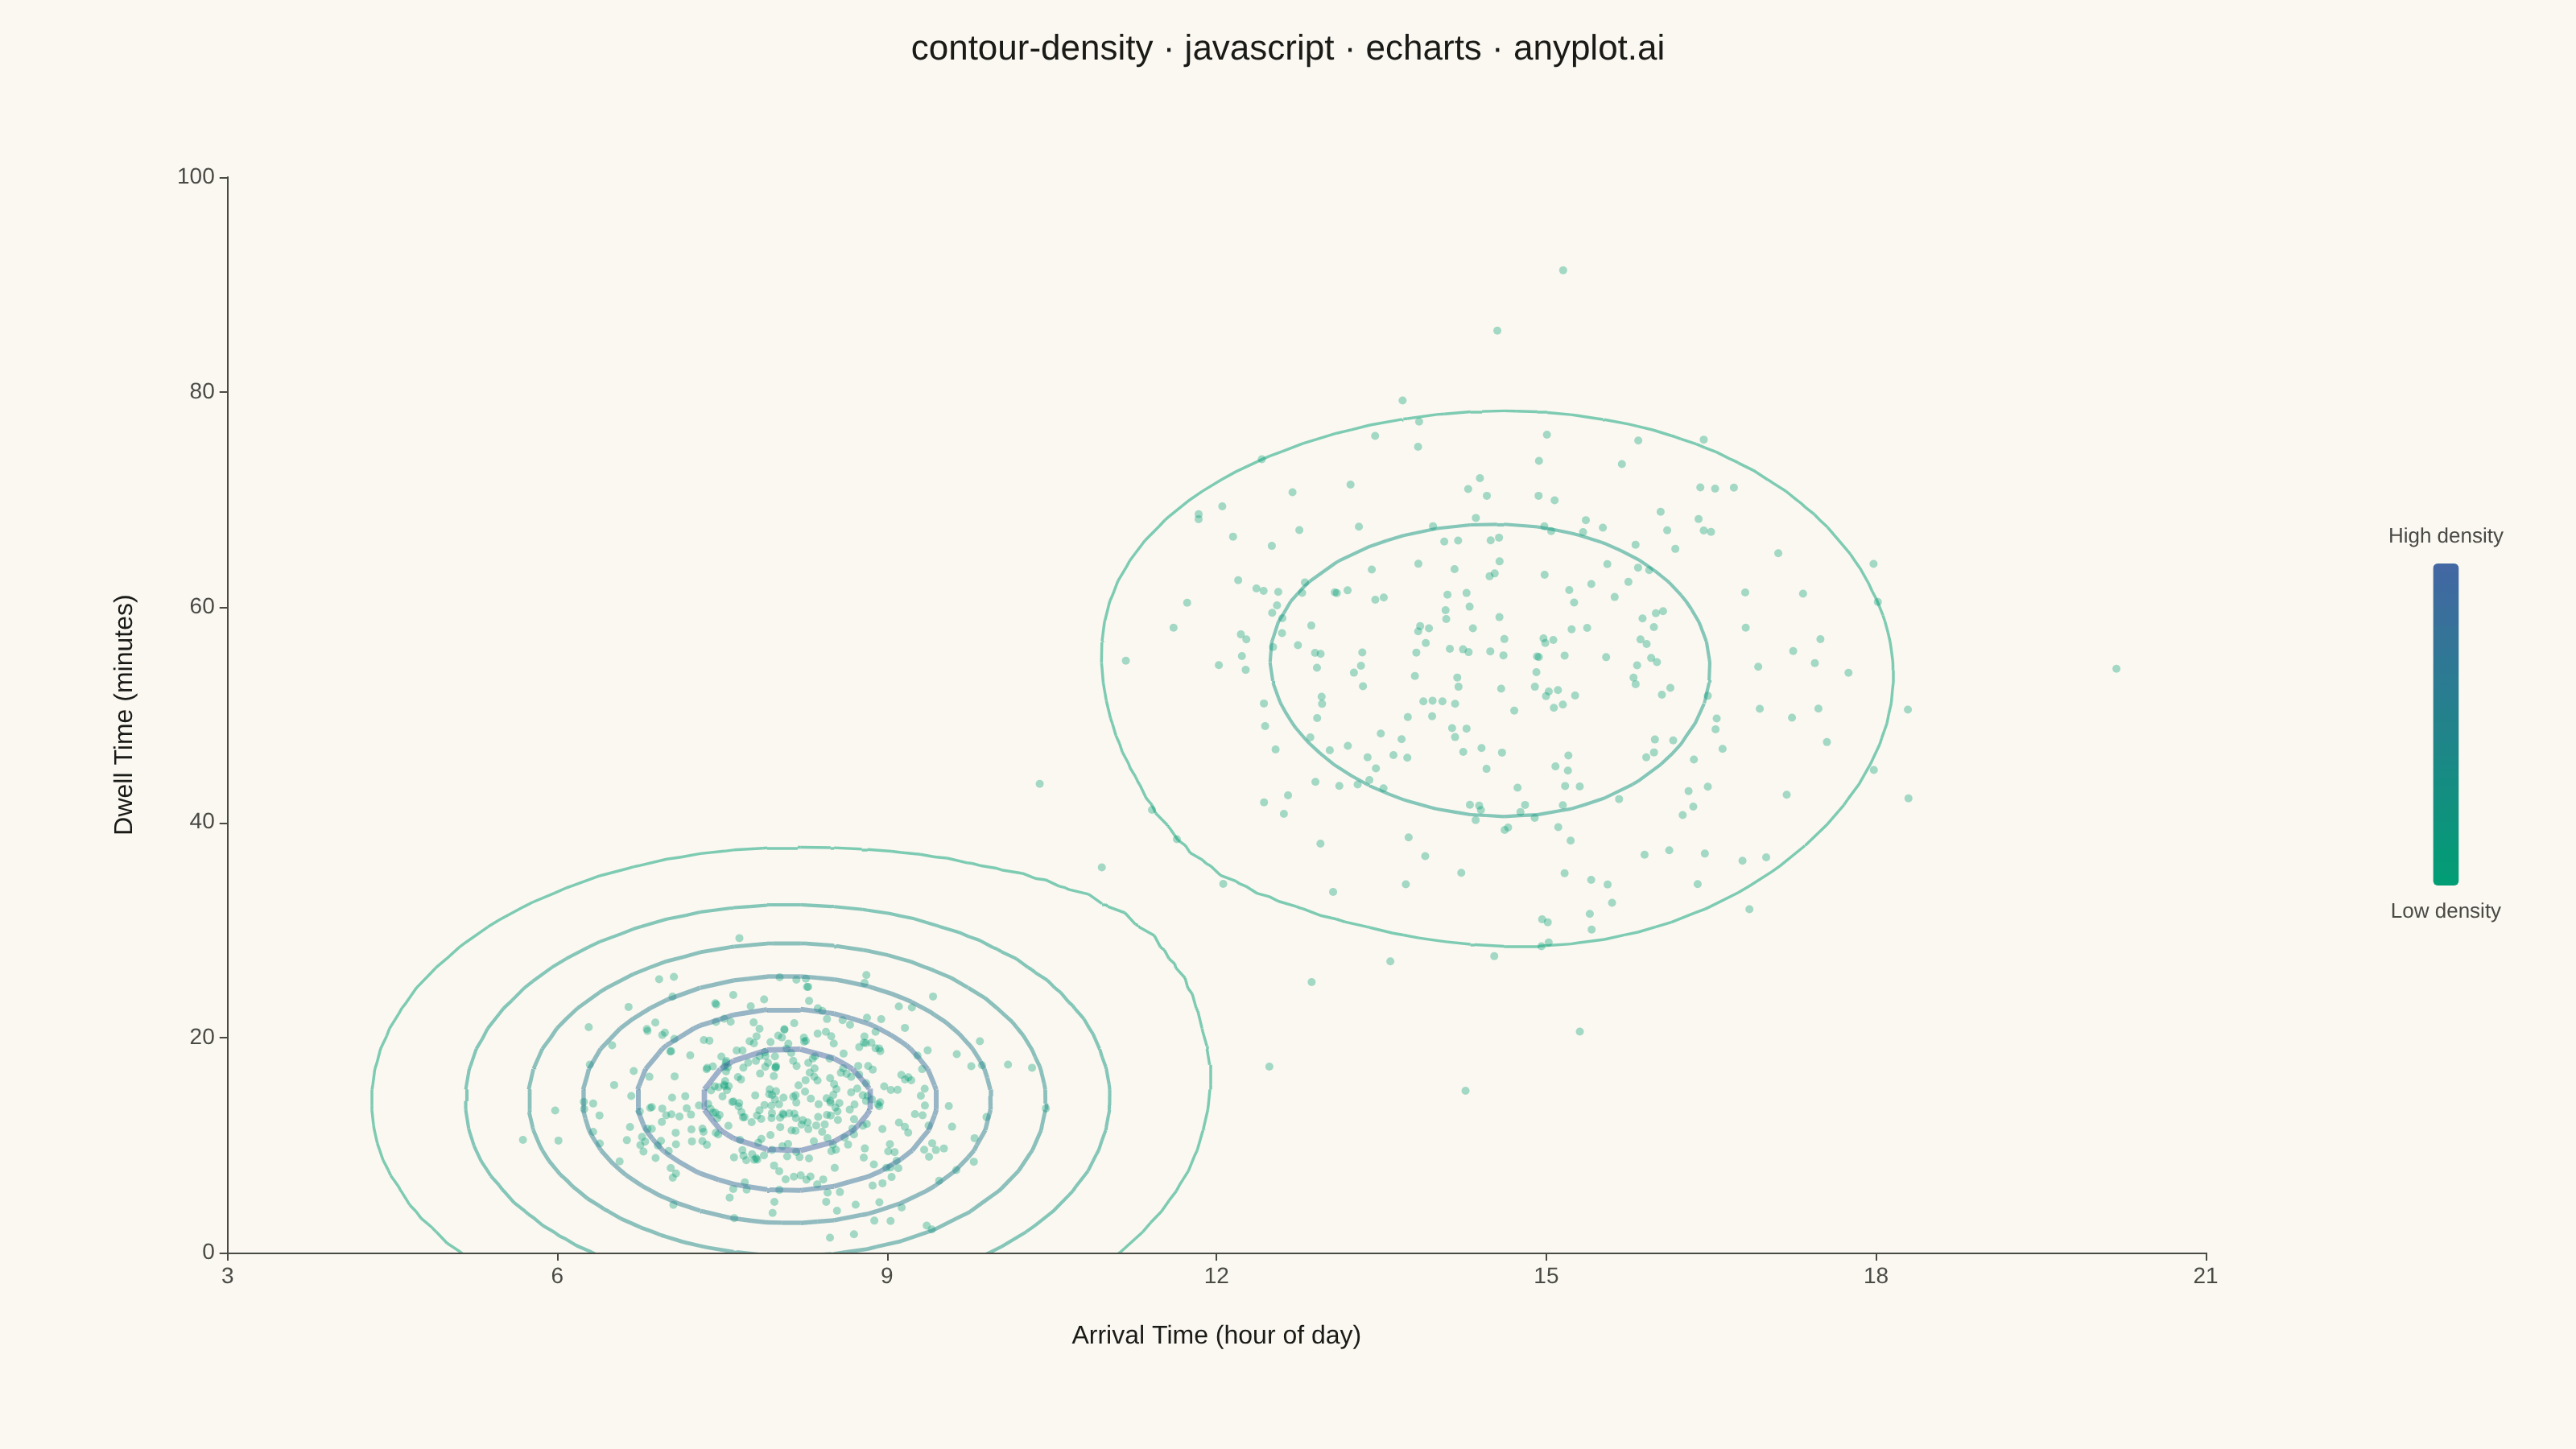
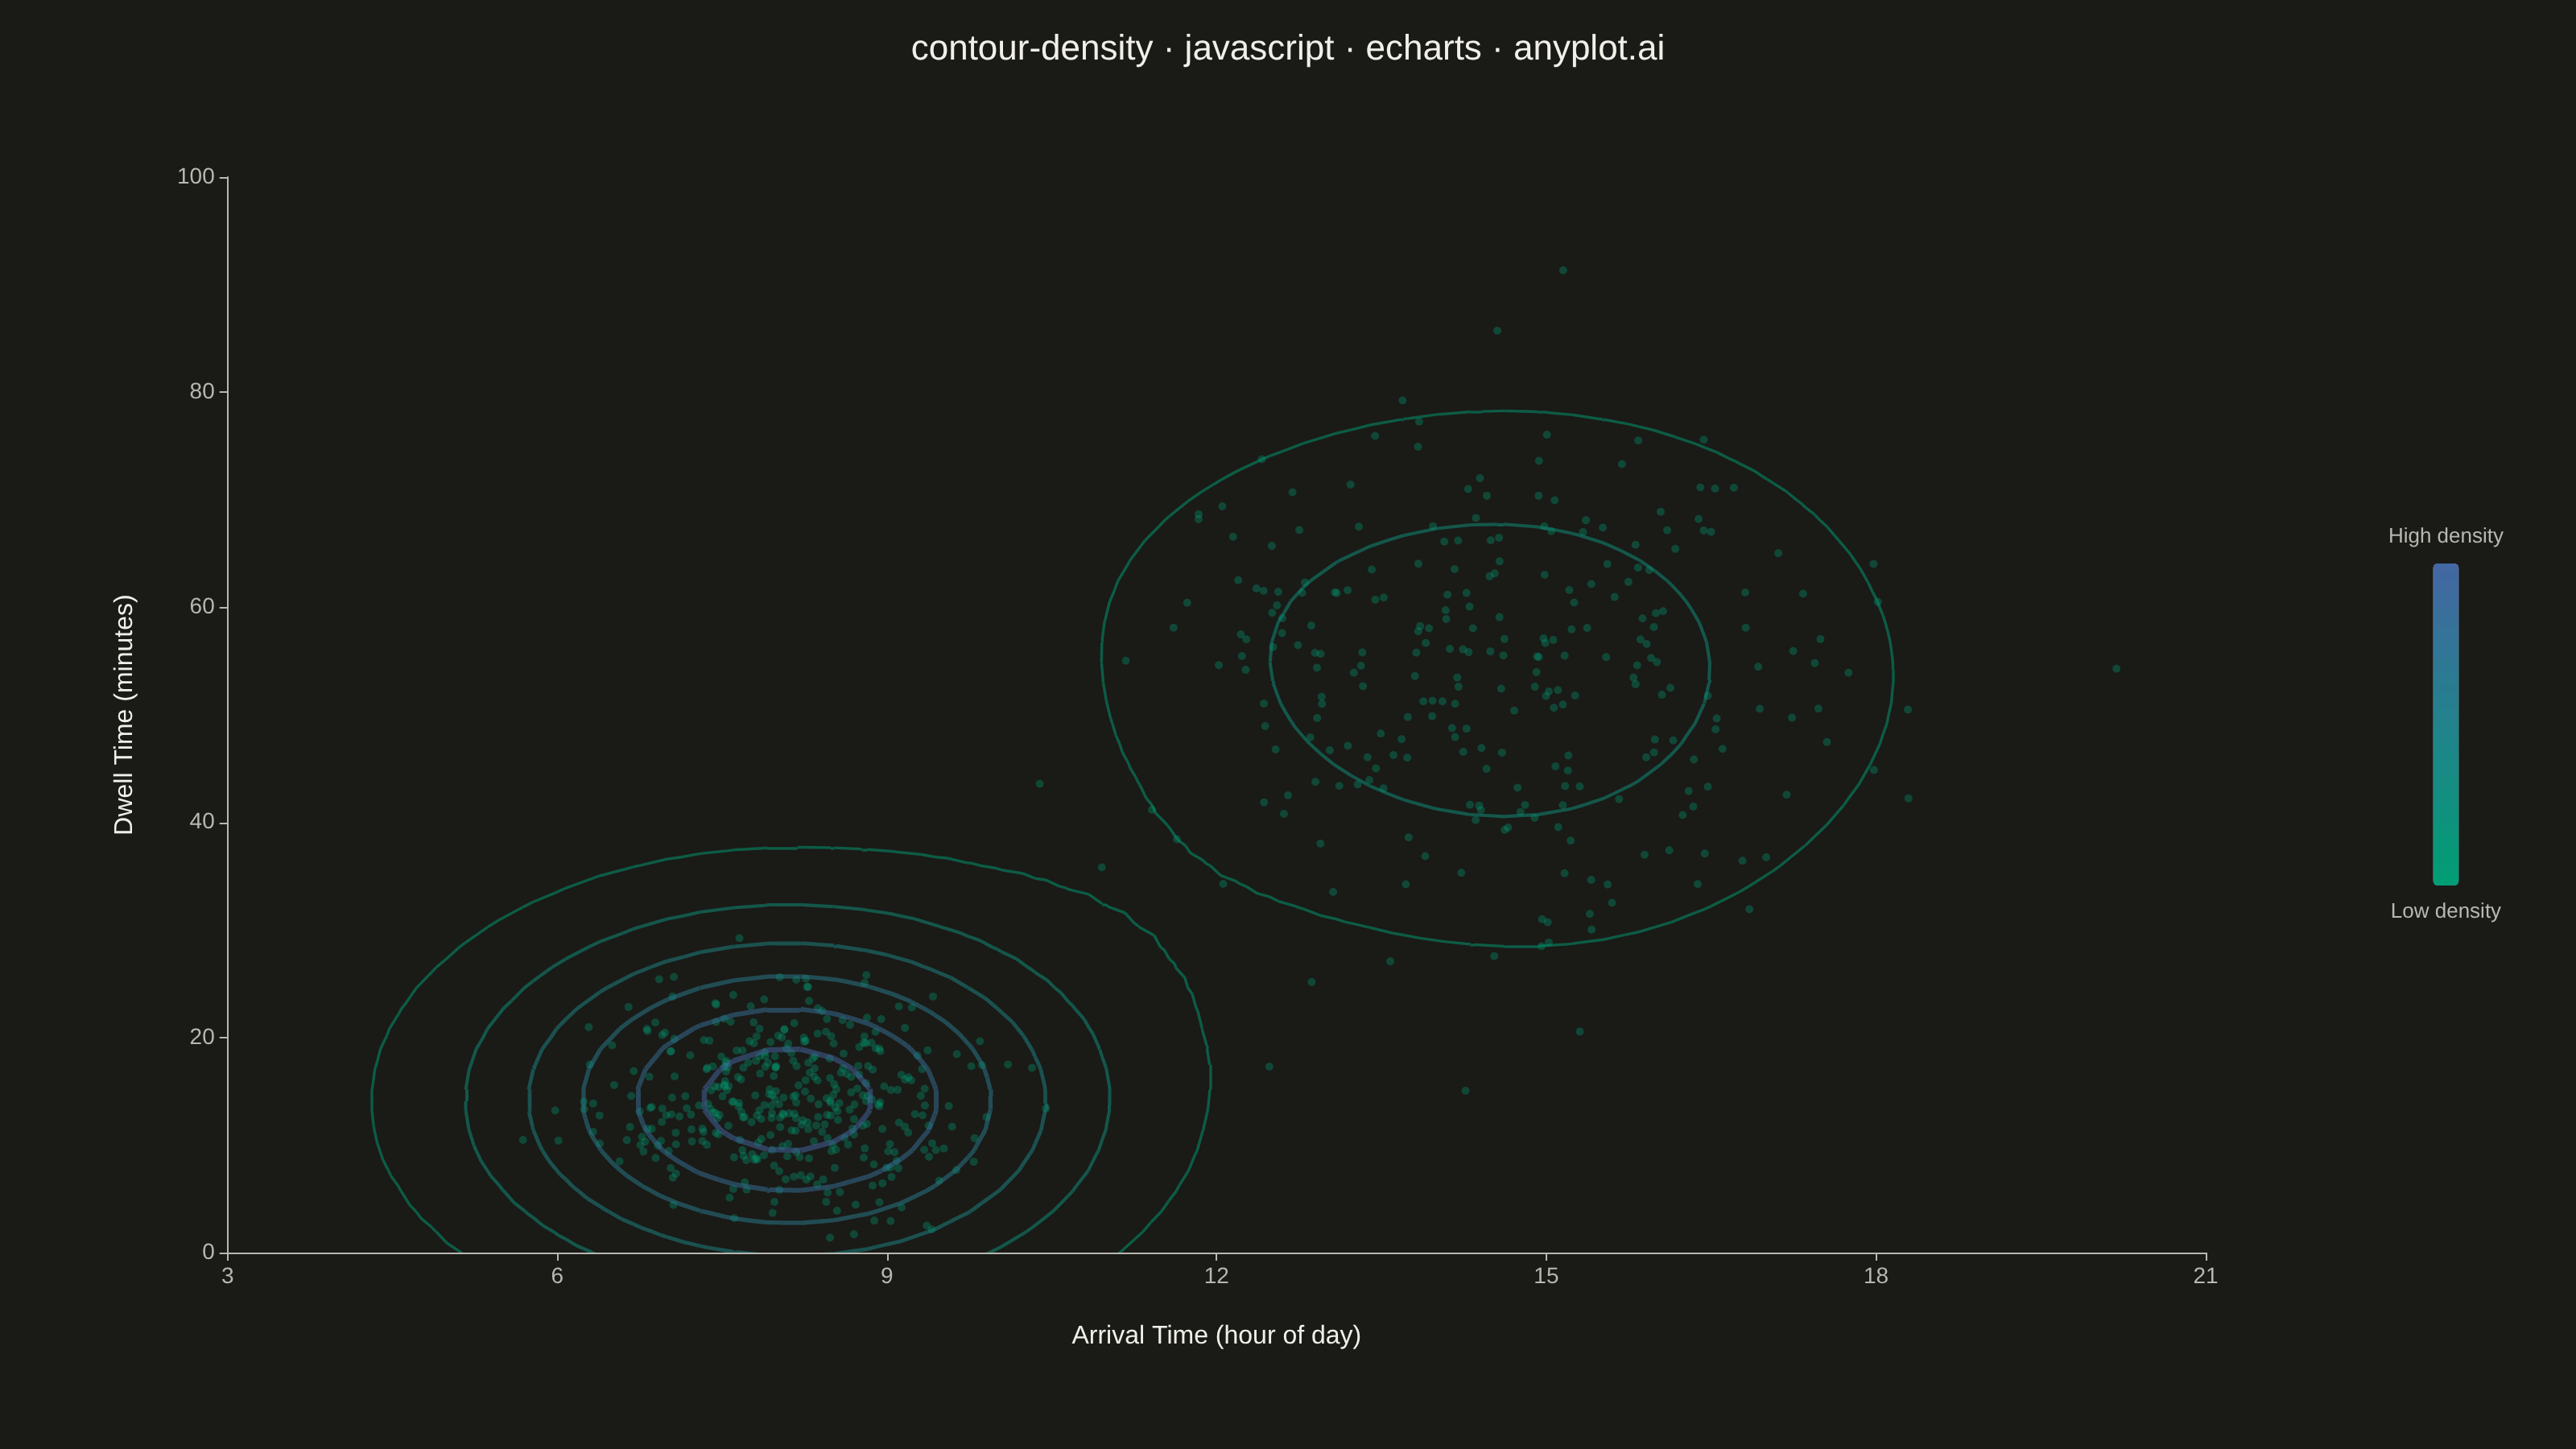
A density contour plot (also known as a 2D KDE contour plot) displays the concentration of points in a 2D scatter plot using contour lines. The contours connect points of equal density, revealing clusters, patterns, and the overall bivariate distribution shape.
// anyplot.ai
// contour-density: Density Contour Plot
// Library: echarts 6.1.0 | JavaScript 22.23.2
// Quality: 90/100 | Created: 2026-09-04

const t = window.ANYPLOT_TOKENS;

// --- Data: coffee-shop visits — arrival time vs. dwell time (fixed-seed LCG) ----
let seed = 42;
function rand() {
  seed = (seed * 1664525 + 1013904223) % 4294967296;
  return seed / 4294967296;
}
function gaussianPair() {
  const u1 = Math.max(rand(), 1e-9);
  const u2 = rand();
  const r = Math.sqrt(-2 * Math.log(u1));
  return [r * Math.cos(2 * Math.PI * u2), r * Math.sin(2 * Math.PI * u2)];
}
function cluster(n, cx, cy, sx, sy) {
  const pts = [];
  for (let i = 0; i < n; i++) {
    const [z0, z1] = gaussianPair();
    pts.push([cx + z0 * sx, cy + z1 * sy]);
  }
  return pts;
}

// Two visit patterns: brief morning coffee runs, and long afternoon work sessions
const morningRush = cluster(380, 8.1, 14, 0.9, 5.5);
const afternoonWork = cluster(270, 14.6, 55, 1.6, 12);
const points = morningRush.concat(afternoonWork);

// --- Bivariate Gaussian KDE on a regular grid --------------------------------
const xs = points.map((p) => p[0]);
const ys = points.map((p) => p[1]);
const xMin = Math.min(...xs);
const xMax = Math.max(...xs);
const yMin = Math.min(...ys);
const yMax = Math.max(...ys);
const padX = (xMax - xMin) * 0.12;
const padY = (yMax - yMin) * 0.12;
const gx0 = xMin - padX;
const gx1 = xMax + padX;
const gy0 = yMin - padY;
const gy1 = yMax + padY;

const GRID = 60;
const bwX = (gx1 - gx0) * 0.09;
const bwY = (gy1 - gy0) * 0.09;
const gridX = Array.from({ length: GRID }, (_, i) => gx0 + (i * (gx1 - gx0)) / (GRID - 1));
const gridY = Array.from({ length: GRID }, (_, j) => gy0 + (j * (gy1 - gy0)) / (GRID - 1));

const density = Array.from({ length: GRID }, () => new Array(GRID).fill(0));
for (const [px, py] of points) {
  for (let i = 0; i < GRID; i++) {
    const dx = (gridX[i] - px) / bwX;
    const gaussX = Math.exp(-0.5 * dx * dx);
    if (gaussX < 1e-6) continue;
    for (let j = 0; j < GRID; j++) {
      const dy = (gridY[j] - py) / bwY;
      density[i][j] += gaussX * Math.exp(-0.5 * dy * dy);
    }
  }
}
let maxDensity = 0;
for (let i = 0; i < GRID; i++) {
  for (let j = 0; j < GRID; j++) maxDensity = Math.max(maxDensity, density[i][j]);
}

// --- Marching-triangles contour extraction -----------------------------------
// Each grid cell is split into 2 triangles so saddle points resolve without
// the extra case table a full marching-squares implementation would need.
function edgeCrossing(pa, pb, level) {
  const frac = (level - pa.z) / (pb.z - pa.z);
  return [pa.x + frac * (pb.x - pa.x), pa.y + frac * (pb.y - pa.y)];
}
function triangleSegment(p1, p2, p3, level) {
  const crossings = [];
  for (const [pa, pb] of [
    [p1, p2],
    [p2, p3],
    [p3, p1],
  ]) {
    if ((pa.z - level) * (pb.z - level) < 0) crossings.push(edgeCrossing(pa, pb, level));
  }
  return crossings.length === 2 ? crossings : null;
}

const LEVEL_FRACTIONS = [0.12, 0.28, 0.44, 0.6, 0.76, 0.92];
const contourData = [];
for (const frac of LEVEL_FRACTIONS) {
  const level = frac * maxDensity;
  for (let i = 0; i < GRID - 1; i++) {
    for (let j = 0; j < GRID - 1; j++) {
      const p00 = { x: gridX[i], y: gridY[j], z: density[i][j] };
      const p10 = { x: gridX[i + 1], y: gridY[j], z: density[i + 1][j] };
      const p11 = { x: gridX[i + 1], y: gridY[j + 1], z: density[i + 1][j + 1] };
      const p01 = { x: gridX[i], y: gridY[j + 1], z: density[i][j + 1] };
      const seg1 = triangleSegment(p00, p10, p11, level);
      if (seg1) contourData.push({ coords: seg1, value: frac, lineStyle: { width: 1.5 + frac * 2 } });
      const seg2 = triangleSegment(p00, p11, p01, level);
      if (seg2) contourData.push({ coords: seg2, value: frac, lineStyle: { width: 1.5 + frac * 2 } });
    }
  }
}

// --- Init ---------------------------------------------------------------------
const chart = echarts.init(document.getElementById("container"));

chart.setOption({
  animation: false,
  backgroundColor: "transparent",
  color: t.palette,
  title: {
    text: "contour-density · javascript · echarts · anyplot.ai",
    left: "center",
    textStyle: { color: t.ink, fontSize: 22, fontWeight: 500 },
  },
  grid: { left: 110, right: 230, top: 110, bottom: 100, containLabel: true },
  xAxis: {
    type: "value",
    name: "Arrival Time (hour of day)",
    nameLocation: "middle",
    nameGap: 44,
    nameTextStyle: { color: t.ink, fontSize: 16 },
    scale: true,
    axisLabel: { color: t.inkSoft, fontSize: 14 },
    axisLine: { lineStyle: { color: t.inkSoft } },
    splitLine: { show: false },
  },
  yAxis: {
    type: "value",
    name: "Dwell Time (minutes)",
    nameLocation: "middle",
    nameGap: 56,
    nameTextStyle: { color: t.ink, fontSize: 16 },
    scale: true,
    axisLabel: { color: t.inkSoft, fontSize: 14 },
    axisLine: { lineStyle: { color: t.inkSoft } },
    splitLine: { show: false },
  },
  visualMap: {
    type: "continuous",
    seriesIndex: 1,
    min: LEVEL_FRACTIONS[0],
    max: LEVEL_FRACTIONS[LEVEL_FRACTIONS.length - 1],
    inRange: { color: t.seq },
    text: ["High density", "Low density"],
    textStyle: { color: t.inkSoft, fontSize: 13 },
    itemWidth: 16,
    itemHeight: 200,
    right: 30,
    top: "middle",
    orient: "vertical",
    hoverLink: false,
    calculable: false,
  },
  series: [
    {
      // Raw visit records — muted context underlay beneath the contours
      type: "scatter",
      data: points,
      symbolSize: 5,
      itemStyle: { color: t.muted, opacity: 0.35 },
      z: 1,
    },
    {
      // KDE contour lines, colored by density level via the visualMap above
      type: "lines",
      coordinateSystem: "cartesian2d",
      xAxisIndex: 0,
      yAxisIndex: 0,
      polyline: false,
      data: contourData,
      z: 2,
    },
  ],
});
Runnable source as JSON, for any HTTP client: https://api.anyplot.ai/specs/contour-density/echarts/code. Any spec id and library id listed in llms-full.txt fit the same URL shape; every URL below is complete and callable.
{
  "spec_id": "contour-density",
  "language": "javascript",
  "library": "echarts",
  "page": "https://anyplot.ai/contour-density/javascript/echarts",
  "hub": "https://anyplot.ai/contour-density",
  "code_json": "https://api.anyplot.ai/specs/contour-density/echarts/code",
  "spec_json": "https://api.anyplot.ai/specs/contour-density",
  "render_light_png": "https://storage.googleapis.com/anyplot-images/plots/contour-density/javascript/echarts/plot-light.png",
  "render_dark_png": "https://storage.googleapis.com/anyplot-images/plots/contour-density/javascript/echarts/plot-dark.png",
  "interactive_light_html": "https://storage.googleapis.com/anyplot-images/plots/contour-density/javascript/echarts/plot-light.html",
  "interactive_dark_html": "https://storage.googleapis.com/anyplot-images/plots/contour-density/javascript/echarts/plot-dark.html",
  "quality_score": 90.0,
  "license": "MIT",
  "guide": "https://anyplot.ai/llms.txt"
}
Part of Density Contour Plot on anyplot.ai.