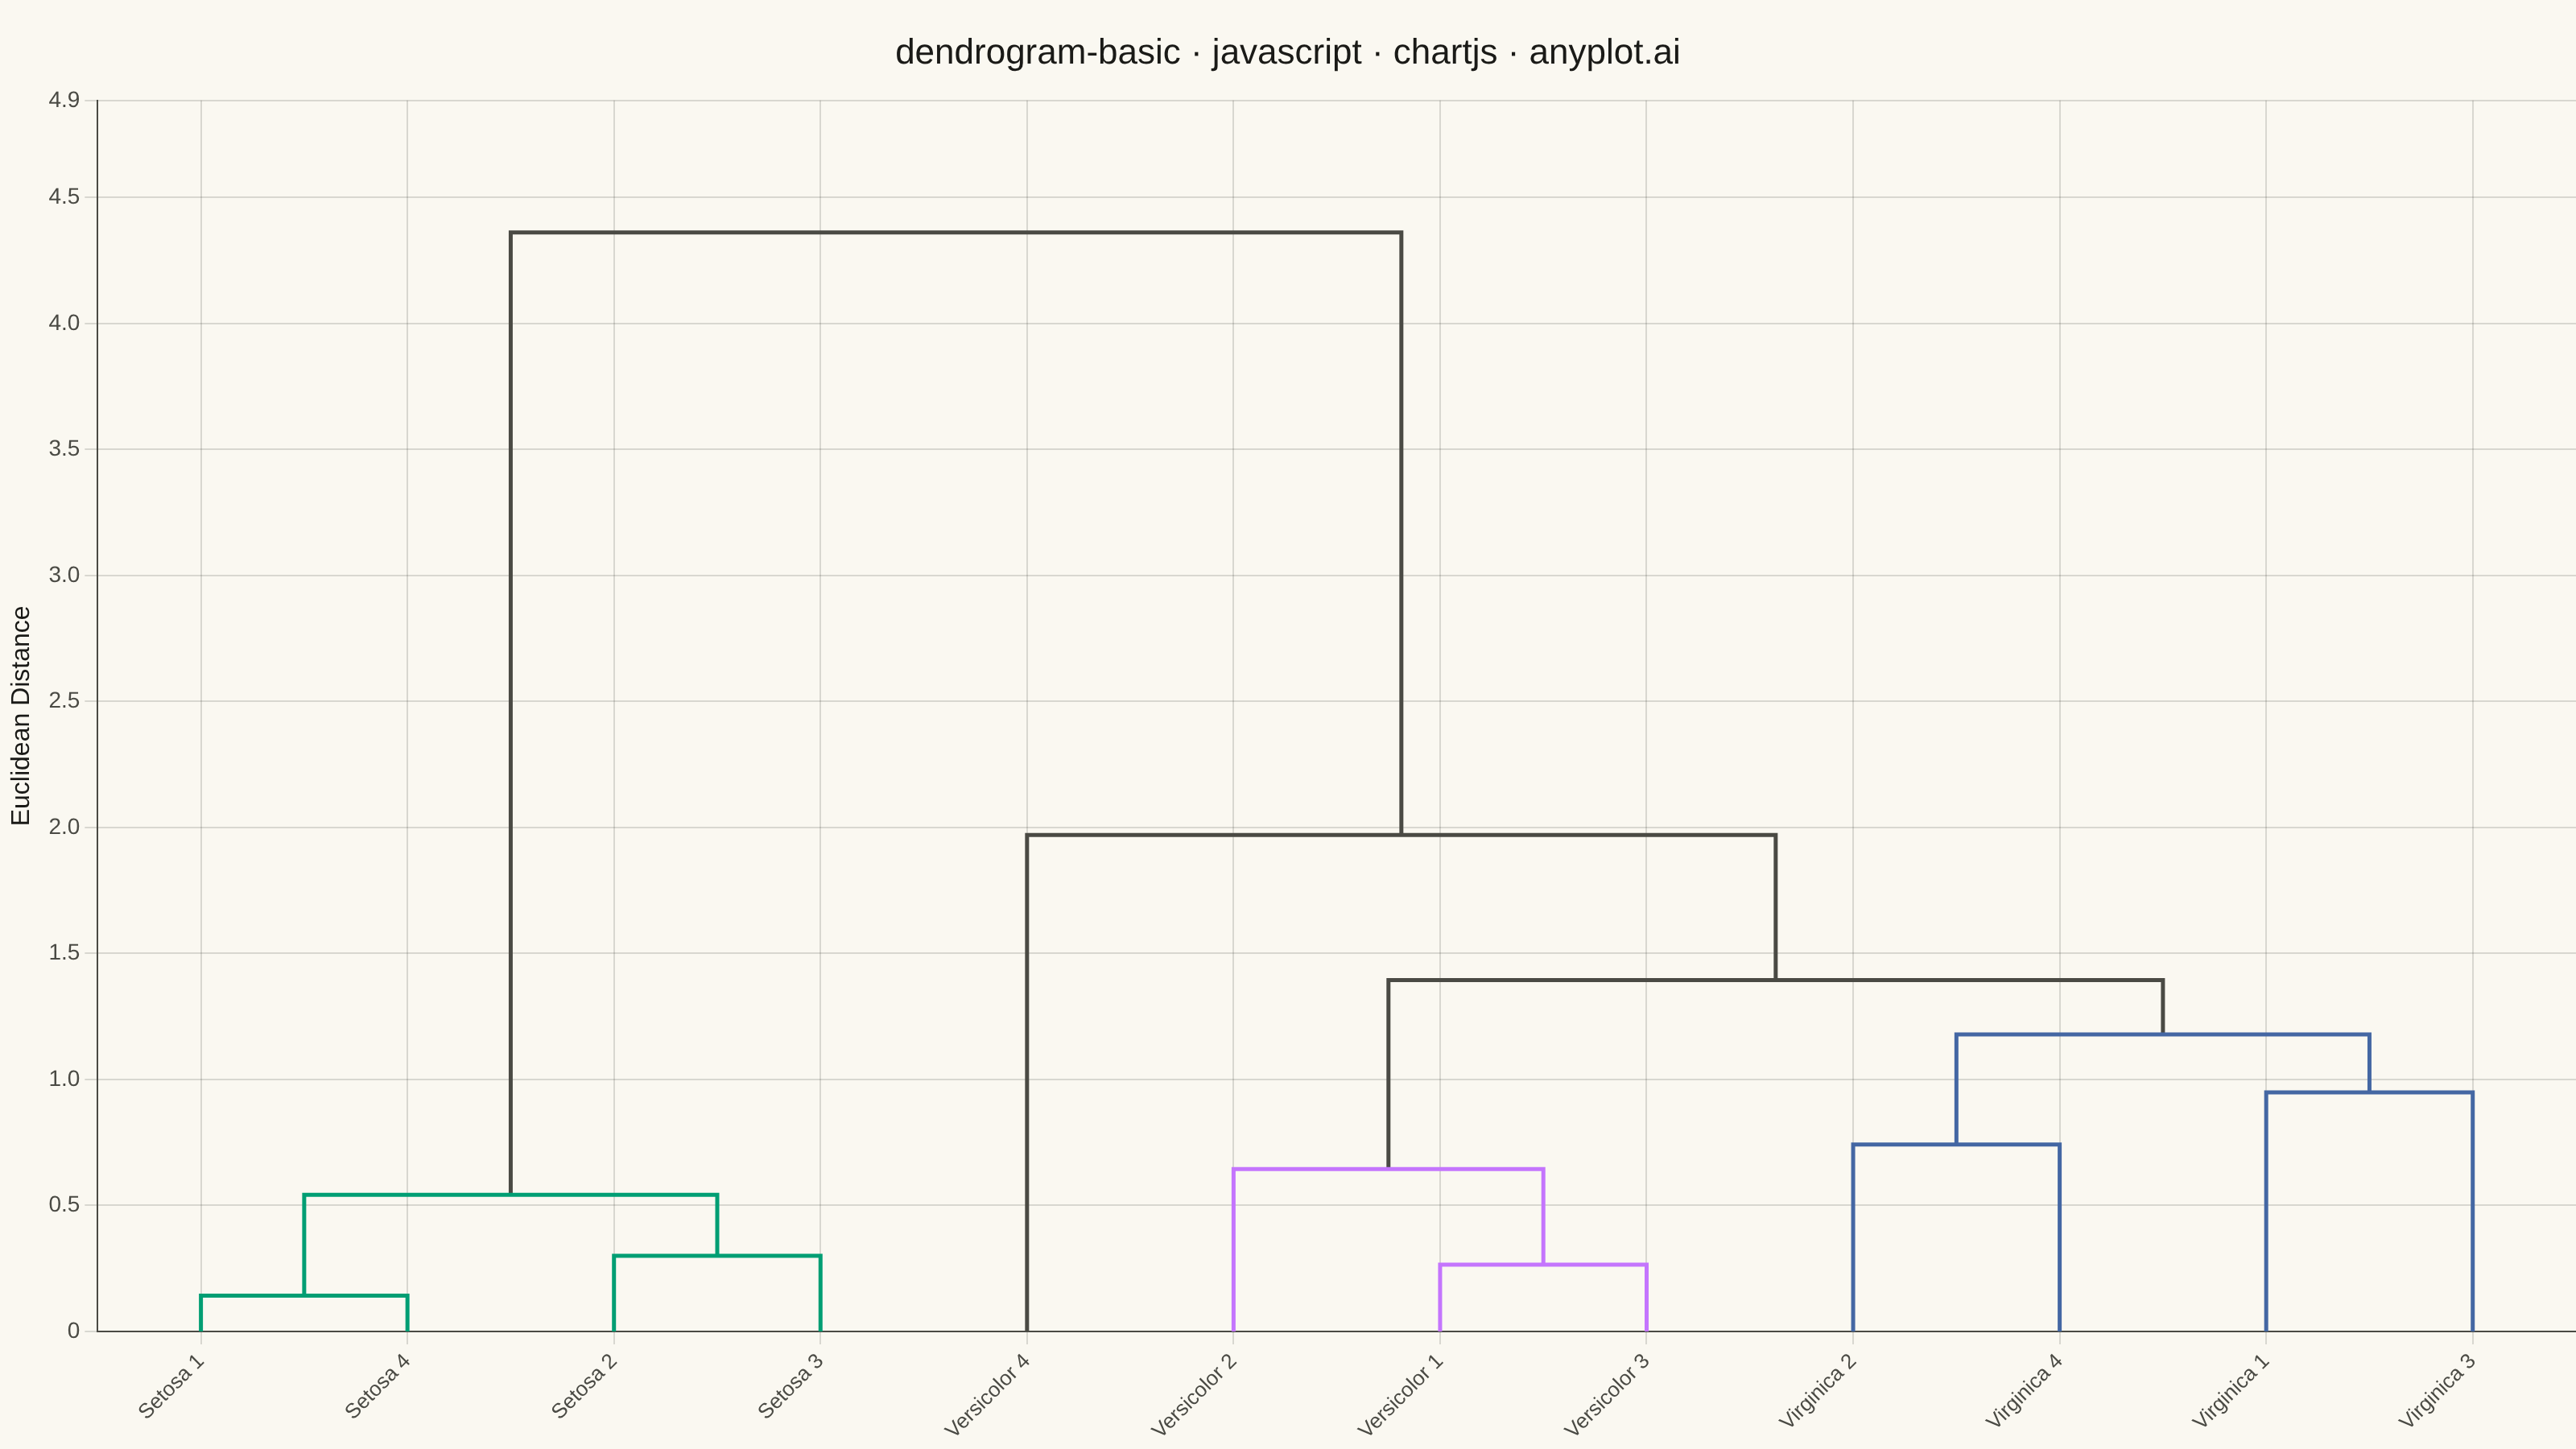
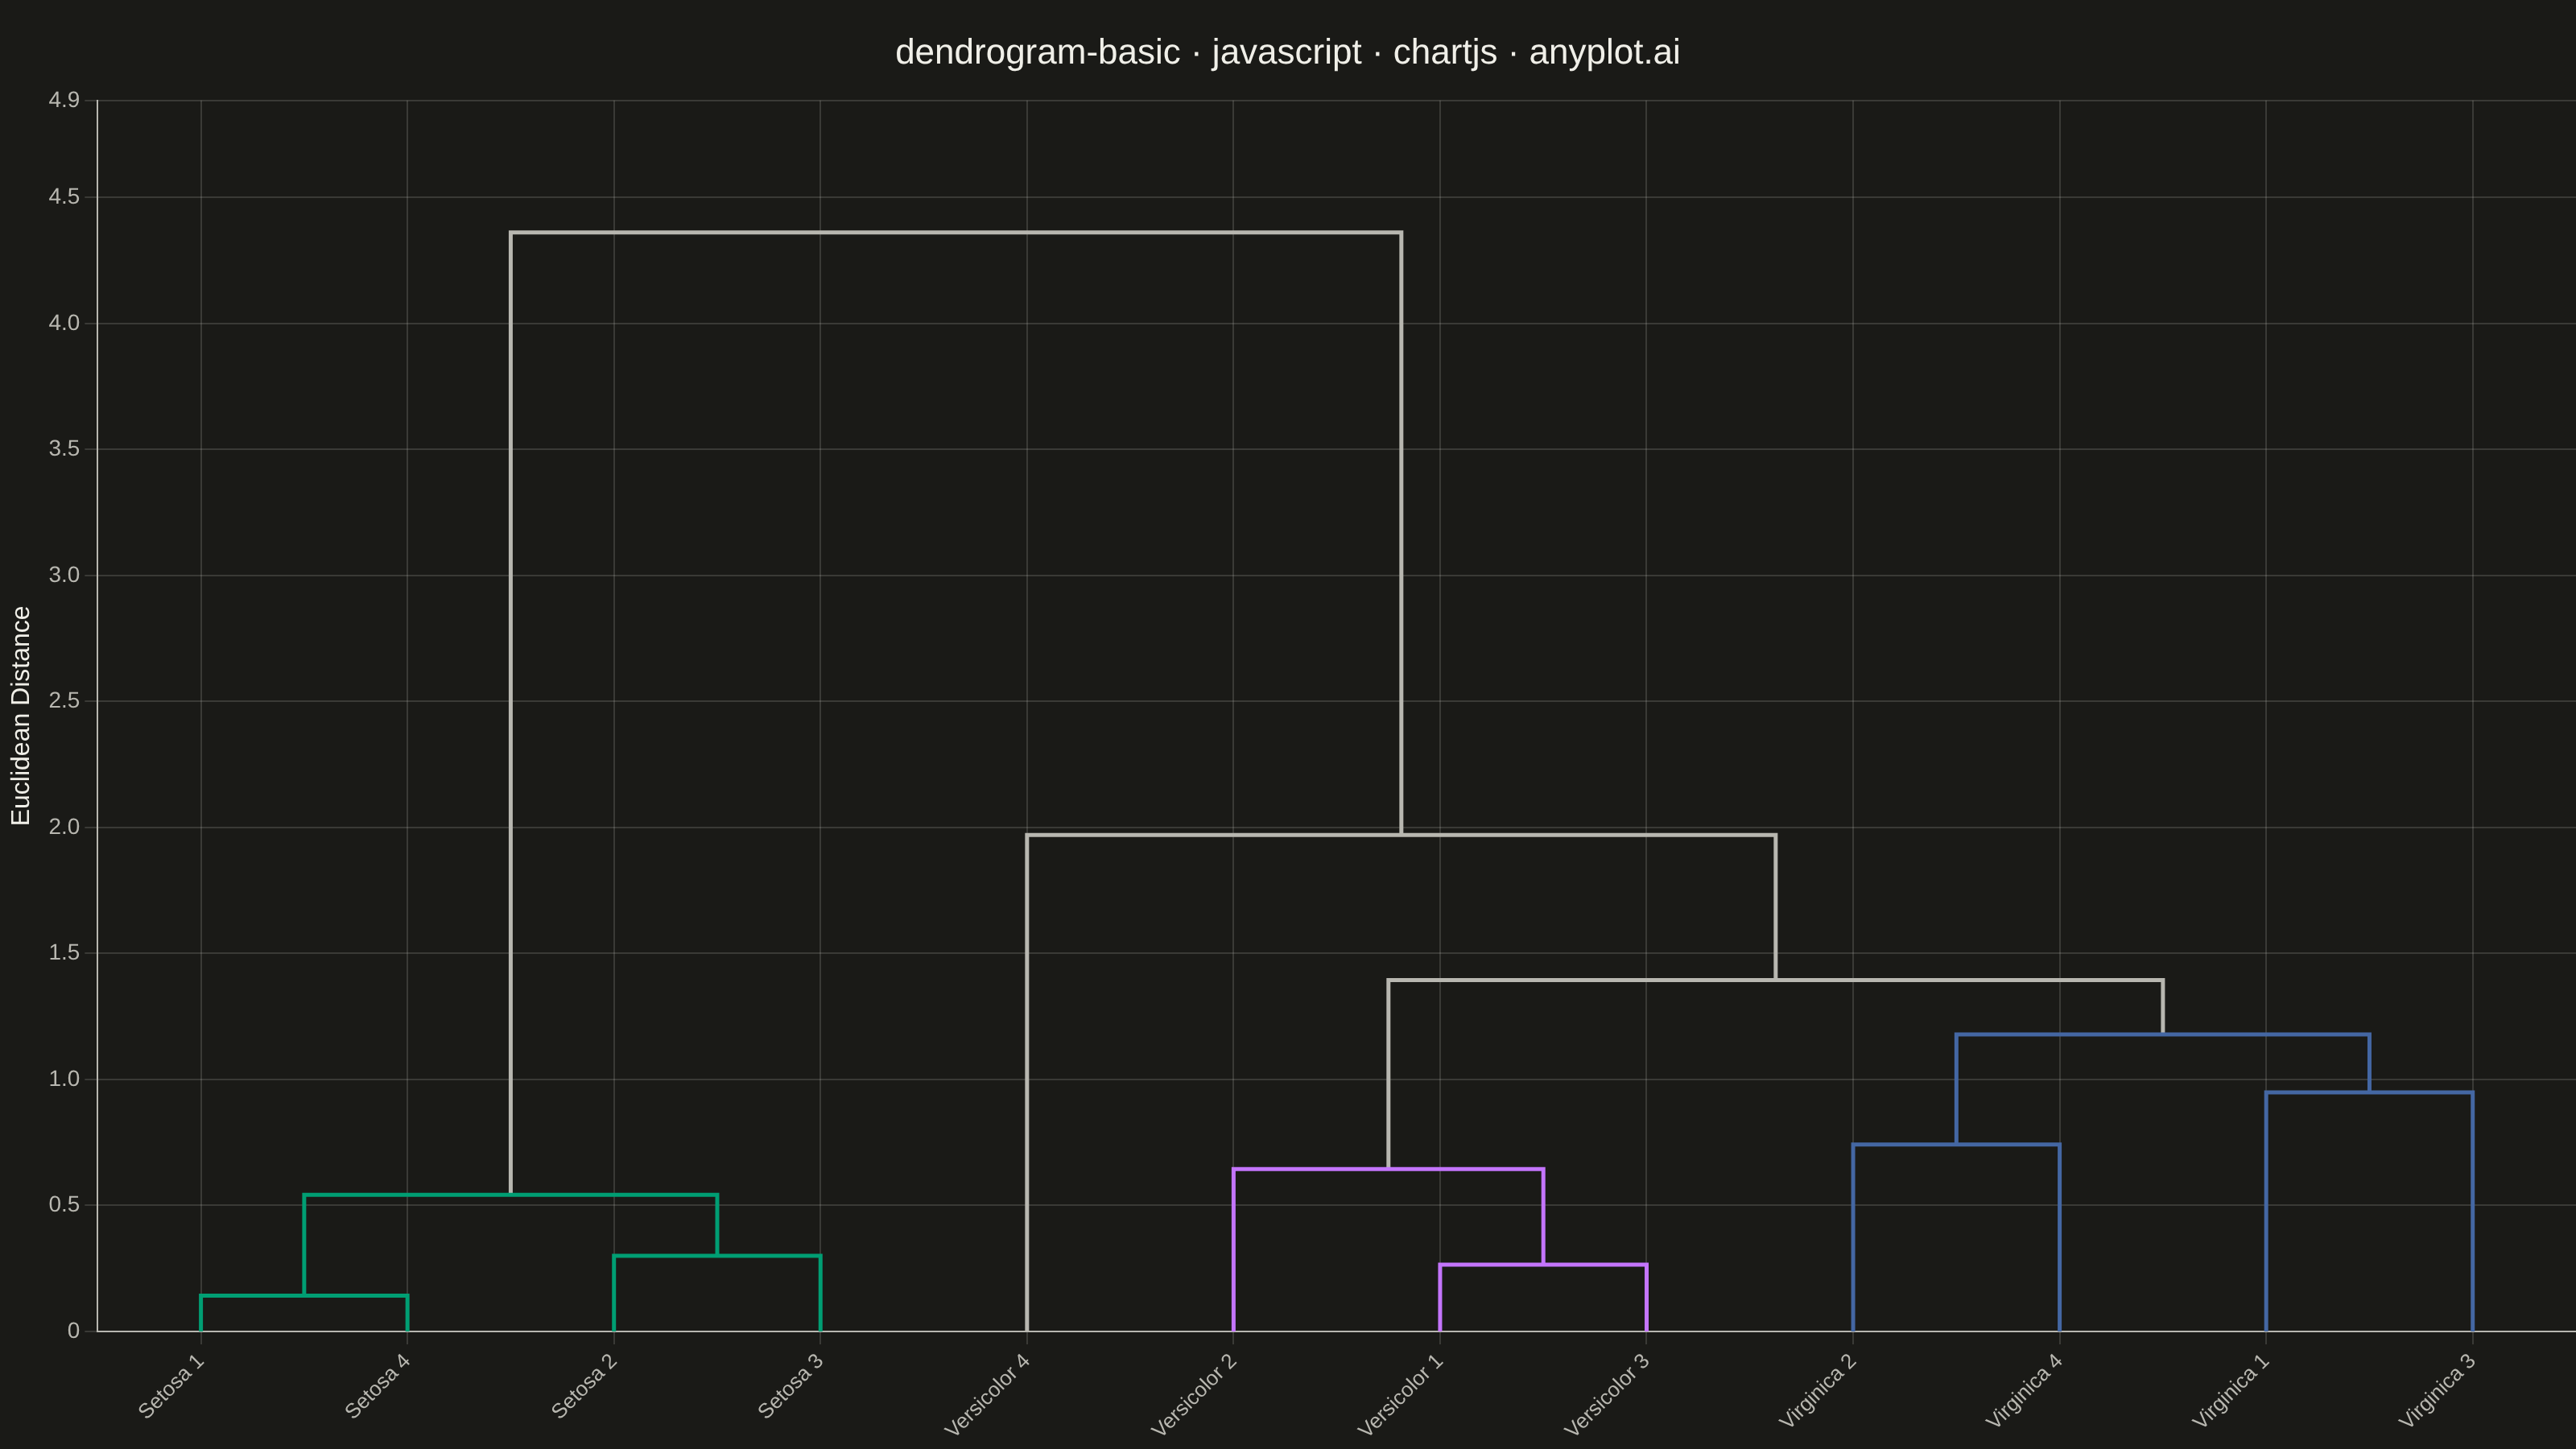
A dendrogram visualizes hierarchical clustering by showing how data points or clusters merge at different distance levels. The tree-like structure reveals relationships and similarity between items, with branch heights indicating the distance at which clusters merge. This visualization is essential for understanding the hierarchical structure in data and identifying natural groupings.
// anyplot.ai
// dendrogram-basic: Basic Dendrogram
// Library: chartjs 4.4.7 | JavaScript 22.22.3
// Quality: 89/100 | Created: 2026-06-18

//# anyplot-orientation: landscape

const t = window.ANYPLOT_TOKENS;

// --- Data: iris measurements (sepal_len, sepal_wid, petal_len, petal_wid) ---
const ITEMS = [
  { label: "Setosa 1",    f: [5.1, 3.5, 1.4, 0.2] },
  { label: "Setosa 2",    f: [4.9, 3.0, 1.4, 0.2] },
  { label: "Setosa 3",    f: [4.7, 3.2, 1.3, 0.2] },
  { label: "Setosa 4",    f: [5.0, 3.6, 1.4, 0.2] },
  { label: "Versicolor 1", f: [7.0, 3.2, 4.7, 1.4] },
  { label: "Versicolor 2", f: [6.4, 3.2, 4.5, 1.5] },
  { label: "Versicolor 3", f: [6.9, 3.1, 4.9, 1.5] },
  { label: "Versicolor 4", f: [5.5, 2.3, 4.0, 1.3] },
  { label: "Virginica 1", f: [6.3, 3.3, 6.0, 2.5] },
  { label: "Virginica 2", f: [5.8, 2.7, 5.1, 1.9] },
  { label: "Virginica 3", f: [7.1, 3.0, 5.9, 2.1] },
  { label: "Virginica 4", f: [6.3, 2.9, 5.6, 1.8] },
];

const n = ITEMS.length;

// --- Pairwise Euclidean distances ---
const distMat = Array.from({ length: n }, (_, i) =>
  Array.from({ length: n }, (_, j) => {
    const a = ITEMS[i].f, b = ITEMS[j].f;
    return Math.sqrt(a.reduce((s, v, k) => s + (v - b[k]) ** 2, 0));
  })
);

// --- Average-linkage agglomerative clustering ---
function buildTree() {
  const leaves = ITEMS.map((_, i) => ({ type: "leaf", idx: i }));
  let active = leaves.map((node, i) => ({ node, members: [i] }));

  while (active.length > 1) {
    let minD = Infinity, mi = 0, mj = 1;
    for (let i = 0; i < active.length; i++) {
      for (let j = i + 1; j < active.length; j++) {
        let sum = 0;
        for (const a of active[i].members)
          for (const b of active[j].members)
            sum += distMat[a][b];
        const d = sum / (active[i].members.length * active[j].members.length);
        if (d < minD) { minD = d; mi = i; mj = j; }
      }
    }
    const merged = {
      node: {
        type: "internal",
        left: active[mi].node,
        right: active[mj].node,
        height: minD,
      },
      members: [...active[mi].members, ...active[mj].members],
    };
    active = active.filter((_, k) => k !== mi && k !== mj);
    active.push(merged);
  }
  return active[0].node;
}

const root = buildTree();

// --- DFS to determine left-to-right leaf order ---
const leafOrder = [];
(function dfs(node) {
  if (node.type === "leaf") { leafOrder.push(node.idx); return; }
  dfs(node.left);
  dfs(node.right);
})(root);

const leafPos = {};
leafOrder.forEach((idx, pos) => { leafPos[idx] = pos; });

// --- Species → Imprint palette color ---
function speciesColor(name) {
  if (name === "Setosa")   return t.palette[0];  // brand green
  if (name === "Versicolor") return t.palette[1];  // lavender
  return t.palette[2];                            // blue
}

// --- Collect bridge segments (U-shaped connectors at each merge height) ---
const bridges = [];
(function collectBridges(node) {
  if (node.type === "leaf") {
    const species = ITEMS[node.idx].label.split(" ")[0];
    return { x: leafPos[node.idx], topH: 0, species: new Set([species]) };
  }
  const left  = collectBridges(node.left);
  const right = collectBridges(node.right);
  const h     = node.height;
  const merged = new Set([...left.species, ...right.species]);
  const color  = merged.size === 1 ? speciesColor([...merged][0]) : t.inkSoft;

  bridges.push({
    points: [
      { x: left.x,  y: left.topH  },
      { x: left.x,  y: h          },
      { x: right.x, y: h          },
      { x: right.x, y: right.topH },
    ],
    color,
  });
  return { x: (left.x + right.x) / 2, topH: h, species: merged };
})(root);

const maxH = Math.max(...bridges.map(b => b.points[1].y)) * 1.12;

// --- Mount ---
document.getElementById("container").style.background = t.pageBg;
const canvas = document.createElement("canvas");
document.getElementById("container").appendChild(canvas);

// --- Chart ---
const TITLE = "dendrogram-basic · javascript · chartjs · anyplot.ai";

new Chart(canvas, {
  type: "scatter",
  data: {
    datasets: bridges.map((b) => ({
      data: b.points,
      showLine: true,
      borderColor: b.color,
      borderWidth: 2.5,
      pointRadius: 0,
      fill: false,
      tension: 0,
    })),
  },
  options: {
    responsive: true,
    maintainAspectRatio: false,
    animation: false,
    plugins: {
      title: {
        display: true,
        text: TITLE,
        color: t.ink,
        font: { size: 22, weight: "500" },
        padding: { top: 20, bottom: 16 },
      },
      legend: { display: false },
    },
    scales: {
      x: {
        type: "linear",
        min: -0.5,
        max: n - 0.5,
        border: { color: t.inkSoft },
        grid: { color: t.grid },
        afterBuildTicks: (axis) => {
          axis.ticks = Array.from({ length: n }, (_, i) => ({ value: i }));
        },
        ticks: {
          callback: (value) => {
            const idx = Math.round(value);
            if (idx >= 0 && idx < n) return ITEMS[leafOrder[idx]].label;
            return null;
          },
          color: t.inkSoft,
          font: { size: 13 },
          maxRotation: 45,
          minRotation: 45,
        },
      },
      y: {
        min: 0,
        max: maxH,
        border: { color: t.inkSoft },
        grid: { color: t.grid },
        title: {
          display: true,
          text: "Euclidean Distance",
          color: t.ink,
          font: { size: 16 },
        },
        ticks: {
          color: t.inkSoft,
          font: { size: 14 },
        },
      },
    },
  },
});
Runnable source as JSON, for any HTTP client: https://api.anyplot.ai/specs/dendrogram-basic/chartjs/code. Any spec id and library id listed in llms-full.txt fit the same URL shape; every URL below is complete and callable.
{
  "spec_id": "dendrogram-basic",
  "language": "javascript",
  "library": "chartjs",
  "page": "https://anyplot.ai/dendrogram-basic/javascript/chartjs",
  "hub": "https://anyplot.ai/dendrogram-basic",
  "code_json": "https://api.anyplot.ai/specs/dendrogram-basic/chartjs/code",
  "spec_json": "https://api.anyplot.ai/specs/dendrogram-basic",
  "render_light_png": "https://storage.googleapis.com/anyplot-images/plots/dendrogram-basic/javascript/chartjs/plot-light.png",
  "render_dark_png": "https://storage.googleapis.com/anyplot-images/plots/dendrogram-basic/javascript/chartjs/plot-dark.png",
  "interactive_light_html": "https://storage.googleapis.com/anyplot-images/plots/dendrogram-basic/javascript/chartjs/plot-light.html",
  "interactive_dark_html": "https://storage.googleapis.com/anyplot-images/plots/dendrogram-basic/javascript/chartjs/plot-dark.html",
  "quality_score": 89.0,
  "license": "MIT",
  "guide": "https://anyplot.ai/llms.txt"
}
Part of Basic Dendrogram on anyplot.ai.