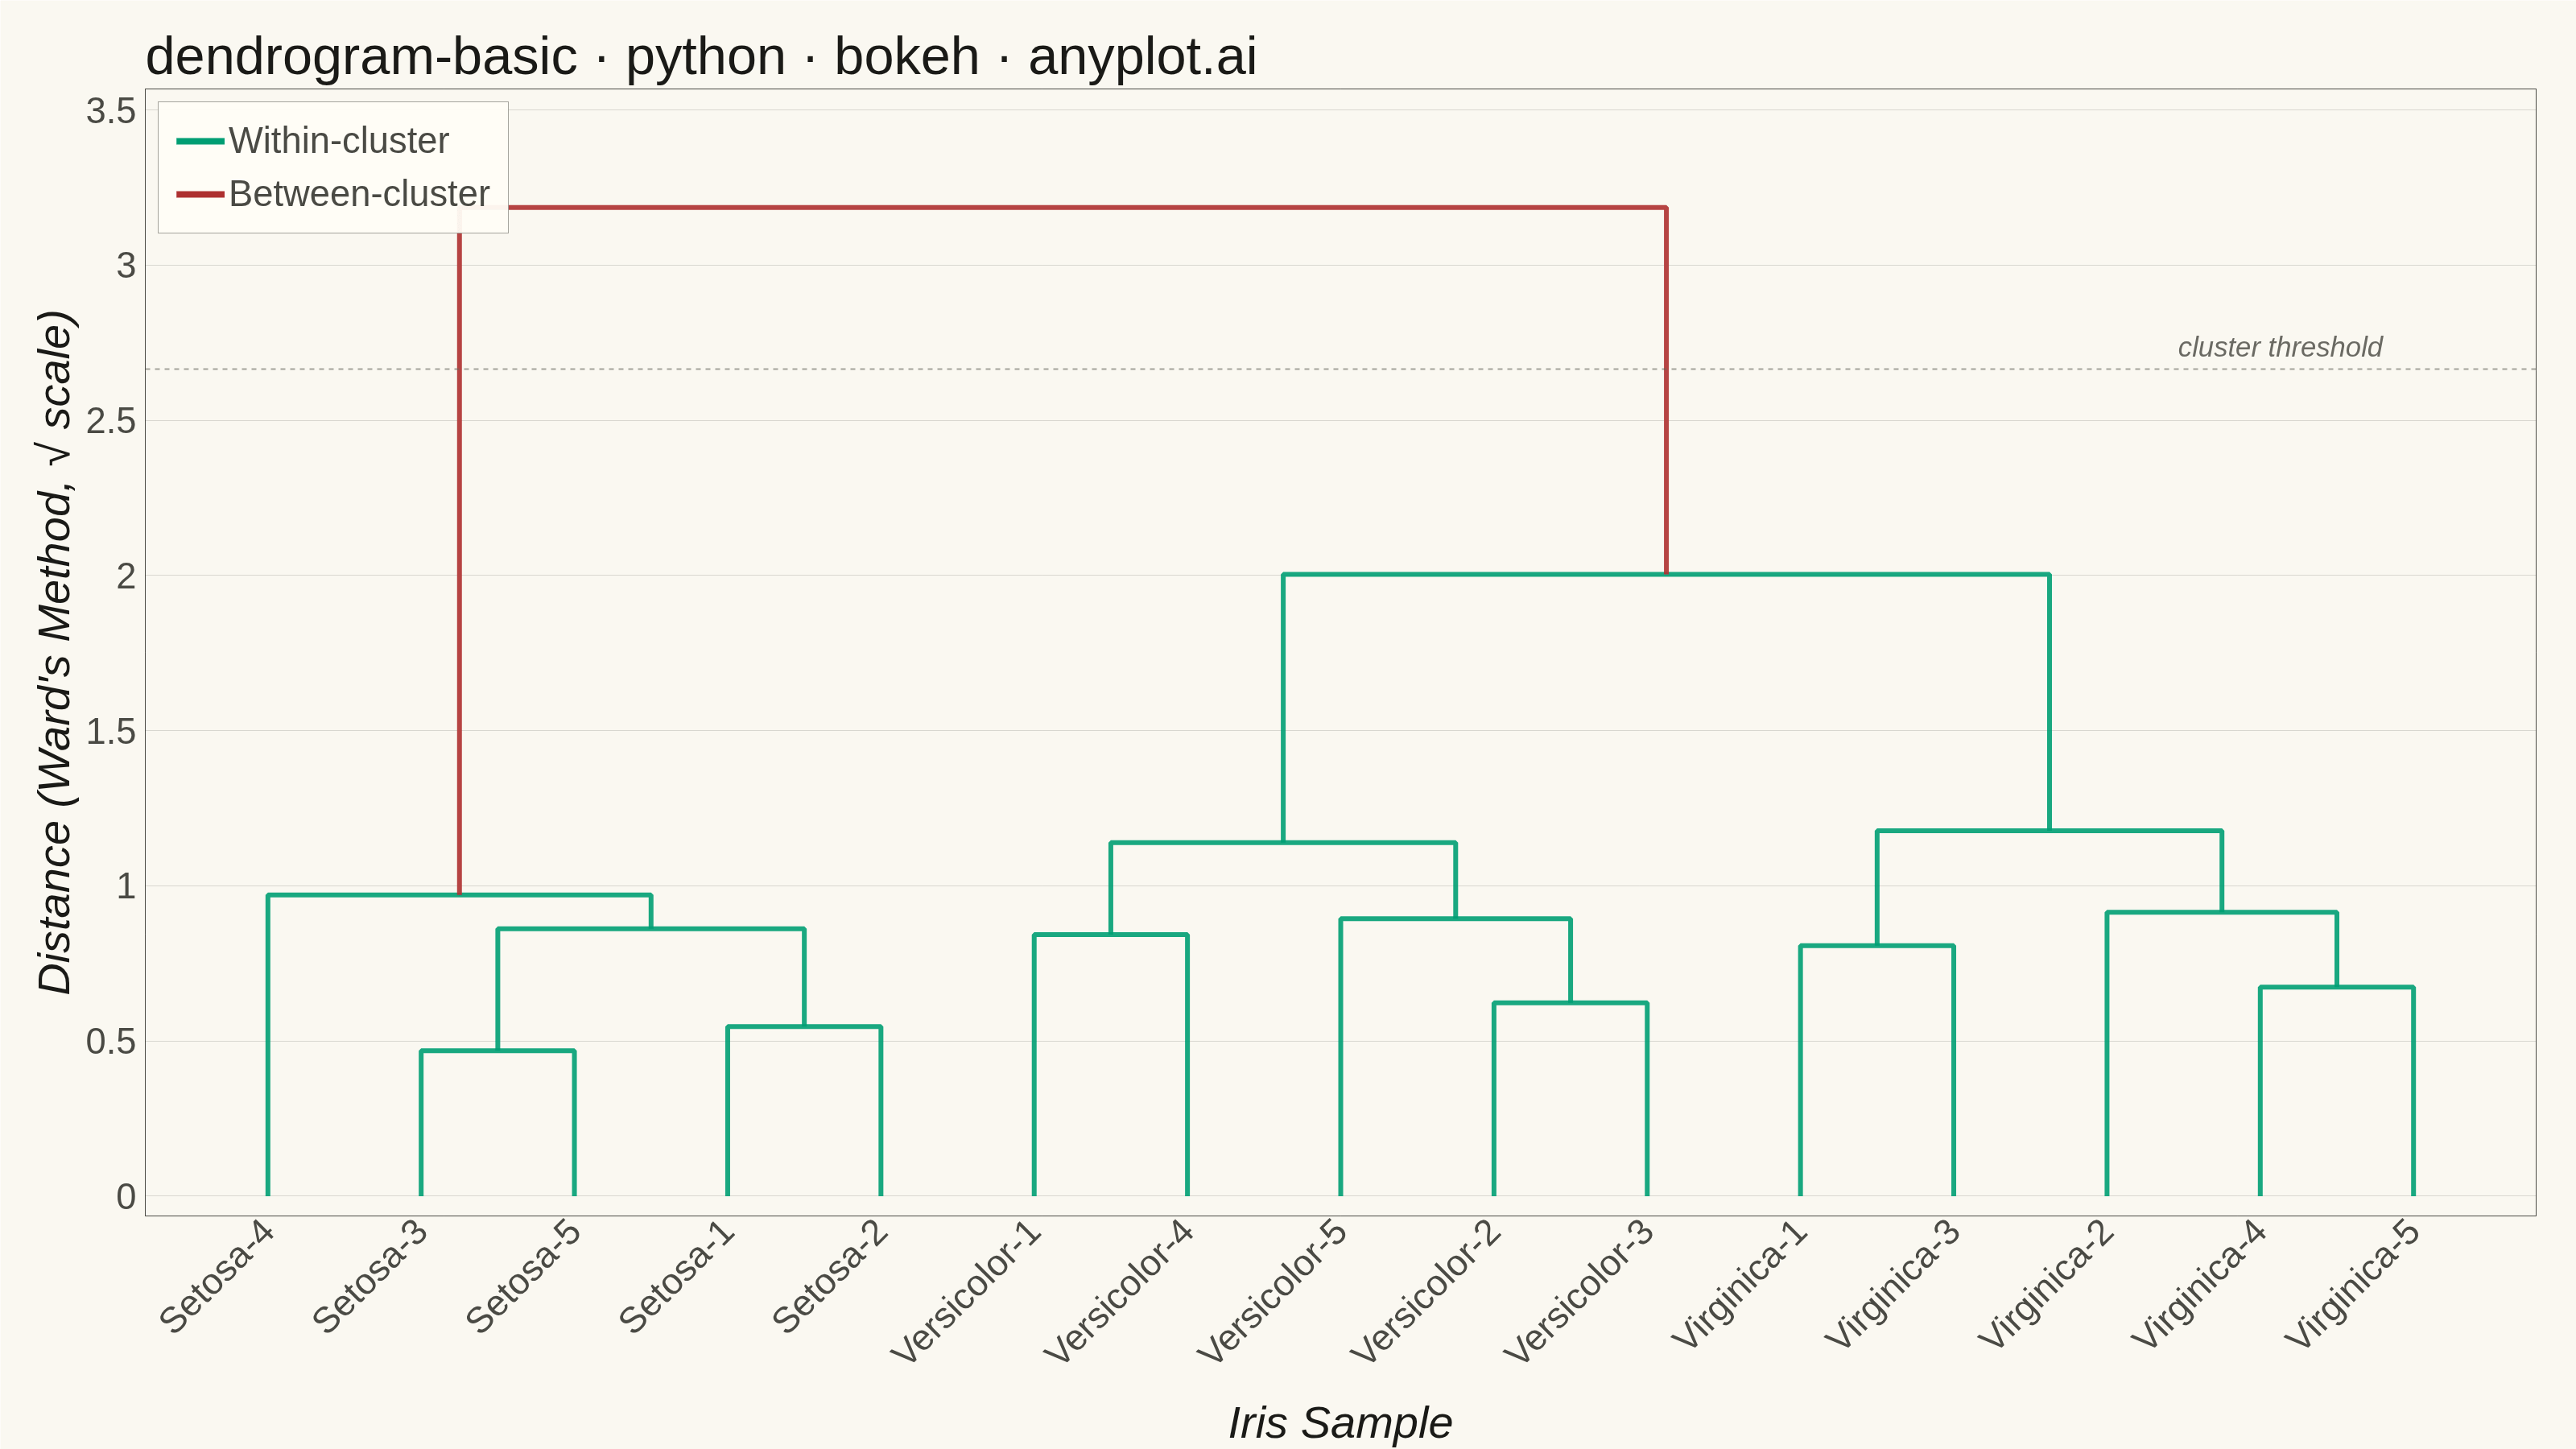
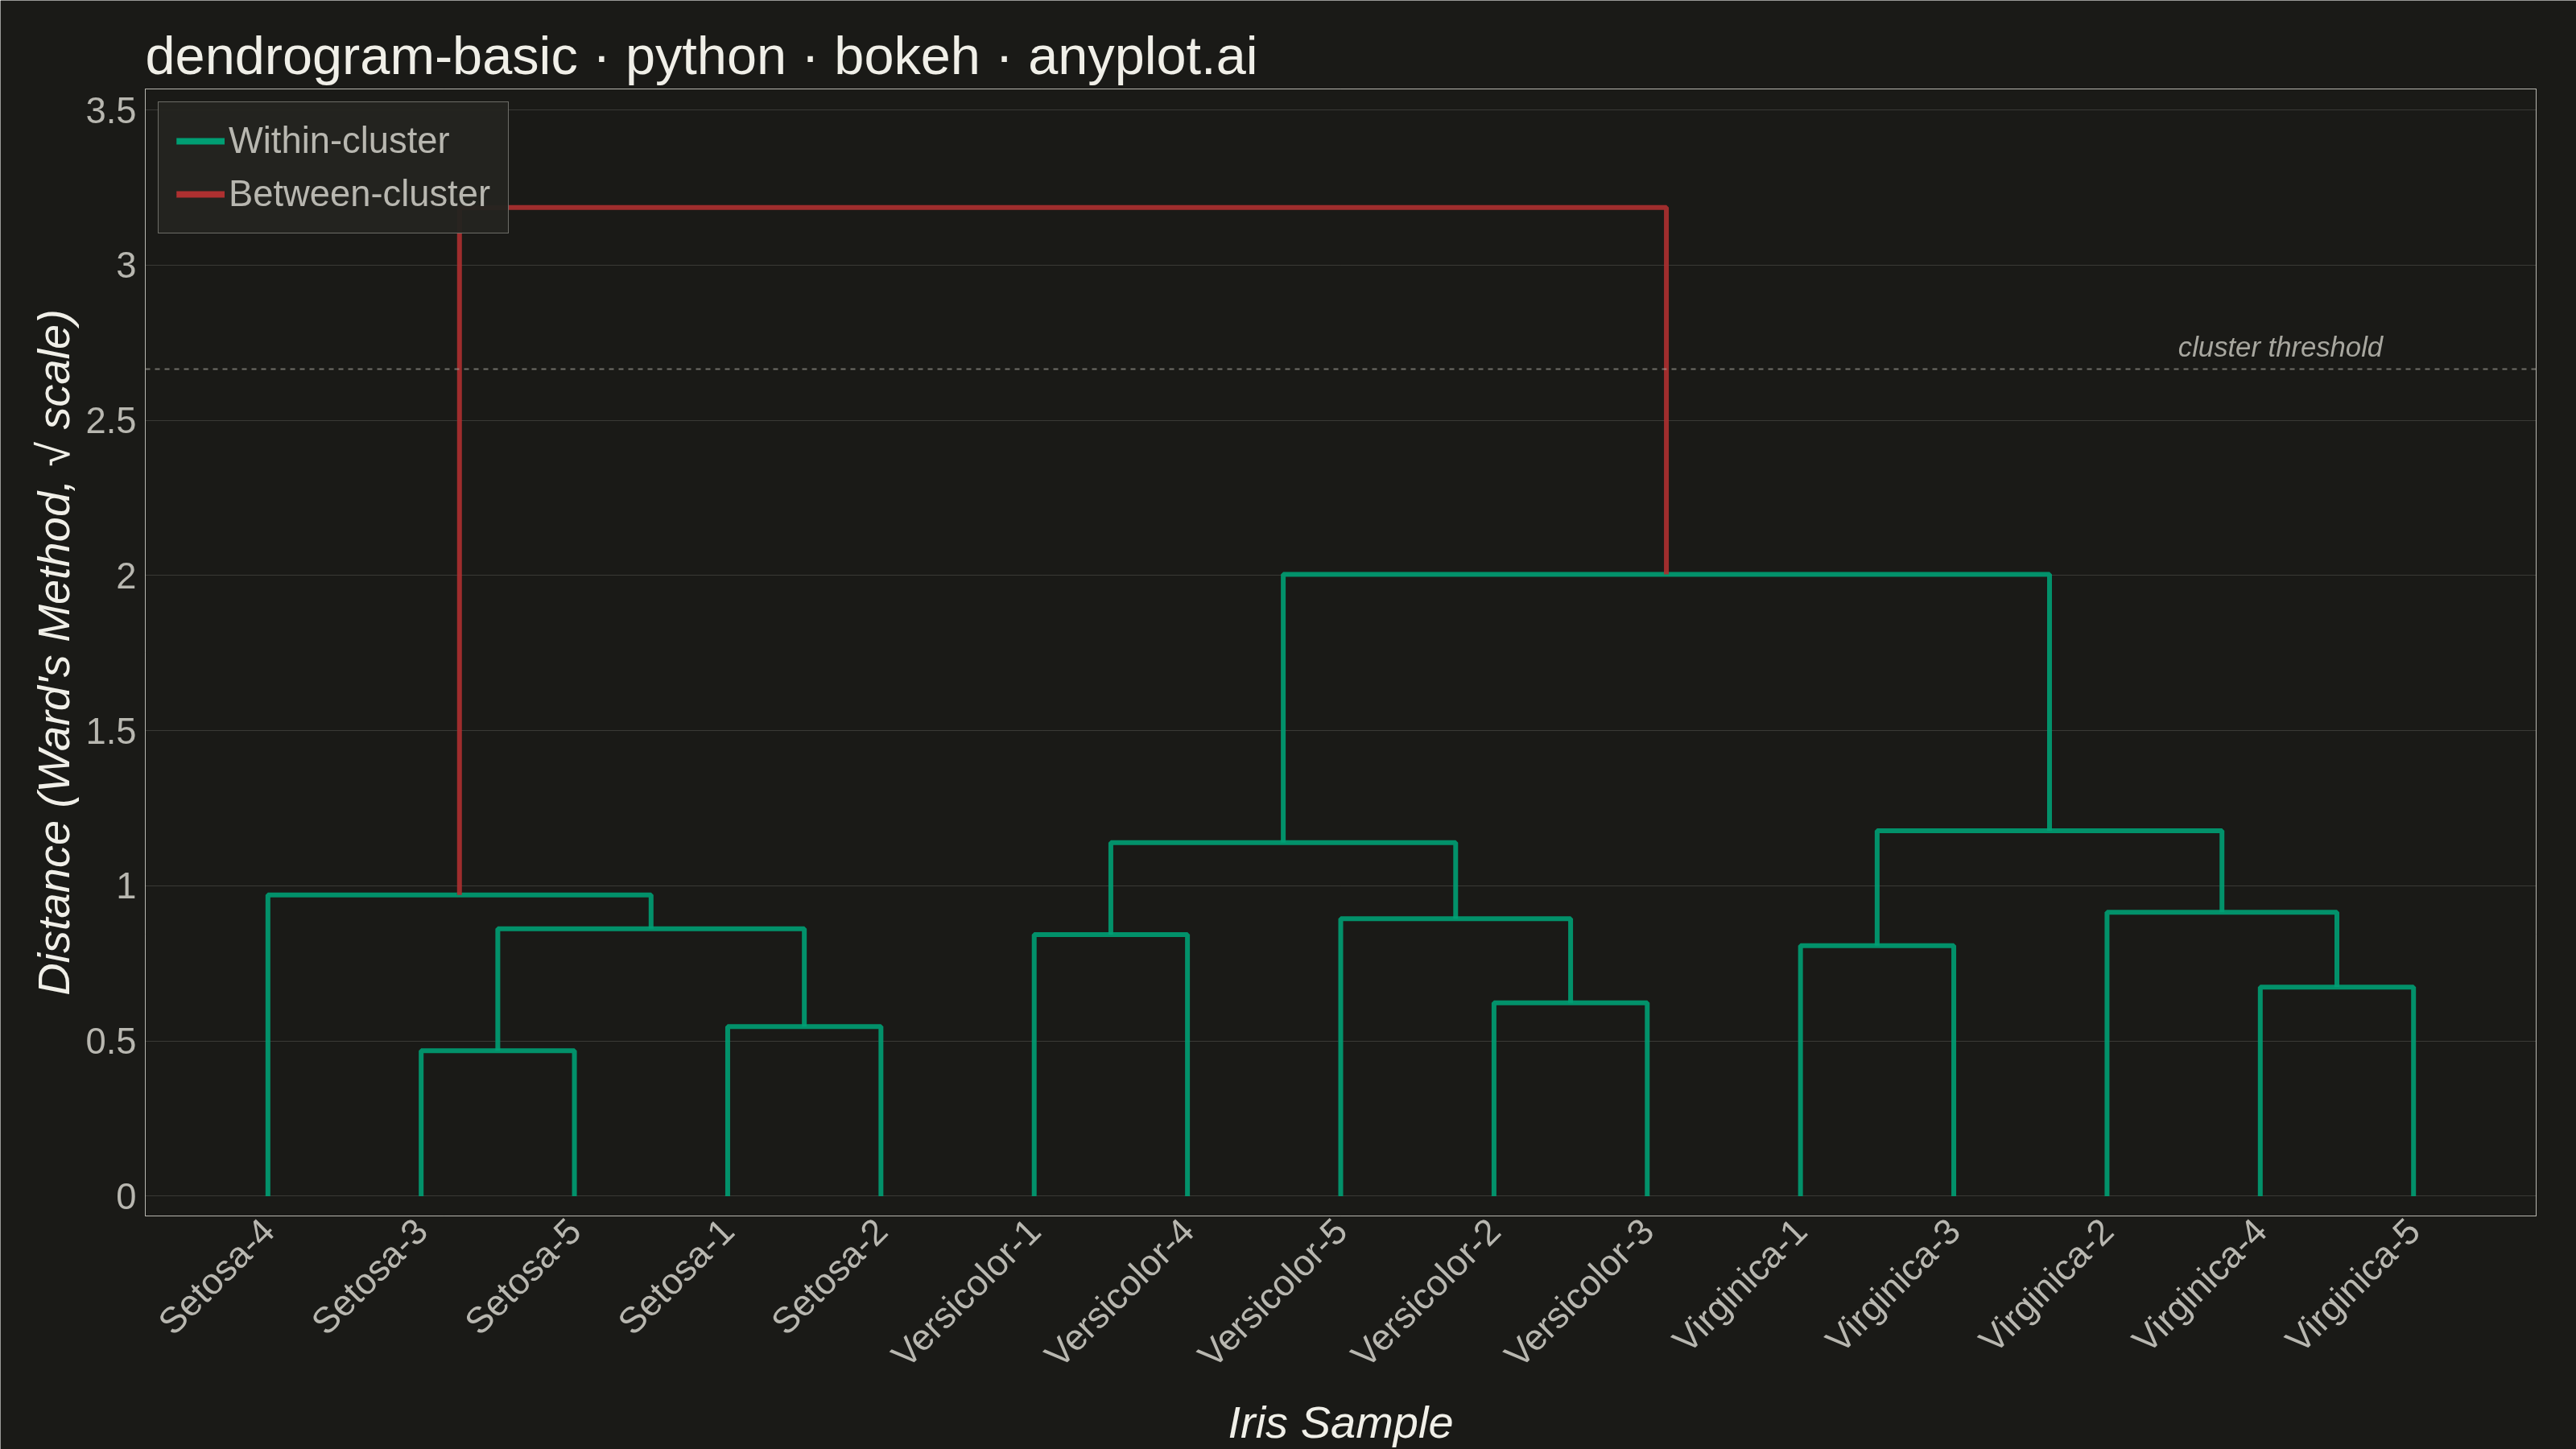
A dendrogram visualizes hierarchical clustering by showing how data points or clusters merge at different distance levels. The tree-like structure reveals relationships and similarity between items, with branch heights indicating the distance at which clusters merge. This visualization is essential for understanding the hierarchical structure in data and identifying natural groupings.
""" anyplot.ai
dendrogram-basic: Basic Dendrogram
Library: bokeh 3.9.1 | Python 3.13.13
Quality: 91/100 | Updated: 2026-06-18
"""

import io
import os
import time
from pathlib import Path

import numpy as np
from bokeh.io import output_file, save
from bokeh.models import ColumnDataSource, FixedTicker, HoverTool, Label, Span
from bokeh.plotting import figure
from PIL import Image
from scipy.cluster.hierarchy import leaves_list, linkage
from selenium import webdriver
from selenium.webdriver.chrome.options import Options


# Theme tokens (see prompts/default-style-guide.md)
THEME = os.getenv("ANYPLOT_THEME", "light")
PAGE_BG = "#FAF8F1" if THEME == "light" else "#1A1A17"
ELEVATED_BG = "#FFFDF6" if THEME == "light" else "#242420"
INK = "#1A1A17" if THEME == "light" else "#F0EFE8"
INK_SOFT = "#4A4A44" if THEME == "light" else "#B8B7B0"
INK_MUTED = "#6B6A63" if THEME == "light" else "#A8A79F"

# Imprint palette — semantic assignment
COLOR_WITHIN = "#009E73"  # brand green — within-cluster cohesion
COLOR_BETWEEN = "#AE3030"  # matte red — cross-cluster boundary (semantic: separation)

# Data — Iris flower measurements (4 features, 15 samples)
np.random.seed(42)
samples_per_species = 5
labels = []
data = []

# Setosa: shorter petals, wider sepals
for i in range(samples_per_species):
    labels.append(f"Setosa-{i + 1}")
    data.append(
        [
            5.0 + np.random.randn() * 0.3,
            3.4 + np.random.randn() * 0.3,
            1.5 + np.random.randn() * 0.2,
            0.3 + np.random.randn() * 0.1,
        ]
    )

# Versicolor: medium measurements
for i in range(samples_per_species):
    labels.append(f"Versicolor-{i + 1}")
    data.append(
        [
            5.9 + np.random.randn() * 0.4,
            2.8 + np.random.randn() * 0.3,
            4.3 + np.random.randn() * 0.4,
            1.3 + np.random.randn() * 0.2,
        ]
    )

# Virginica: longer petals and sepals
for i in range(samples_per_species):
    labels.append(f"Virginica-{i + 1}")
    data.append(
        [
            6.6 + np.random.randn() * 0.5,
            3.0 + np.random.randn() * 0.3,
            5.5 + np.random.randn() * 0.5,
            2.0 + np.random.randn() * 0.3,
        ]
    )

data = np.array(data)
n_samples = len(labels)

# Hierarchical clustering via Ward's method
linkage_matrix = linkage(data, method="ward")
leaf_order = leaves_list(linkage_matrix)
ordered_labels = [labels[i] for i in leaf_order]

# Map each node to its x position
node_positions = {leaf_idx: idx for idx, leaf_idx in enumerate(leaf_order)}

# Track cluster members for hover tooltips
cluster_members = {i: [labels[i]] for i in range(n_samples)}

max_dist = linkage_matrix[:, 2].max()
color_threshold = 0.7 * max_dist

# Build U-shaped connector segments for each merge
all_xs, all_ys = [], []
all_colors, all_distances, all_left_items, all_right_items, all_cluster_sizes = [], [], [], [], []

for i, (left, right, dist, count) in enumerate(linkage_matrix):
    left, right = int(left), int(right)
    new_node = n_samples + i

    left_x = node_positions[left]
    right_x = node_positions[right]
    left_y = 0 if left < n_samples else linkage_matrix[left - n_samples, 2]
    right_y = 0 if right < n_samples else linkage_matrix[right - n_samples, 2]

    node_positions[new_node] = (left_x + right_x) / 2

    left_members = cluster_members[left]
    right_members = cluster_members[right]
    cluster_members[new_node] = left_members + right_members

    all_xs.append([left_x, left_x, right_x, right_x])
    all_ys.append([left_y, dist, dist, right_y])
    all_colors.append(COLOR_BETWEEN if dist > color_threshold else COLOR_WITHIN)
    all_distances.append(f"{dist:.2f}")
    all_left_items.append(", ".join(left_members[:3]) + ("..." if len(left_members) > 3 else ""))
    all_right_items.append(", ".join(right_members[:3]) + ("..." if len(right_members) > 3 else ""))
    all_cluster_sizes.append(str(int(count)))

# Sqrt-scale y values for better visibility of lower-level merges
sqrt_max = np.sqrt(max_dist)
all_ys_scaled = [[np.sqrt(y) for y in ys] for ys in all_ys]

# Plot — landscape 3200×1800 (canonical)
W, H = 3200, 1800
title = "dendrogram-basic · python · bokeh · anyplot.ai"
p = figure(
    width=W,
    height=H,
    title=title,
    x_axis_label="Iris Sample",
    y_axis_label="Distance (Ward's Method, √ scale)",
    x_range=(-0.8, n_samples - 0.2),
    y_range=(-sqrt_max * 0.02, sqrt_max * 1.12),
    toolbar_location=None,
    min_border_bottom=160,
    min_border_left=180,
    min_border_top=110,
    min_border_right=50,
)

# Dendrogram branches
source = ColumnDataSource(
    data={
        "xs": all_xs,
        "ys": all_ys_scaled,
        "color": all_colors,
        "distance": all_distances,
        "left_cluster": all_left_items,
        "right_cluster": all_right_items,
        "cluster_size": all_cluster_sizes,
    }
)

branch_renderer = p.multi_line(
    xs="xs",
    ys="ys",
    source=source,
    line_width=6,
    line_color="color",
    line_alpha=0.9,
    hover_line_width=9,
    hover_line_alpha=1.0,
    hover_line_color="#BD8233",
)

hover = HoverTool(
    renderers=[branch_renderer],
    tooltips=[
        ("Merge Distance", "@distance"),
        ("Cluster Size", "@cluster_size items"),
        ("Left", "@left_cluster"),
        ("Right", "@right_cluster"),
    ],
    line_policy="interp",
)
p.add_tools(hover)

# Cluster threshold line
threshold_y_scaled = np.sqrt(color_threshold)
p.add_layout(
    Span(
        location=threshold_y_scaled,
        dimension="width",
        line_color=INK_MUTED,
        line_dash="dashed",
        line_width=2,
        line_alpha=0.6,
    )
)
p.add_layout(
    Label(
        x=n_samples - 1.2,
        y=threshold_y_scaled,
        text="cluster threshold",
        text_font_size="26pt",
        text_color=INK_MUTED,
        text_font_style="italic",
        y_offset=8,
        text_align="right",
    )
)

# Legend via off-screen glyphs
p.line([-99, -98], [-99, -99], line_color=COLOR_WITHIN, line_width=8, legend_label="Within-cluster")
p.line([-99, -98], [-99, -99], line_color=COLOR_BETWEEN, line_width=8, legend_label="Between-cluster")

# Leaf labels on x-axis
p.xaxis.ticker = FixedTicker(ticks=list(range(n_samples)))
p.xaxis.major_label_overrides = {i: ordered_labels[i] for i in range(n_samples)}
p.xaxis.major_label_orientation = 0.785  # 45 degrees

# Style — canonical font sizes per bokeh.md
p.title.text_font_size = "50pt"
p.title.text_font_style = "normal"
p.title.text_color = INK
p.xaxis.axis_label_text_font_size = "42pt"
p.yaxis.axis_label_text_font_size = "42pt"
p.xaxis.axis_label_text_color = INK
p.yaxis.axis_label_text_color = INK
p.xaxis.major_label_text_font_size = "34pt"
p.xaxis.major_label_text_color = INK_SOFT
p.yaxis.major_label_text_font_size = "34pt"
p.yaxis.major_label_text_color = INK_SOFT

p.background_fill_color = PAGE_BG
p.border_fill_color = PAGE_BG
p.outline_line_color = INK_SOFT

p.xgrid.visible = False
p.ygrid.grid_line_color = INK
p.ygrid.grid_line_alpha = 0.15

# Remove axis lines (address review weakness)
p.xaxis.axis_line_color = None
p.yaxis.axis_line_color = None
p.xaxis.major_tick_line_color = None
p.xaxis.minor_tick_line_color = None
p.yaxis.major_tick_line_color = None
p.yaxis.minor_tick_line_color = None

# Legend
p.legend.location = "top_left"
p.legend.label_text_font_size = "34pt"
p.legend.label_text_color = INK_SOFT
p.legend.background_fill_color = ELEVATED_BG
p.legend.border_line_color = INK_SOFT
p.legend.glyph_width = 60
p.legend.glyph_height = 10
p.legend.spacing = 14
p.legend.padding = 22
p.legend.margin = 16

# Save HTML then screenshot via headless Chrome (export_png unavailable in CI)
output_file(f"plot-{THEME}.html")
save(p)

opts = Options()
for arg in (
    "--headless=new",
    "--no-sandbox",
    "--disable-dev-shm-usage",
    "--disable-gpu",
    f"--window-size={W},{H + 200}",
    "--hide-scrollbars",
):
    opts.add_argument(arg)
driver = webdriver.Chrome(options=opts)
driver.set_window_size(W, H + 200)
driver.get(f"file://{Path(f'plot-{THEME}.html').resolve()}")
time.sleep(3)
raw = driver.get_screenshot_as_png()
driver.quit()
Image.open(io.BytesIO(raw)).crop((0, 0, W, H)).save(f"plot-{THEME}.png")
Runnable source as JSON, for any HTTP client: https://api.anyplot.ai/specs/dendrogram-basic/bokeh/code. Any spec id and library id listed in llms-full.txt fit the same URL shape; every URL below is complete and callable.
{
  "spec_id": "dendrogram-basic",
  "language": "python",
  "library": "bokeh",
  "page": "https://anyplot.ai/dendrogram-basic/python/bokeh",
  "hub": "https://anyplot.ai/dendrogram-basic",
  "code_json": "https://api.anyplot.ai/specs/dendrogram-basic/bokeh/code",
  "spec_json": "https://api.anyplot.ai/specs/dendrogram-basic",
  "render_light_png": "https://storage.googleapis.com/anyplot-images/plots/dendrogram-basic/python/bokeh/plot-light.png",
  "render_dark_png": "https://storage.googleapis.com/anyplot-images/plots/dendrogram-basic/python/bokeh/plot-dark.png",
  "interactive_light_html": "https://storage.googleapis.com/anyplot-images/plots/dendrogram-basic/python/bokeh/plot-light.html",
  "interactive_dark_html": "https://storage.googleapis.com/anyplot-images/plots/dendrogram-basic/python/bokeh/plot-dark.html",
  "quality_score": 91.0,
  "license": "MIT",
  "guide": "https://anyplot.ai/llms.txt"
}
Part of Basic Dendrogram on anyplot.ai.