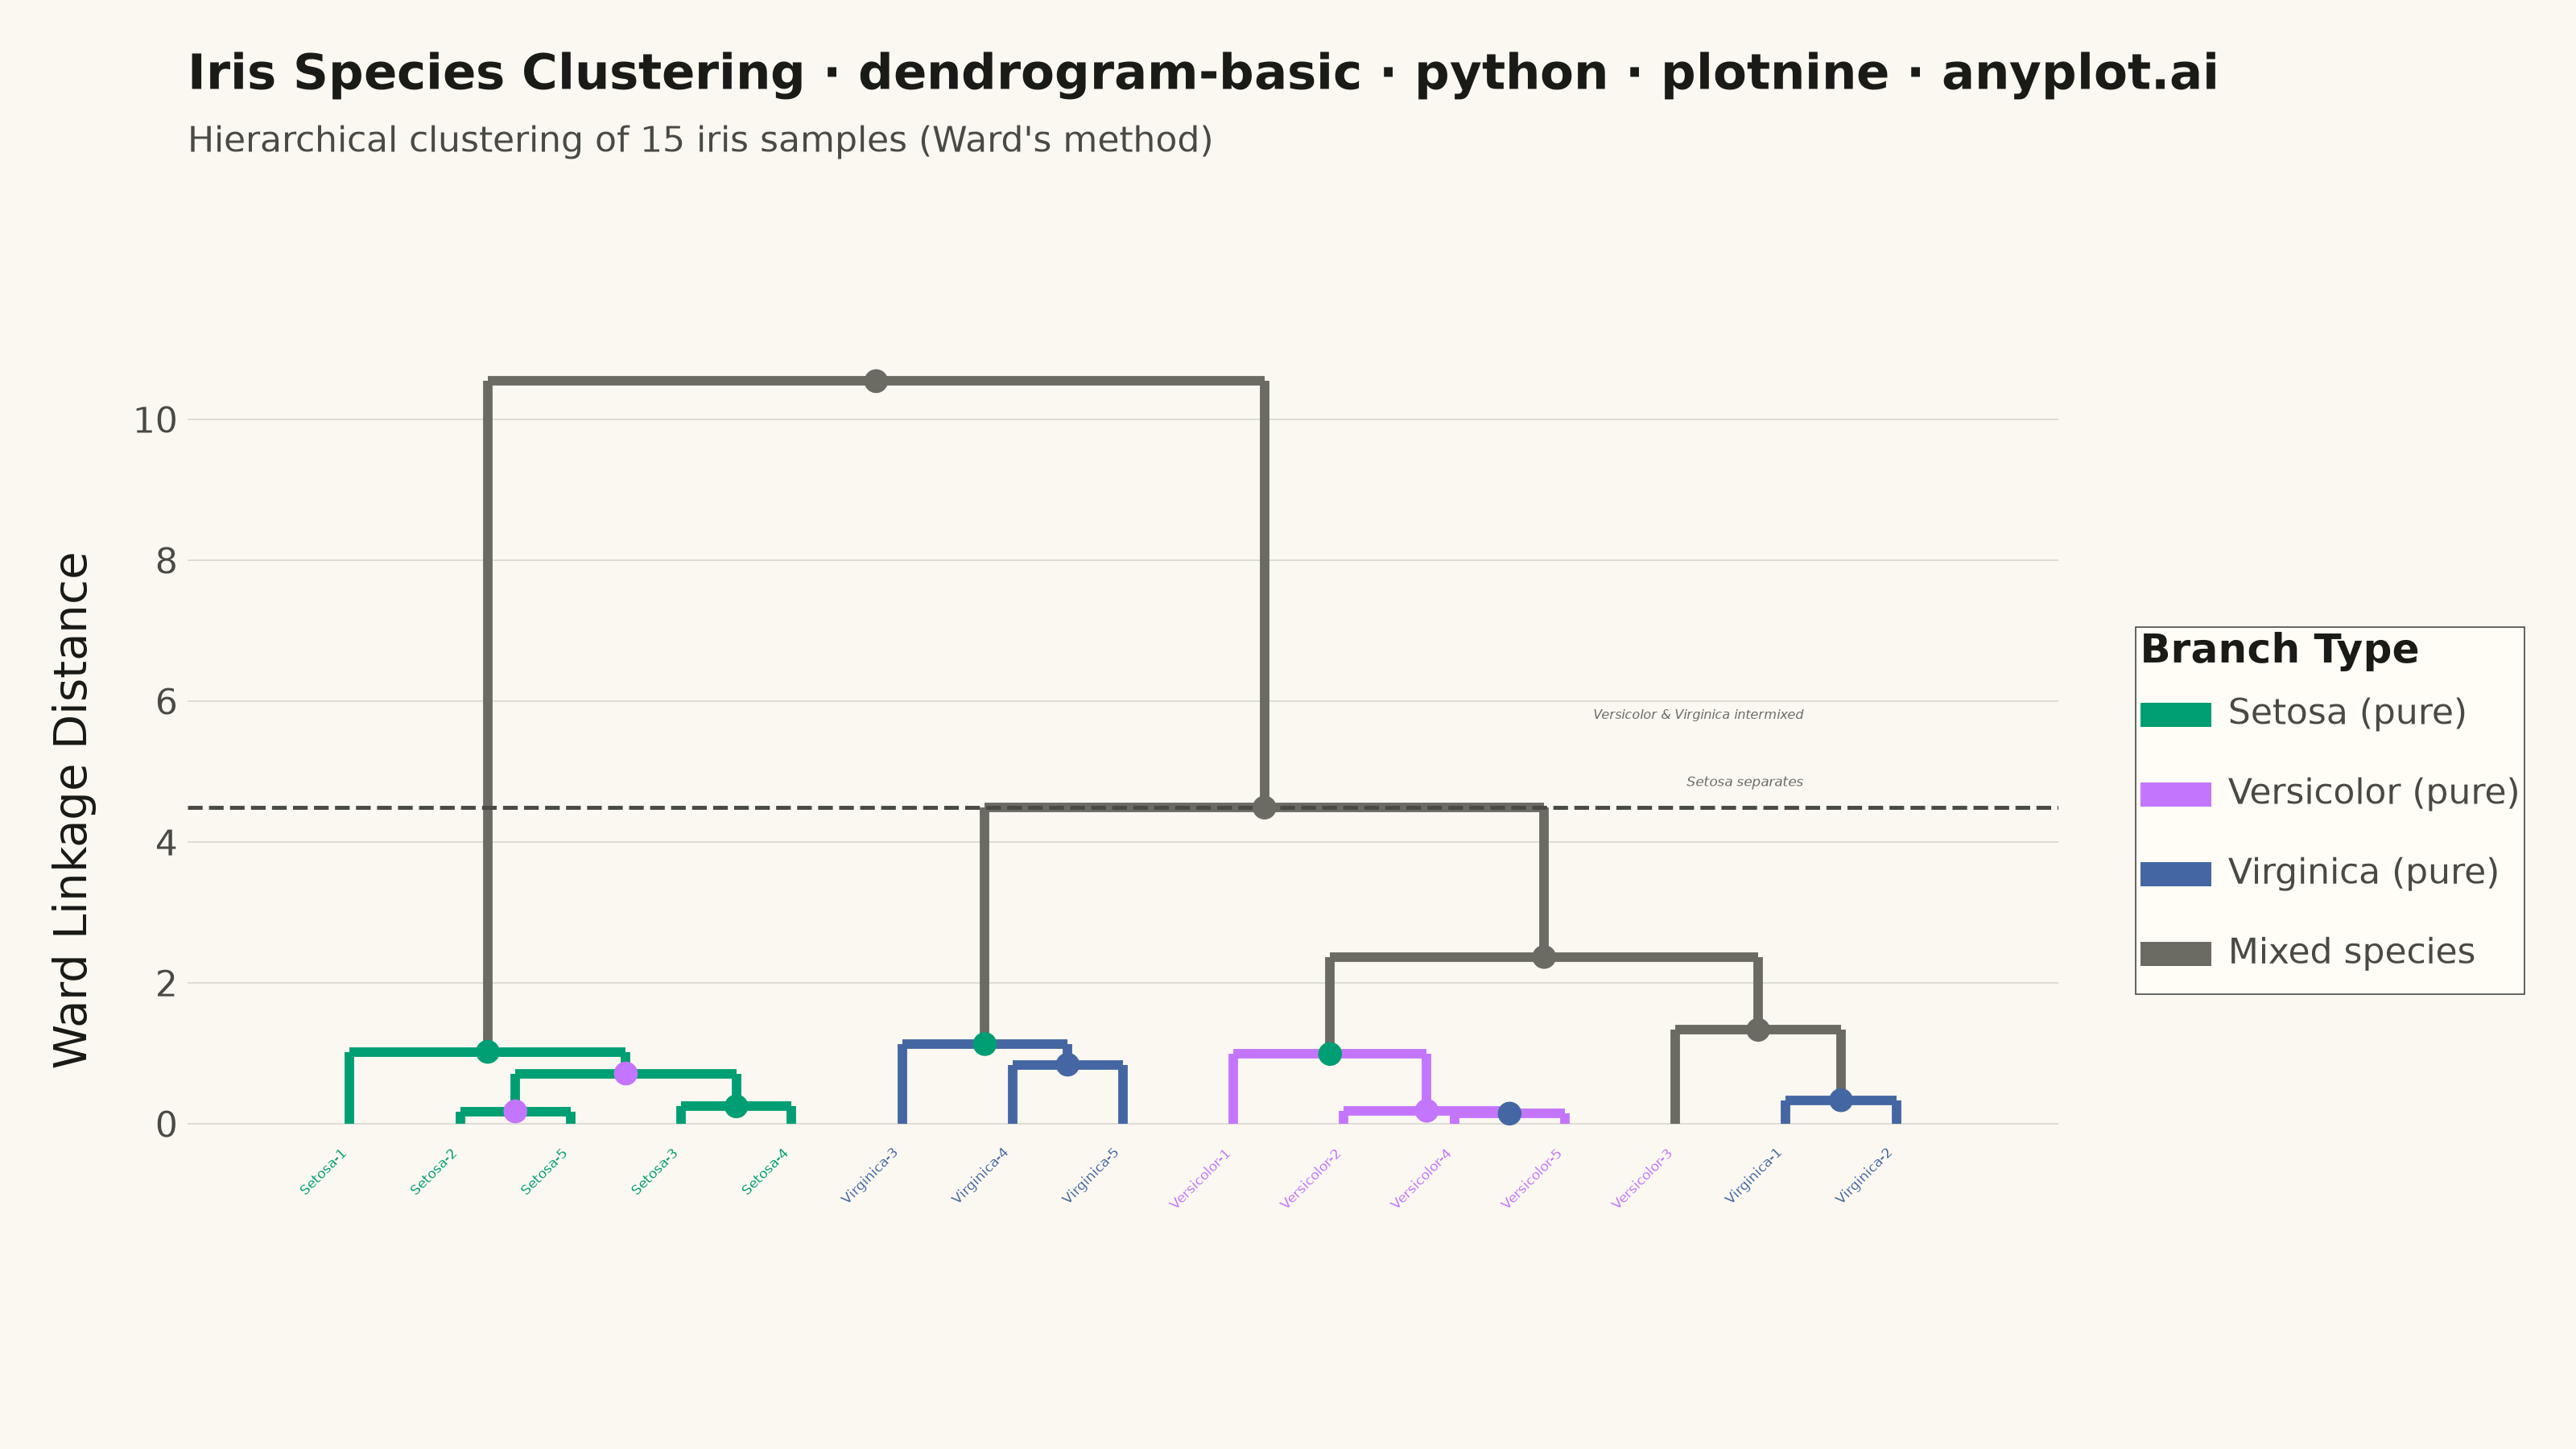
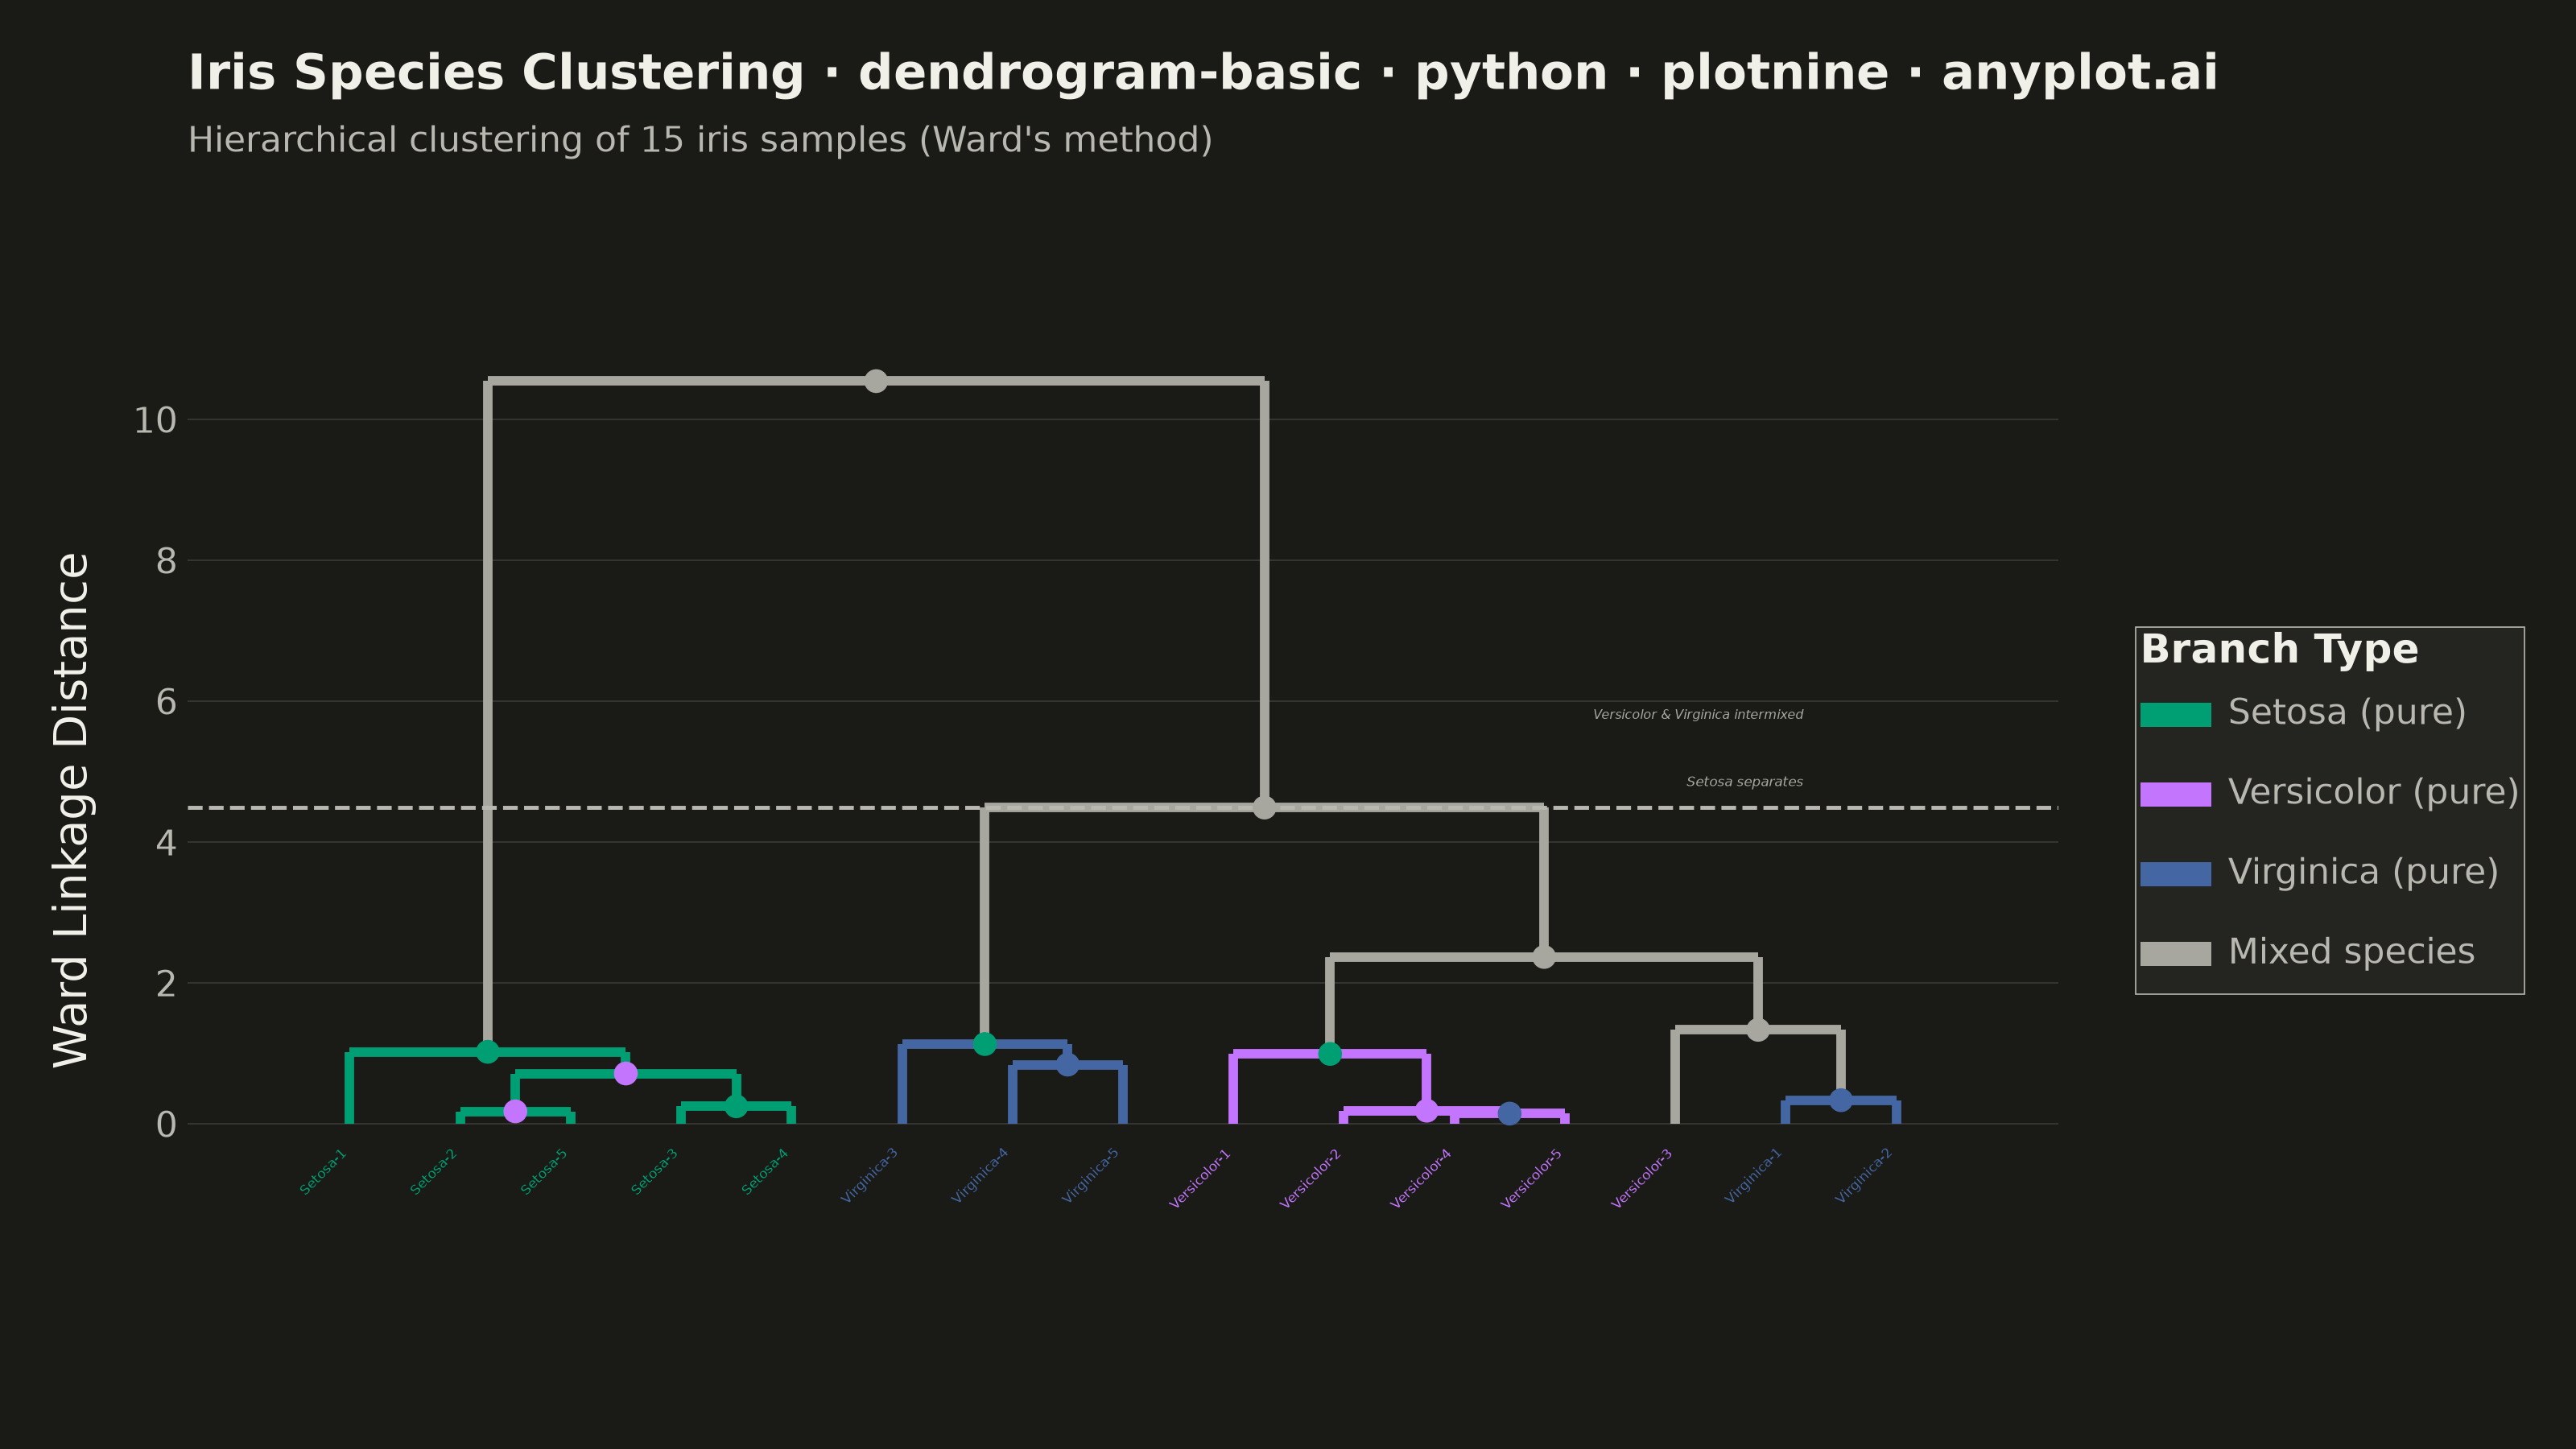
A dendrogram visualizes hierarchical clustering by showing how data points or clusters merge at different distance levels. The tree-like structure reveals relationships and similarity between items, with branch heights indicating the distance at which clusters merge. This visualization is essential for understanding the hierarchical structure in data and identifying natural groupings.
""" anyplot.ai
dendrogram-basic: Basic Dendrogram
Library: plotnine 0.15.7 | Python 3.13.13
Quality: 90/100 | Updated: 2026-06-18
"""

import os
import sys


# Prevent this script's directory from shadowing the installed plotnine package.
sys.path = [p for p in sys.path if os.path.abspath(p or ".") != os.path.dirname(os.path.abspath(__file__))]

import numpy as np
import pandas as pd
from plotnine import (
    aes,
    annotate,
    coord_cartesian,
    element_blank,
    element_line,
    element_rect,
    element_text,
    geom_hline,
    geom_point,
    geom_segment,
    geom_text,
    ggplot,
    guide_legend,
    guides,
    labs,
    scale_color_manual,
    scale_x_continuous,
    scale_y_continuous,
    theme,
    theme_minimal,
)
from scipy.cluster.hierarchy import dendrogram, linkage
from sklearn.datasets import load_iris


# Theme-adaptive chrome tokens (Imprint style guide)
THEME = os.getenv("ANYPLOT_THEME", "light")
PAGE_BG = "#FAF8F1" if THEME == "light" else "#1A1A17"
ELEVATED_BG = "#FFFDF6" if THEME == "light" else "#242420"
INK = "#1A1A17" if THEME == "light" else "#F0EFE8"
INK_SOFT = "#4A4A44" if THEME == "light" else "#B8B7B0"
INK_MUTED = "#6B6A63" if THEME == "light" else "#A8A79F"

# Imprint categorical palette — hybrid-v3 sort, first series always #009E73
IMPRINT = ["#009E73", "#C475FD", "#4467A3", "#BD8233", "#AE3030", "#2ABCCD", "#954477", "#99B314"]

# Data — real iris flower measurements, 15 samples (5 per species)
iris = load_iris()
np.random.seed(42)
species_names = ["Setosa", "Versicolor", "Virginica"]
species_counts = dict.fromkeys(species_names, 0)
sample_labels = []
indices = np.concatenate([np.random.choice(np.where(iris.target == i)[0], 5, replace=False) for i in range(3)])
for i in indices:
    name = species_names[iris.target[i]]
    species_counts[name] += 1
    sample_labels.append(f"{name}-{species_counts[name]}")
features = iris.data[indices]

# Hierarchical clustering with Ward's method
linkage_matrix = linkage(features, method="ward")

# Color map: Imprint palette in canonical order, INK_MUTED for mixed branches
color_map = {
    "Setosa (pure)": IMPRINT[0],  # #009E73 — first series always
    "Versicolor (pure)": IMPRINT[1],  # #C475FD
    "Virginica (pure)": IMPRINT[2],  # #4467A3
    "Mixed species": INK_MUTED,  # theme-adaptive for other/rest
}

# Extract dendrogram coordinates (no_plot suppresses matplotlib output)
dend = dendrogram(linkage_matrix, labels=sample_labels, no_plot=True)

# Track species composition of each node for branch coloring
n = len(sample_labels)
leaf_species = {lbl: lbl.rsplit("-", 1)[0] for lbl in sample_labels}
node_species = {}
for i, label in enumerate(sample_labels):
    node_species[i] = {leaf_species[label]}
for i, row in enumerate(linkage_matrix):
    left, right = int(row[0]), int(row[1])
    node_species[n + i] = node_species[left] | node_species[right]

# Branch type: species name if the subtree is pure, "Mixed species" otherwise
branch_type_labels = {"Setosa": "Setosa (pure)", "Versicolor": "Versicolor (pure)", "Virginica": "Virginica (pure)"}
merge_branch_types = []
for i in range(len(linkage_matrix)):
    sp = node_species[n + i]
    merge_branch_types.append(branch_type_labels[next(iter(sp))] if len(sp) == 1 else "Mixed species")

# Map dendrogram order to linkage order via merge heights
height_to_merge = {}
for i, h in enumerate(linkage_matrix[:, 2]):
    height_to_merge.setdefault(round(h, 10), []).append(i)

# Build segment dataframe (three segments per merge join)
segments = []
for xs, ys in zip(dend["icoord"], dend["dcoord"], strict=True):
    h = round(max(ys), 10)
    if h in height_to_merge and height_to_merge[h]:
        merge_idx = height_to_merge[h].pop(0)
        btype = merge_branch_types[merge_idx]
    else:
        btype = "Mixed species"
    segments.append({"x": xs[0], "xend": xs[1], "y": ys[0], "yend": ys[1], "branch_type": btype})
    segments.append({"x": xs[1], "xend": xs[2], "y": ys[1], "yend": ys[2], "branch_type": btype})
    segments.append({"x": xs[2], "xend": xs[3], "y": ys[2], "yend": ys[3], "branch_type": btype})

segments_df = pd.DataFrame(segments)

# Leaf labels colored by species purity
n_leaves = len(dend["ivl"])
leaf_positions = [(i + 1) * 10 - 5 for i in range(n_leaves)]
leaf_labels_list = dend["ivl"]
leaf_btypes = [branch_type_labels[leaf_species[lbl]] for lbl in leaf_labels_list]
label_df = pd.DataFrame(
    {"x": leaf_positions, "label": leaf_labels_list, "y": [0.0] * n_leaves, "branch_type": leaf_btypes}
)

# pd.Categorical for consistent legend ordering
category_order = ["Setosa (pure)", "Versicolor (pure)", "Virginica (pure)", "Mixed species"]
segments_df["branch_type"] = pd.Categorical(segments_df["branch_type"], categories=category_order, ordered=True)
label_df["branch_type"] = pd.Categorical(label_df["branch_type"], categories=category_order, ordered=True)

# Merge node markers — highlight cluster join points
merge_nodes = []
for xs, ys, btype in zip(dend["icoord"], dend["dcoord"], merge_branch_types, strict=True):
    cx = (xs[1] + xs[2]) / 2
    cy = max(ys)
    merge_nodes.append({"x": cx, "y": cy, "branch_type": btype})
merge_df = pd.DataFrame(merge_nodes)
merge_df["branch_type"] = pd.Categorical(merge_df["branch_type"], categories=category_order, ordered=True)

# Threshold line: height where Setosa splits from Versicolor+Virginica
setosa_sep_height = linkage_matrix[-2, 2]
threshold_df = pd.DataFrame({"yintercept": [setosa_sep_height]})

# Title: scale fontsize for title length (67-char baseline at 12pt)
title = "Iris Species Clustering · dendrogram-basic · python · plotnine · anyplot.ai"
title_fontsize = round(12 * 67 / len(title))  # ~11pt for 75-char title

# Plot extents
y_max = max(linkage_matrix[:, 2]) * 1.08
x_min = min(segments_df["x"].min(), segments_df["xend"].min())
x_max = max(segments_df["x"].max(), segments_df["xend"].max())
x_pad = (x_max - x_min) * 0.06

plot = (
    ggplot()
    # Dendrogram branches colored by species purity
    + geom_segment(aes(x="x", xend="xend", y="y", yend="yend", color="branch_type"), data=segments_df, size=1.2)
    # Dashed threshold at Setosa separation height
    + geom_hline(aes(yintercept="yintercept"), data=threshold_df, linetype="dashed", color=INK_SOFT, size=0.5)
    # Annotation: Setosa separation — size in mm (plotnine geom_text scale)
    + annotate(
        "text",
        x=x_max - x_pad,
        y=setosa_sep_height + 0.35,
        label="Setosa separates",
        size=3.0,
        color=INK_MUTED,
        fontstyle="italic",
        ha="right",
    )
    # Annotation: Versicolor/Virginica intermixing
    + annotate(
        "text",
        x=x_max - x_pad,
        y=linkage_matrix[-1, 2] * 0.55,
        label="Versicolor & Virginica intermixed",
        size=2.8,
        color=INK_MUTED,
        fontstyle="italic",
        ha="right",
    )
    # Leaf labels rotated 45° — size in mm
    + geom_text(
        aes(x="x", y="y", label="label", color="branch_type"),
        data=label_df,
        angle=45,
        ha="right",
        va="top",
        size=3.0,
        nudge_y=-0.3,
        show_legend=False,
    )
    # Merge node dots — emphasize join points, hidden from legend
    + geom_point(aes(x="x", y="y", color="branch_type"), data=merge_df, size=2.0, show_legend=False)
    + scale_color_manual(values=color_map, name="Branch Type")
    + guides(color=guide_legend(override_aes={"size": 3, "alpha": 1}))
    + scale_x_continuous(breaks=[], expand=(0.04, 0))
    + scale_y_continuous(breaks=np.arange(0, y_max, 2).tolist(), expand=(0.10, 0))
    + coord_cartesian(xlim=(x_min - x_pad, x_max + x_pad), ylim=(-2.5, y_max))
    + labs(
        x="",
        y="Ward Linkage Distance",
        title=title,
        subtitle="Hierarchical clustering of 15 iris samples (Ward's method)",
    )
    + theme_minimal()
    + theme(
        figure_size=(8, 4.5),
        text=element_text(size=8, family="sans-serif"),
        axis_title_x=element_blank(),
        axis_title_y=element_text(size=10, color=INK, margin={"r": 8}),
        axis_text=element_text(size=8, color=INK_SOFT),
        axis_text_x=element_blank(),
        axis_ticks_major_x=element_blank(),
        plot_title=element_text(size=title_fontsize, weight="bold", color=INK, margin={"b": 3}),
        plot_subtitle=element_text(size=8, color=INK_SOFT, margin={"b": 8}),
        plot_background=element_rect(fill=PAGE_BG, color="none"),
        panel_background=element_rect(fill=PAGE_BG, color="none"),
        panel_grid_major_x=element_blank(),
        panel_grid_minor_x=element_blank(),
        panel_grid_minor_y=element_blank(),
        panel_grid_major_y=element_line(color=INK, size=0.3, alpha=0.15),
        legend_title=element_text(size=9, weight="bold", color=INK),
        legend_text=element_text(size=8, color=INK_SOFT),
        legend_position="right",
        legend_background=element_rect(fill=ELEVATED_BG, color=INK_SOFT, size=0.3),
        legend_key=element_rect(fill="none", color="none"),
        plot_margin=0.02,
    )
)

plot.save(f"plot-{THEME}.png", dpi=400, width=8, height=4.5, units="in")
Runnable source as JSON, for any HTTP client: https://api.anyplot.ai/specs/dendrogram-basic/plotnine/code. Any spec id and library id listed in llms-full.txt fit the same URL shape; every URL below is complete and callable.
{
  "spec_id": "dendrogram-basic",
  "language": "python",
  "library": "plotnine",
  "page": "https://anyplot.ai/dendrogram-basic/python/plotnine",
  "hub": "https://anyplot.ai/dendrogram-basic",
  "code_json": "https://api.anyplot.ai/specs/dendrogram-basic/plotnine/code",
  "spec_json": "https://api.anyplot.ai/specs/dendrogram-basic",
  "render_light_png": "https://storage.googleapis.com/anyplot-images/plots/dendrogram-basic/python/plotnine/plot-light.png",
  "render_dark_png": "https://storage.googleapis.com/anyplot-images/plots/dendrogram-basic/python/plotnine/plot-dark.png",
  "quality_score": 90.0,
  "license": "MIT",
  "guide": "https://anyplot.ai/llms.txt"
}
Part of Basic Dendrogram on anyplot.ai.