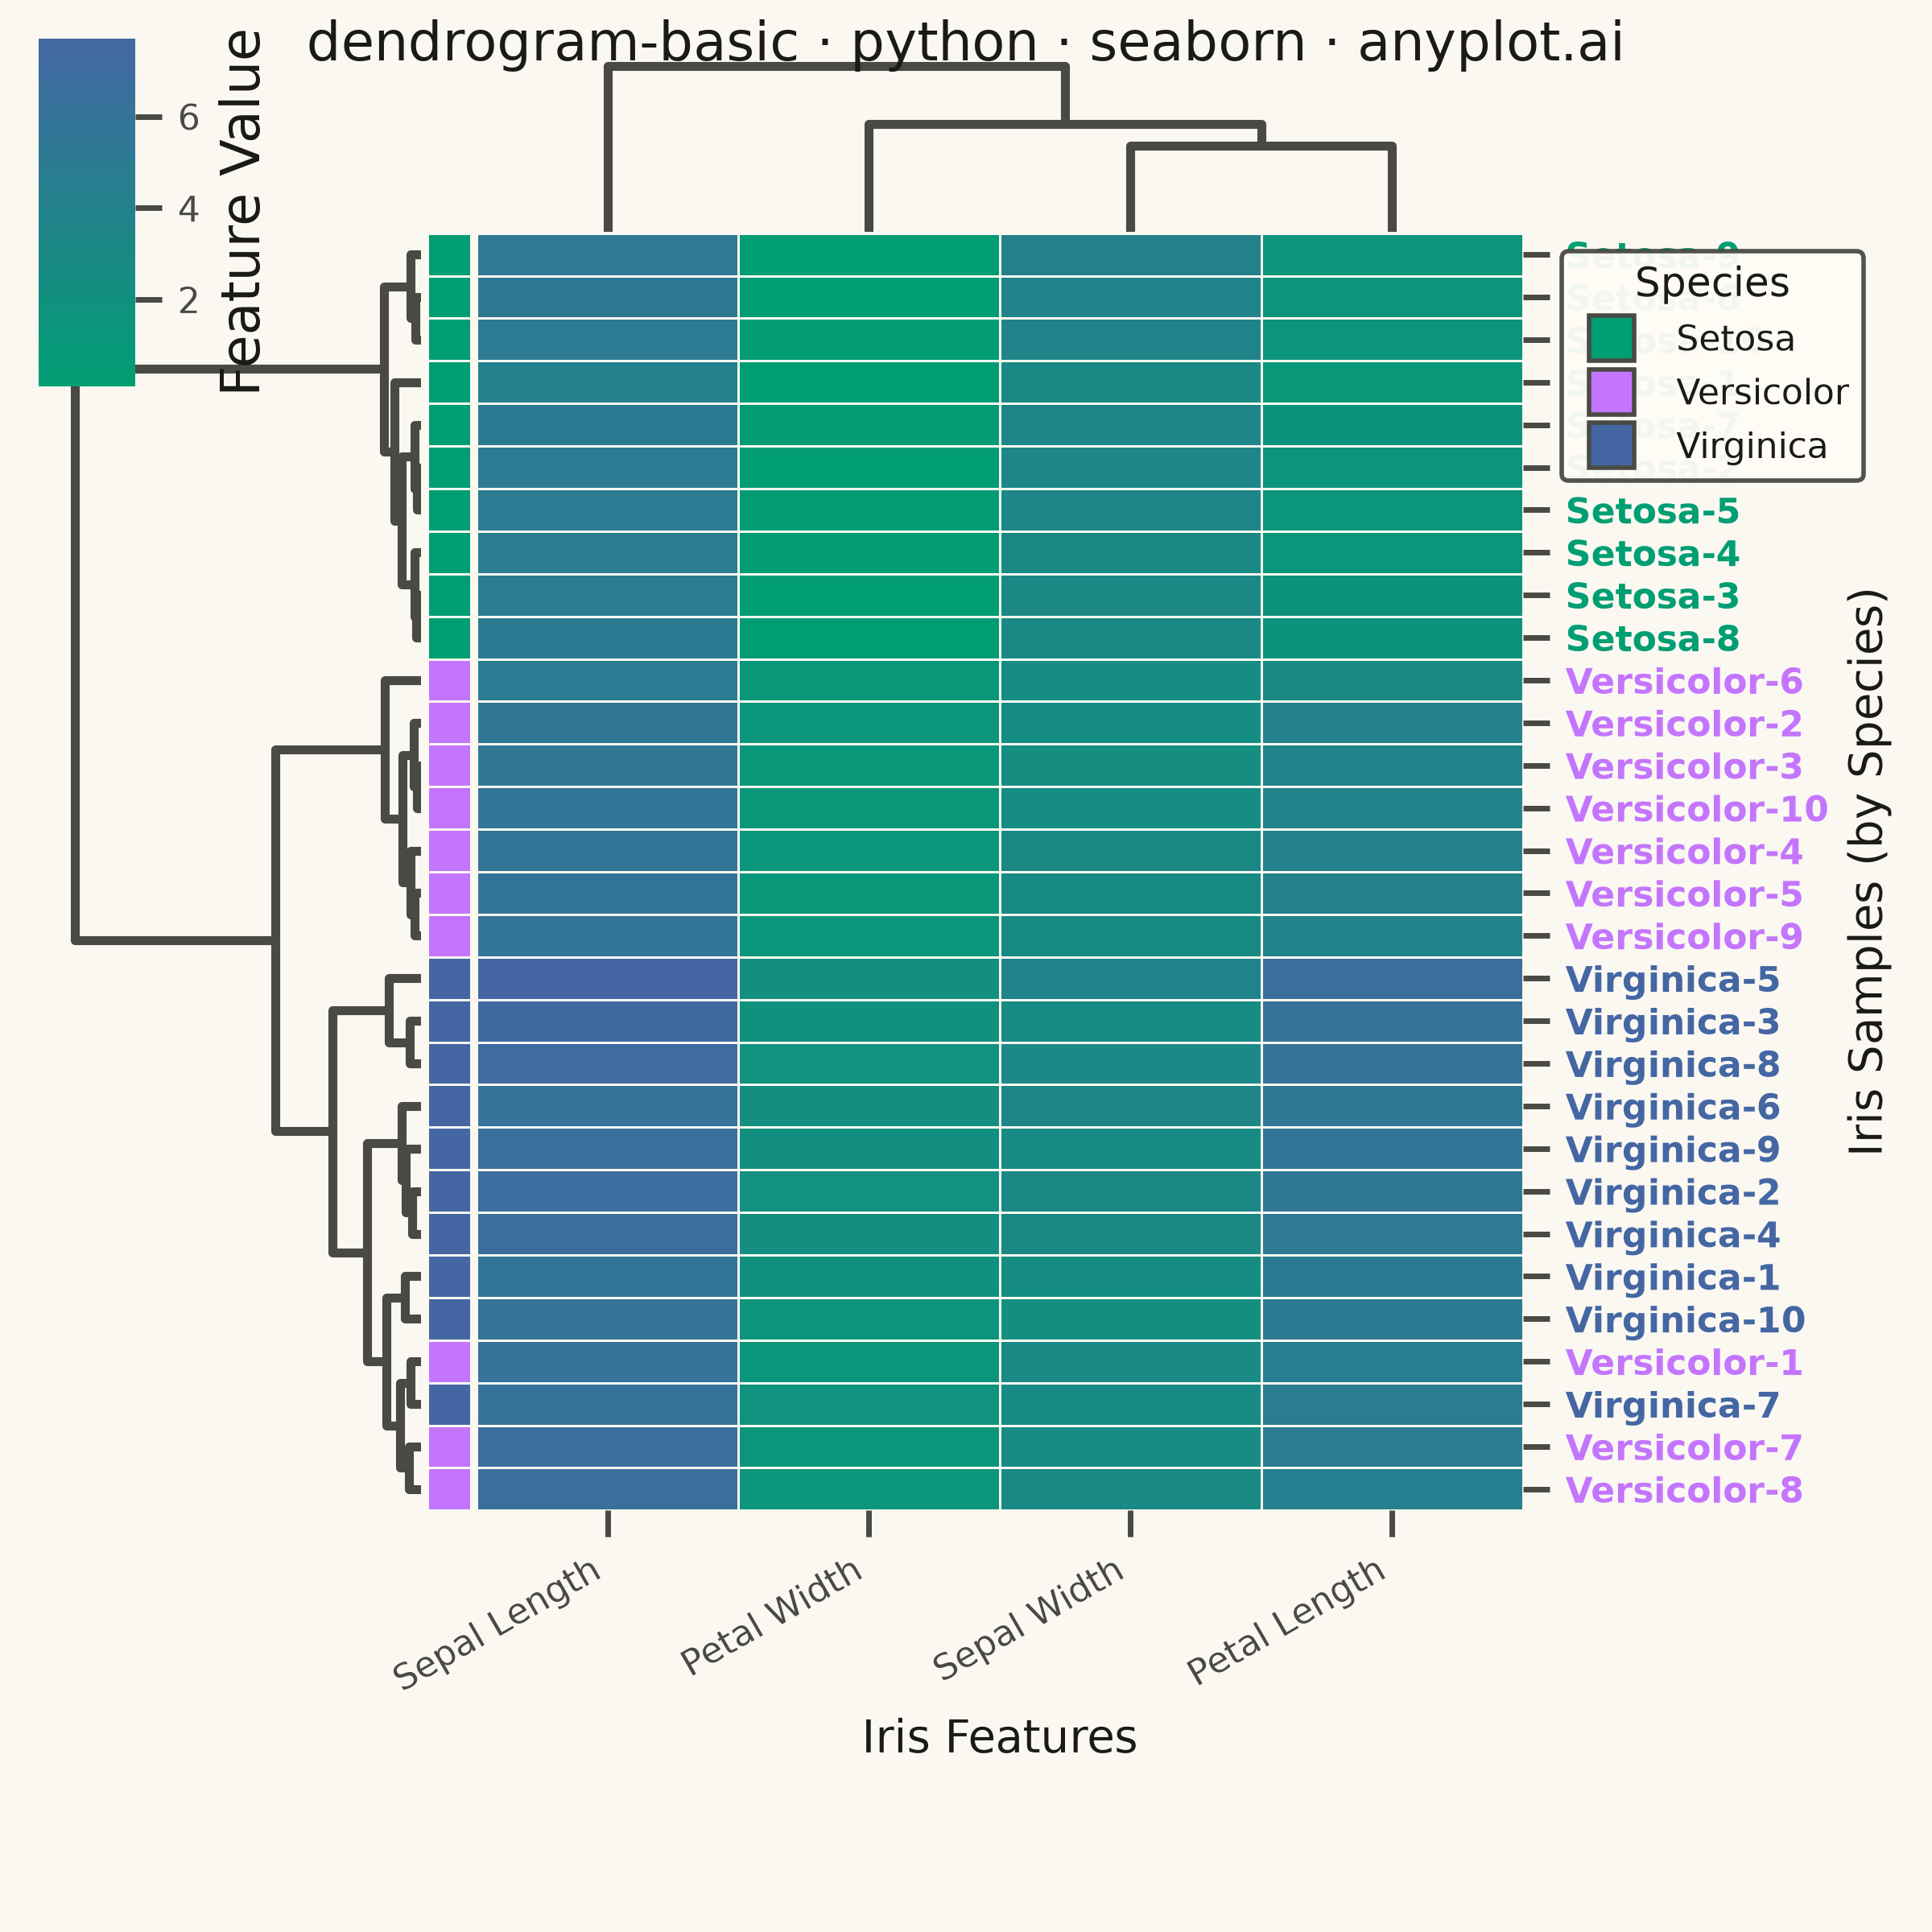
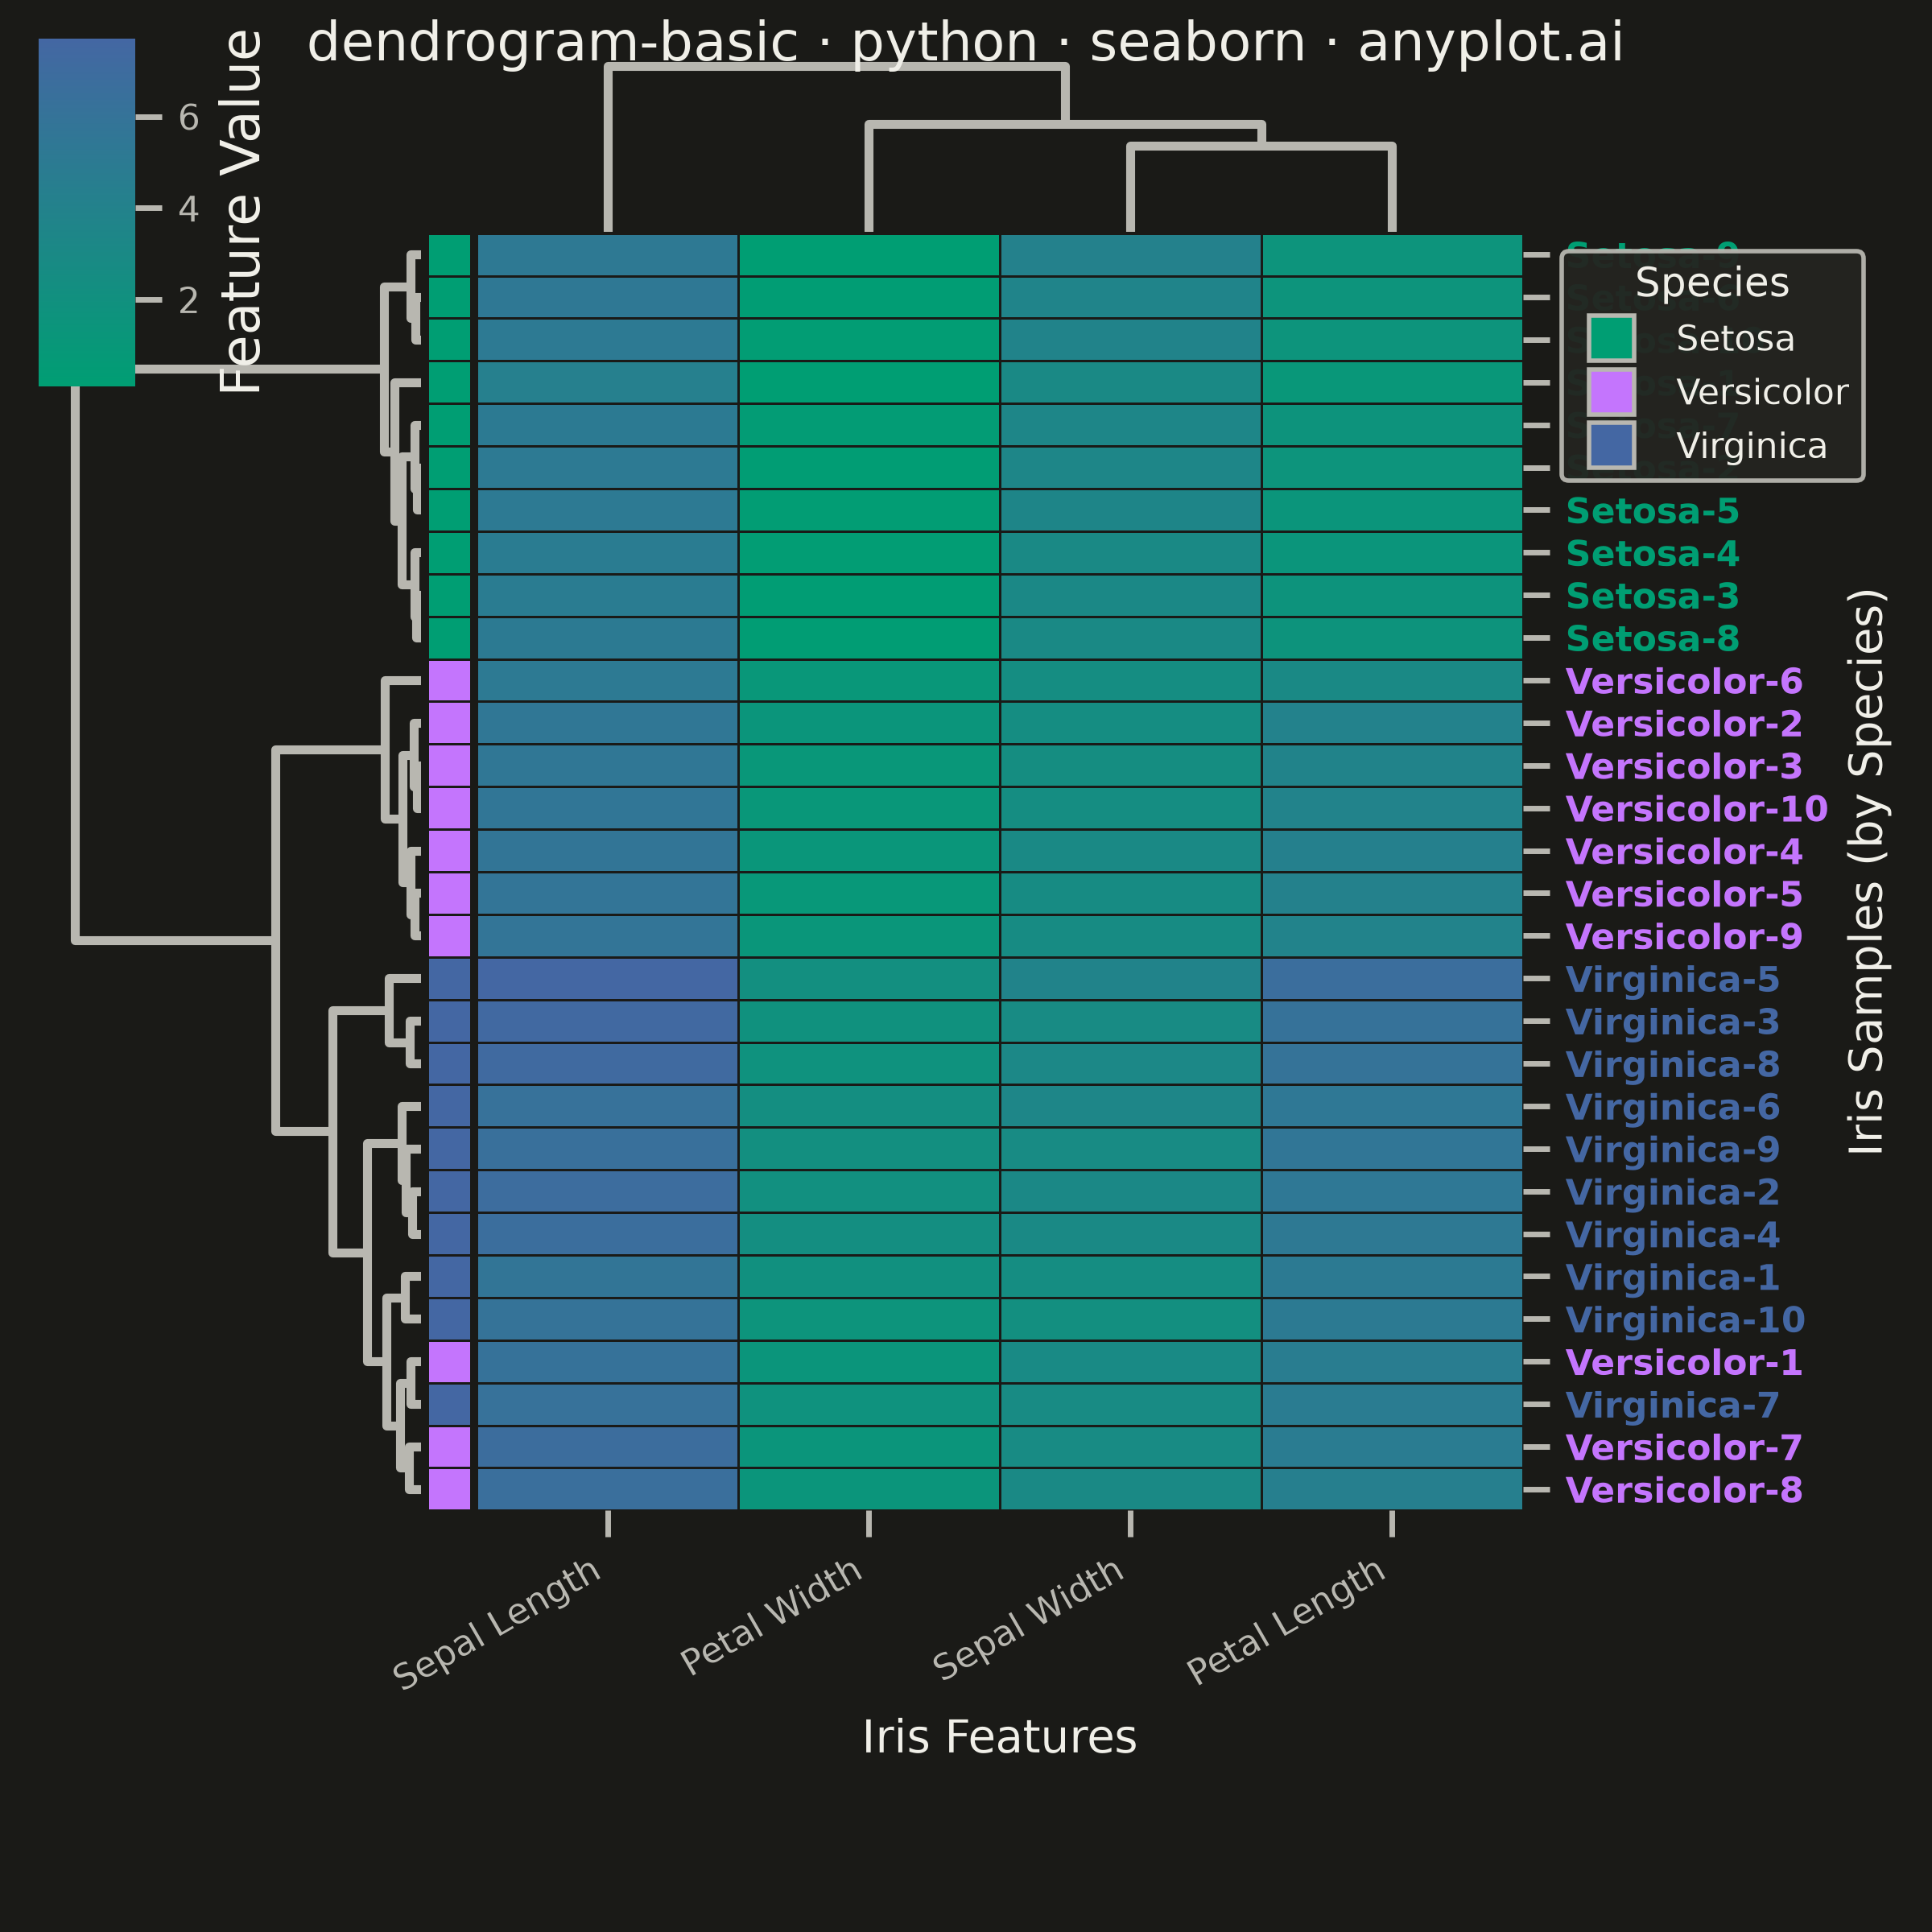
A dendrogram visualizes hierarchical clustering by showing how data points or clusters merge at different distance levels. The tree-like structure reveals relationships and similarity between items, with branch heights indicating the distance at which clusters merge. This visualization is essential for understanding the hierarchical structure in data and identifying natural groupings.
""" anyplot.ai
dendrogram-basic: Basic Dendrogram
Library: seaborn 0.13.2 | Python 3.13.14
Quality: 90/100 | Updated: 2026-06-18
"""

import os

import matplotlib.pyplot as plt
import numpy as np
import pandas as pd
import seaborn as sns
from matplotlib.colors import LinearSegmentedColormap


# Theme tokens (Imprint palette, theme-adaptive chrome)
THEME = os.getenv("ANYPLOT_THEME", "light")
PAGE_BG = "#FAF8F1" if THEME == "light" else "#1A1A17"
ELEVATED_BG = "#FFFDF6" if THEME == "light" else "#242420"
INK = "#1A1A17" if THEME == "light" else "#F0EFE8"
INK_SOFT = "#4A4A44" if THEME == "light" else "#B8B7B0"

# Imprint categorical palette — first series always #009E73
IMPRINT_PALETTE = ["#009E73", "#C475FD", "#4467A3", "#BD8233", "#AE3030", "#2ABCCD", "#954477", "#99B314"]

# Imprint sequential colormap for single-polarity heatmap values
imprint_seq = LinearSegmentedColormap.from_list("imprint_seq", ["#009E73", "#4467A3"])

# Species colors: Imprint positions 1-3
species_names = ["Setosa", "Versicolor", "Virginica"]
species_colors = dict(zip(species_names, IMPRINT_PALETTE[:3], strict=True))

# Apply theme-adaptive seaborn theme before any figure is created
sns.set_theme(
    style="ticks",
    rc={
        "figure.facecolor": PAGE_BG,
        "axes.facecolor": PAGE_BG,
        "axes.edgecolor": INK_SOFT,
        "axes.labelcolor": INK,
        "text.color": INK,
        "xtick.color": INK_SOFT,
        "ytick.color": INK_SOFT,
        "grid.color": INK,
        "grid.alpha": 0.15,
        "legend.facecolor": ELEVATED_BG,
        "legend.edgecolor": INK_SOFT,
    },
)

# Data — iris dataset, 10 samples per species (30 total for readable dendrogram)
np.random.seed(42)
iris = sns.load_dataset("iris")
samples = (
    iris.groupby("species").apply(lambda g: g.sample(10, random_state=42), include_groups=False).reset_index(level=0)
)

feature_cols = ["sepal_length", "sepal_width", "petal_length", "petal_width"]
features = samples[feature_cols].copy()

# Sample labels: Species-Number
counters = dict.fromkeys(["setosa", "versicolor", "virginica"], 0)
labels = []
species_list = []
for species in samples["species"]:
    counters[species] += 1
    labels.append(f"{species.title()}-{counters[species]}")
    species_list.append(species.title())

features.index = labels
features.columns = ["Sepal Length", "Sepal Width", "Petal Length", "Petal Width"]

# Row color strip by species (seaborn's distinctive clustermap feature)
row_colors = pd.Series([species_colors[sp] for sp in species_list], index=labels, name="Species")

# Plot — square canvas suits the symmetric clustermap grid layout
g = sns.clustermap(
    features,
    method="ward",
    row_colors=row_colors,
    col_cluster=True,
    cmap=imprint_seq,
    figsize=(6, 6),
    dendrogram_ratio=(0.25, 0.12),
    linewidths=0.5,
    linecolor=PAGE_BG,
    cbar_kws={"label": "Feature Value"},
    tree_kws={"linewidths": 2.0, "colors": INK_SOFT},
    xticklabels=True,
    yticklabels=True,
)

g.figure.set_facecolor(PAGE_BG)

# Axis labels and tick sizes
g.ax_heatmap.set_xlabel("Iris Features", fontsize=10, color=INK)
g.ax_heatmap.set_ylabel("Iris Samples (by Species)", fontsize=10, color=INK)
g.ax_heatmap.tick_params(axis="both", labelsize=8, colors=INK_SOFT)

# Color y-axis labels by species for visual storytelling
for lbl in g.ax_heatmap.get_yticklabels():
    species = lbl.get_text().rsplit("-", 1)[0]
    if species in species_colors:
        lbl.set_color(species_colors[species])
        lbl.set_fontweight("bold")

# Style x-axis (feature) labels
for lbl in g.ax_heatmap.get_xticklabels():
    lbl.set_fontsize(8)
    lbl.set_color(INK_SOFT)
    lbl.set_rotation(30)
    lbl.set_ha("right")

# Remove the 'Species' column label from the row colors strip x-axis
g.ax_row_colors.tick_params(bottom=False, labelbottom=False)

# Style colorbar ticks
g.cax.tick_params(labelsize=8, colors=INK_SOFT)
g.cax.set_facecolor(PAGE_BG)

# Species legend — placed outside the heatmap to the right to avoid data overlap
legend_handles = [
    plt.Line2D([0], [0], marker="s", color="none", markerfacecolor=c, markeredgecolor=INK_SOFT, markersize=10, label=n)
    for n, c in species_colors.items()
]
g.ax_heatmap.legend(
    handles=legend_handles,
    title="Species",
    loc="upper left",
    bbox_to_anchor=(1.02, 1.0),
    fontsize=8,
    title_fontsize=9,
    framealpha=0.95,
    facecolor=ELEVATED_BG,
    edgecolor=INK_SOFT,
)

# Title
title = "dendrogram-basic · python · seaborn · anyplot.ai"
g.figure.suptitle(title, fontsize=12, fontweight="medium", color=INK, y=0.99)

# Save — square canvas: figsize=(6,6) × dpi=400 → 2400×2400 px (no bbox_inches)
g.figure.savefig(f"plot-{THEME}.png", dpi=400, facecolor=PAGE_BG)
Runnable source as JSON, for any HTTP client: https://api.anyplot.ai/specs/dendrogram-basic/seaborn/code. Any spec id and library id listed in llms-full.txt fit the same URL shape; every URL below is complete and callable.
{
  "spec_id": "dendrogram-basic",
  "language": "python",
  "library": "seaborn",
  "page": "https://anyplot.ai/dendrogram-basic/python/seaborn",
  "hub": "https://anyplot.ai/dendrogram-basic",
  "code_json": "https://api.anyplot.ai/specs/dendrogram-basic/seaborn/code",
  "spec_json": "https://api.anyplot.ai/specs/dendrogram-basic",
  "render_light_png": "https://storage.googleapis.com/anyplot-images/plots/dendrogram-basic/python/seaborn/plot-light.png",
  "render_dark_png": "https://storage.googleapis.com/anyplot-images/plots/dendrogram-basic/python/seaborn/plot-dark.png",
  "quality_score": 90.0,
  "license": "MIT",
  "guide": "https://anyplot.ai/llms.txt"
}
Part of Basic Dendrogram on anyplot.ai.