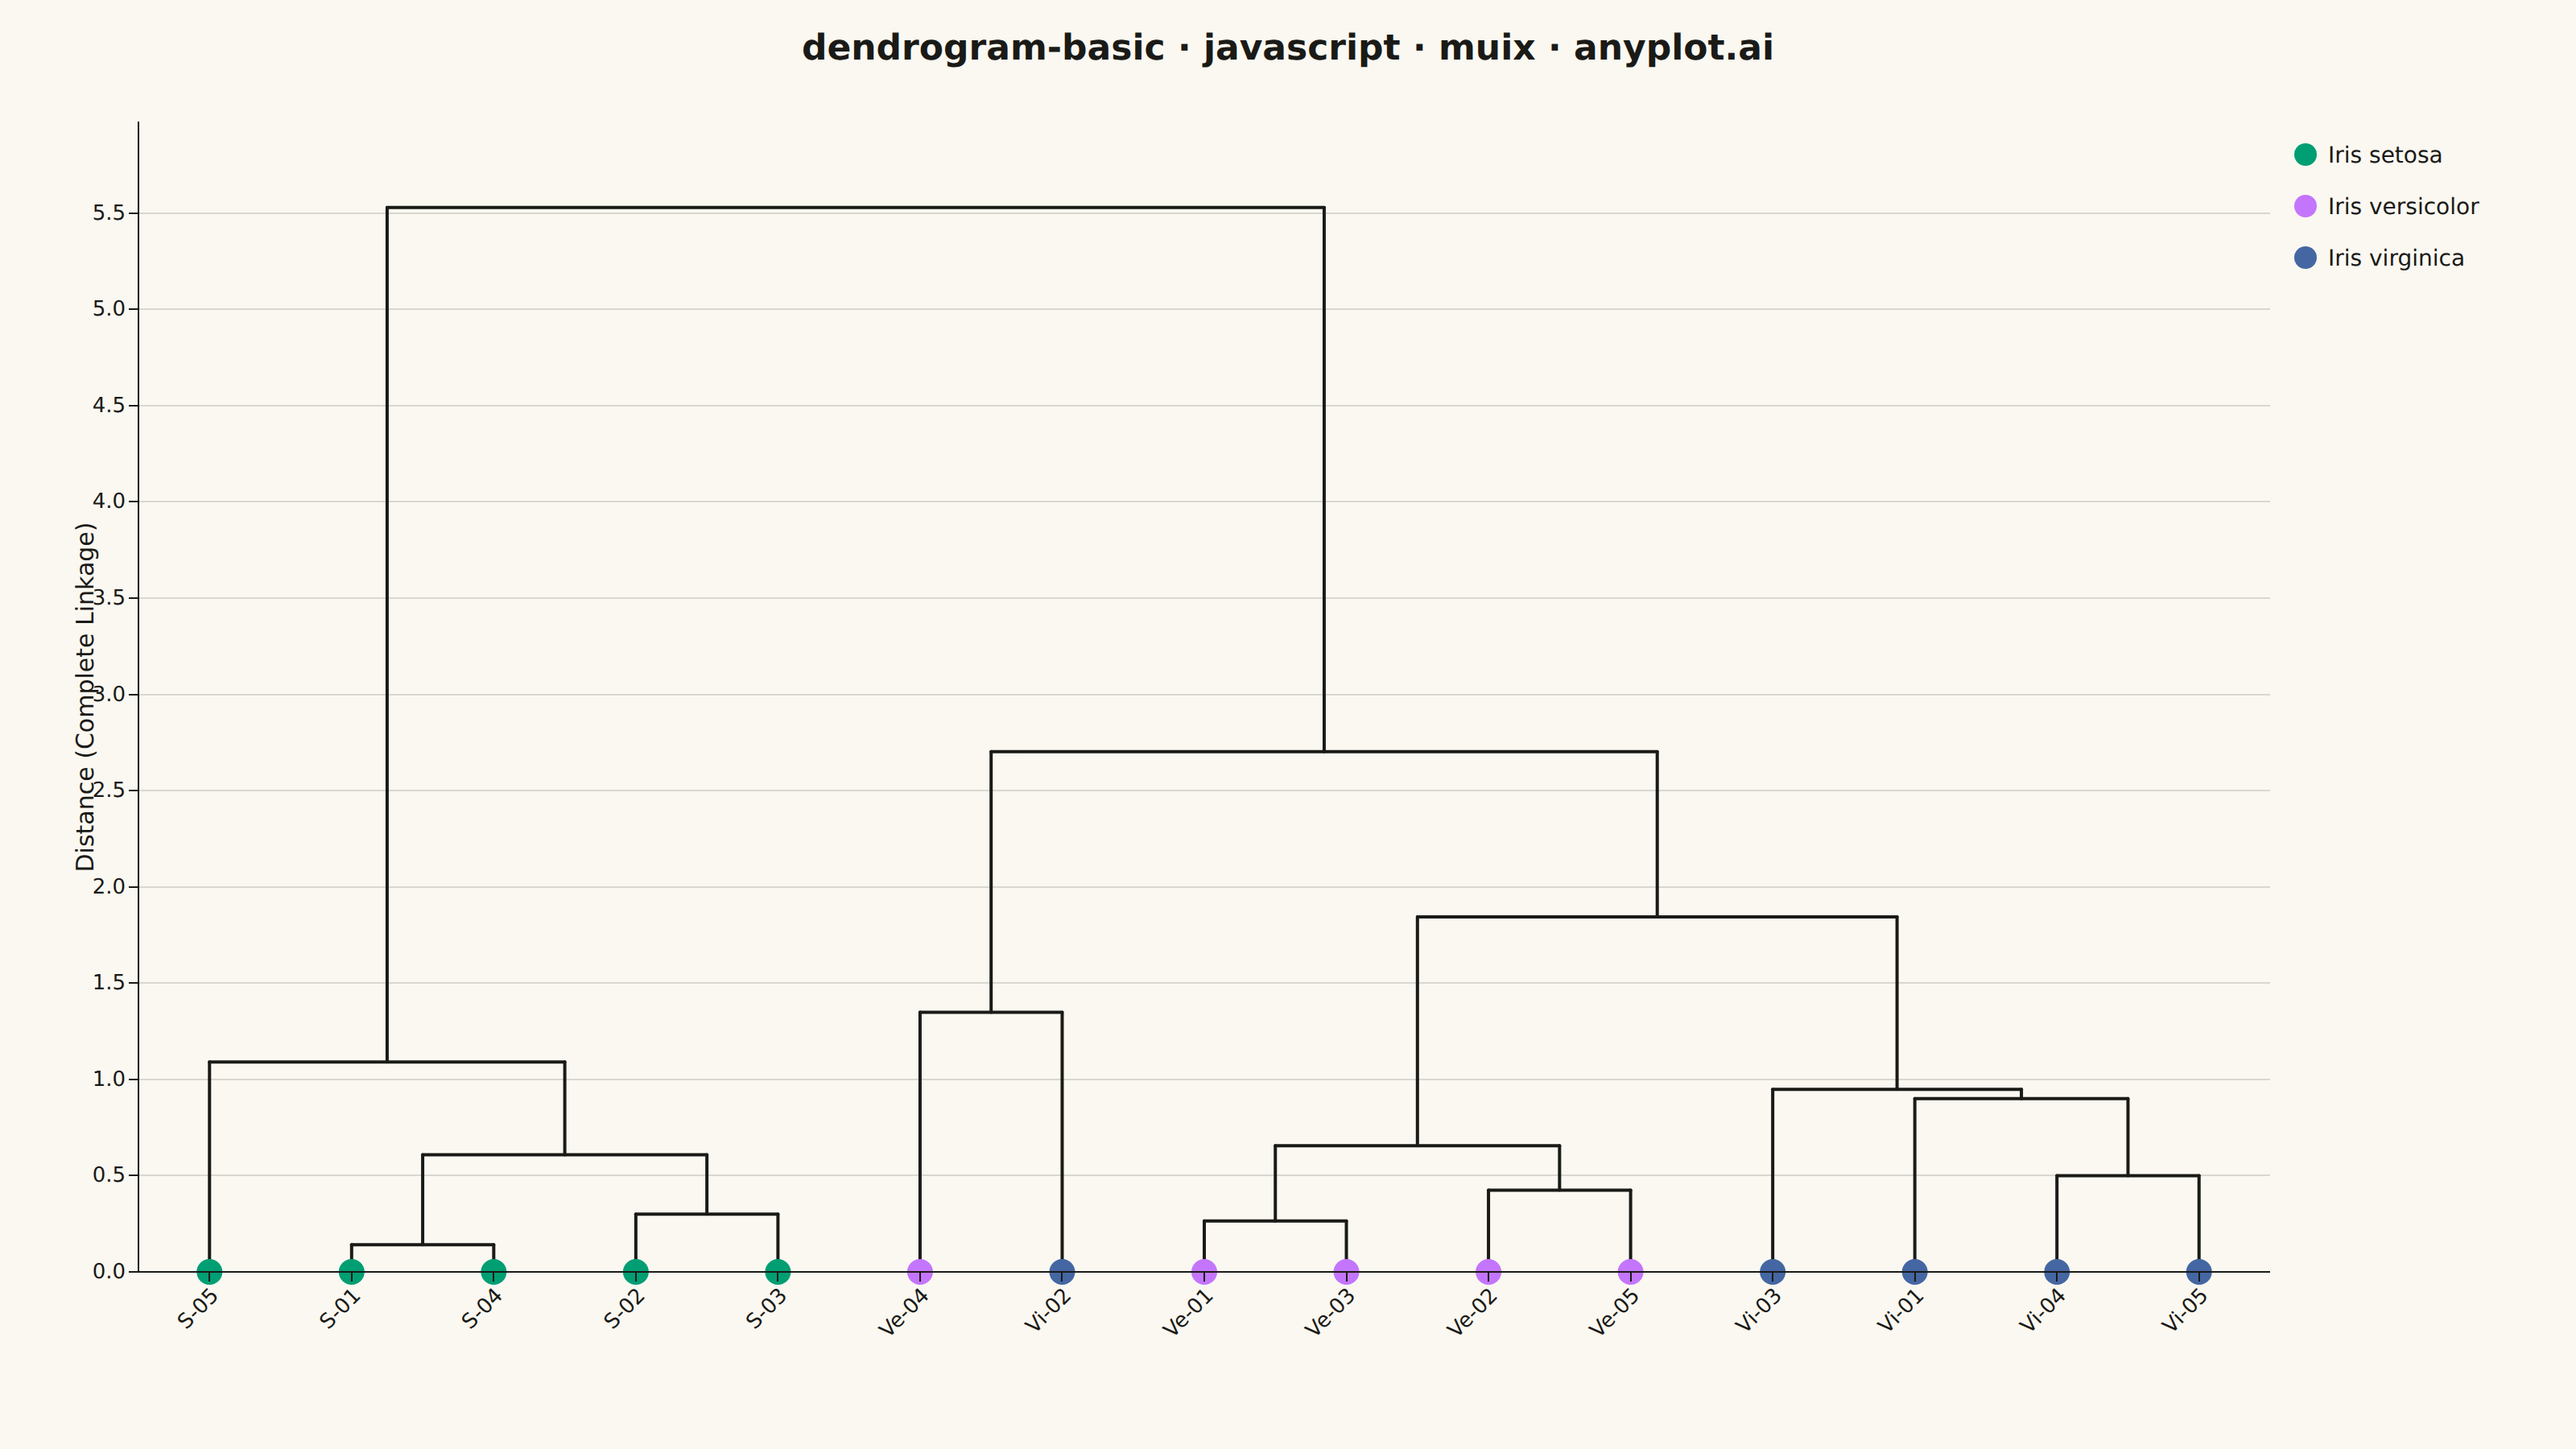
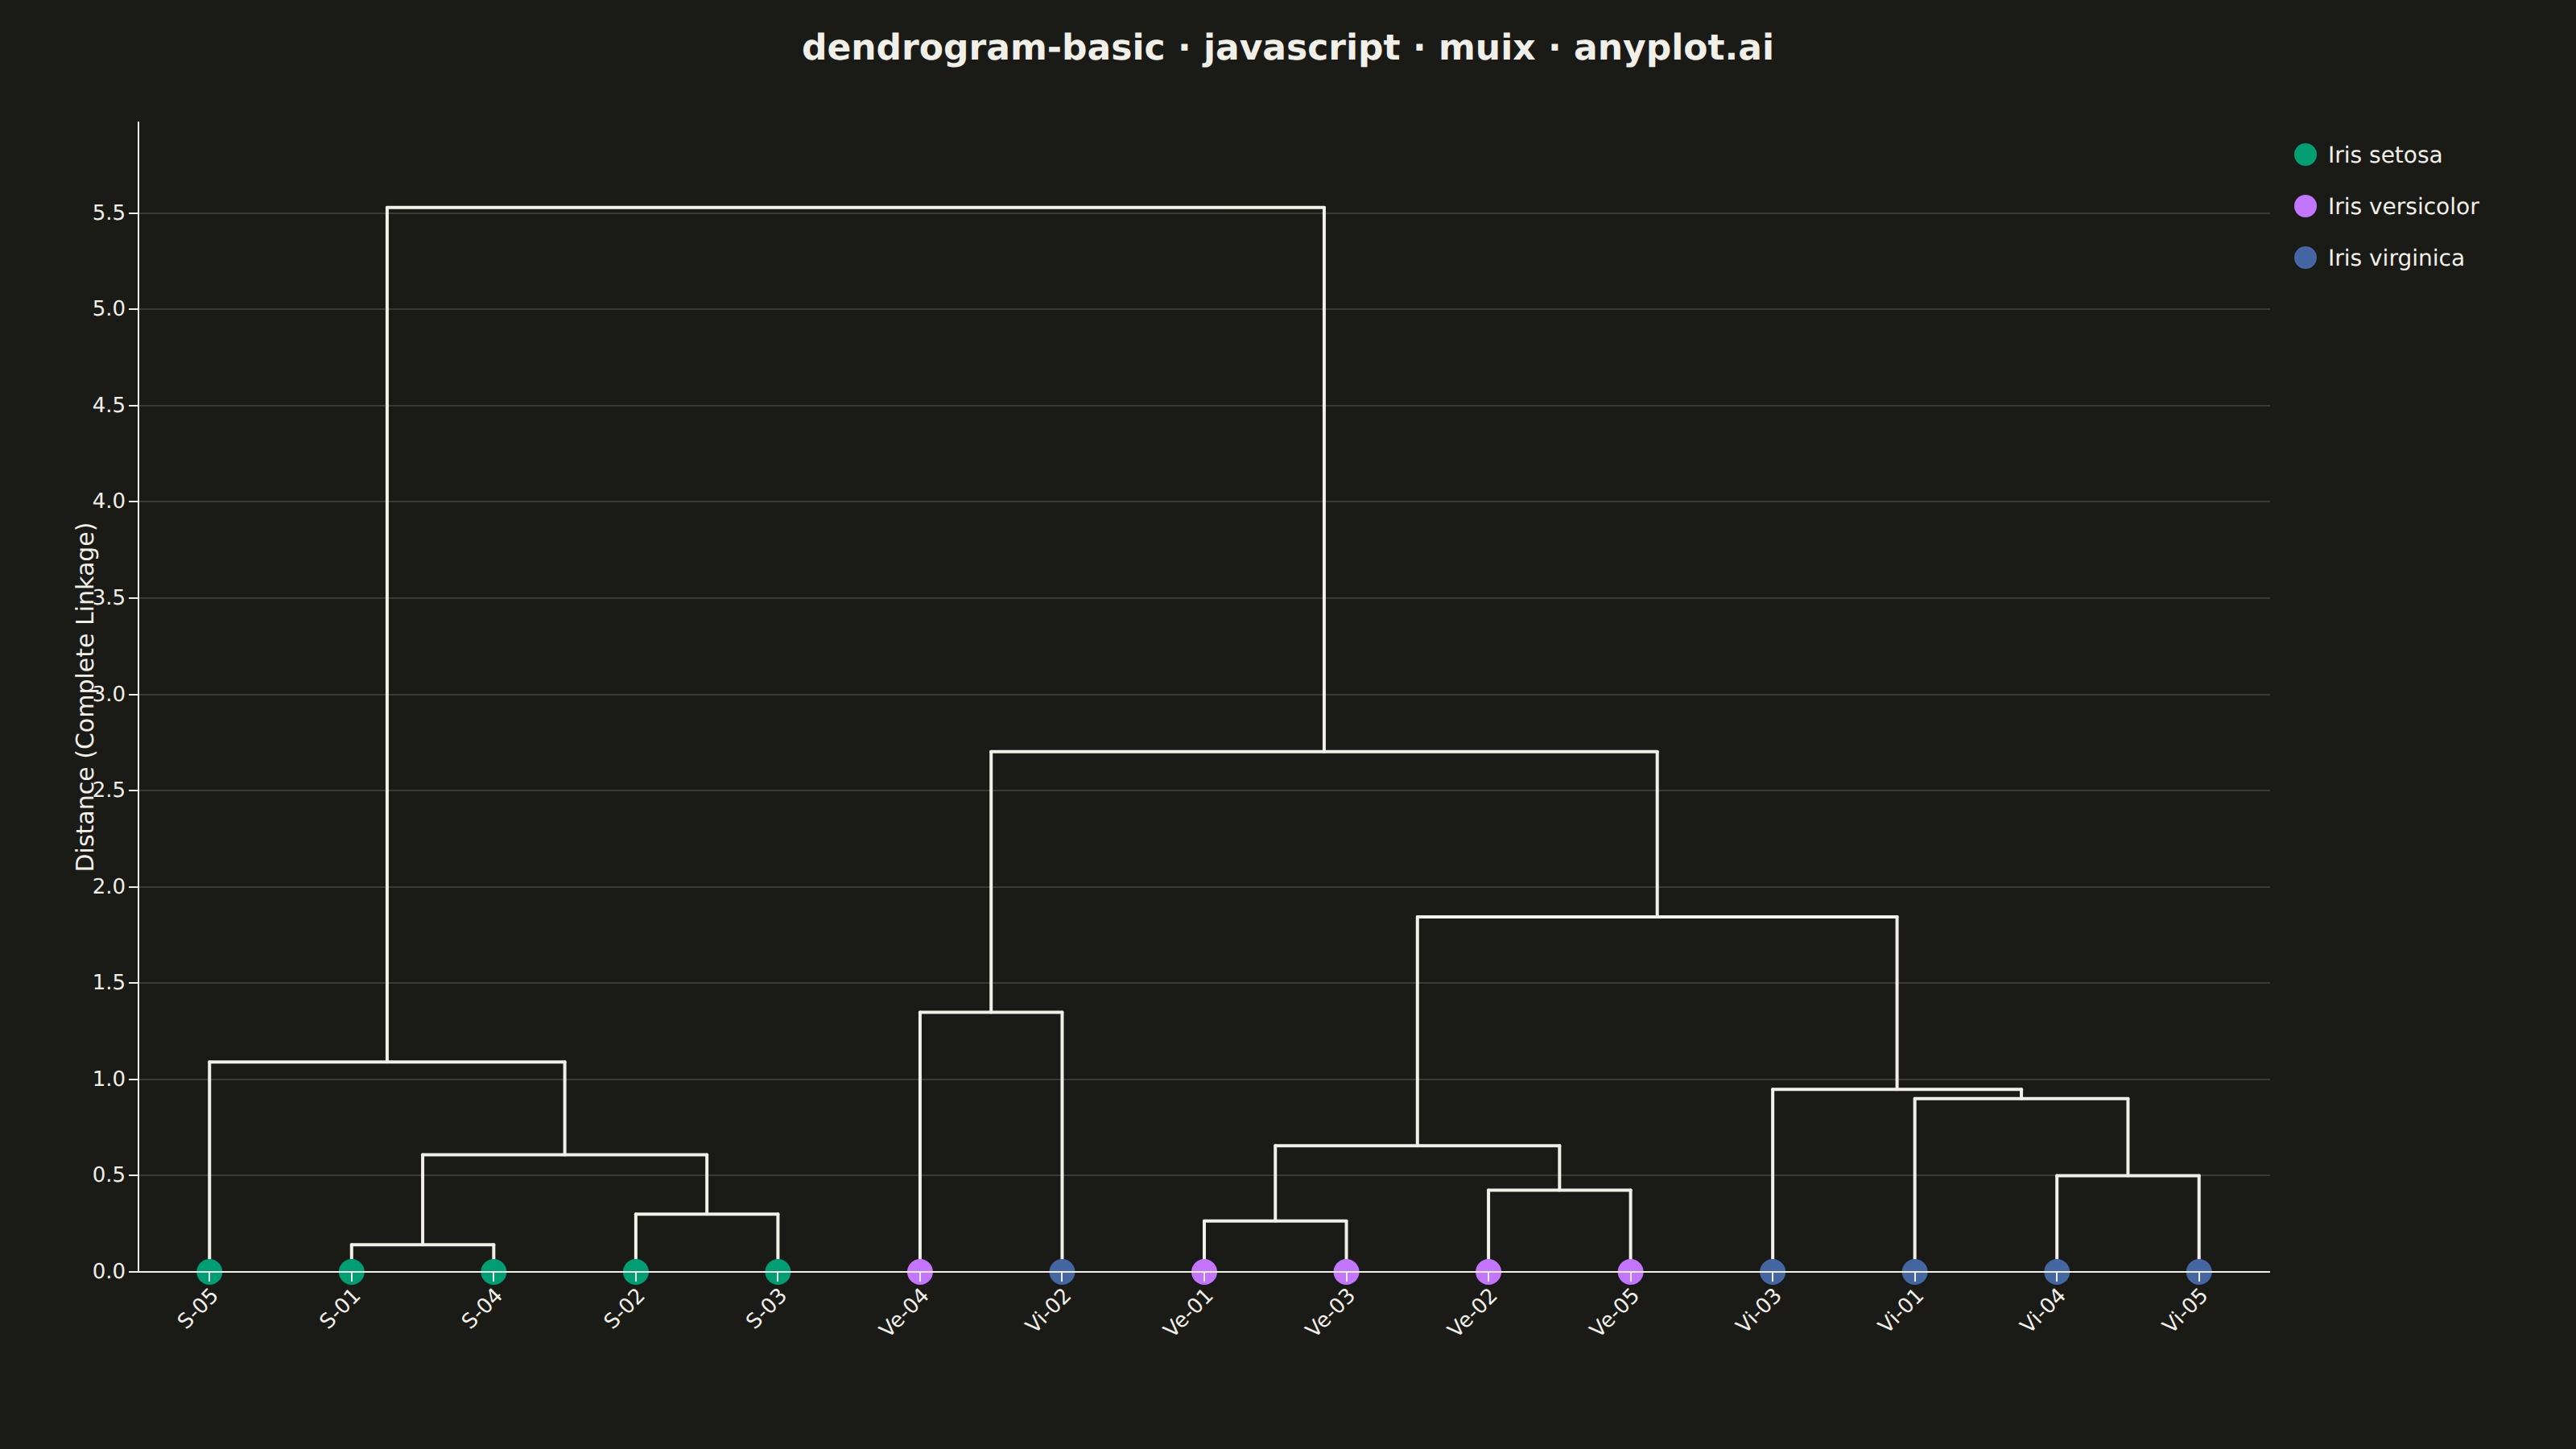
A dendrogram visualizes hierarchical clustering by showing how data points or clusters merge at different distance levels. The tree-like structure reveals relationships and similarity between items, with branch heights indicating the distance at which clusters merge. This visualization is essential for understanding the hierarchical structure in data and identifying natural groupings.
// anyplot.ai
// dendrogram-basic: Basic Dendrogram
// Library: muix 7.29.1 | JavaScript 22.22.3
// Quality: 90/100 | Created: 2026-06-18

import { ChartContainer } from "@mui/x-charts/ChartContainer";
import { ScatterPlot } from "@mui/x-charts/ScatterChart";
import { ChartsXAxis } from "@mui/x-charts/ChartsXAxis";
import { ChartsYAxis } from "@mui/x-charts/ChartsYAxis";
import { ChartsGrid } from "@mui/x-charts/ChartsGrid";
import { useXScale, useYScale, useDrawingArea } from "@mui/x-charts/hooks";

const t = window.ANYPLOT_TOKENS;
const FONT = "Inter, system-ui, -apple-system, sans-serif";

// Iris samples: sepal_length, sepal_width, petal_length, petal_width
const samples = [
  { label: "S-01", features: [5.1, 3.5, 1.4, 0.2], species: 0 },
  { label: "S-02", features: [4.9, 3.0, 1.4, 0.2], species: 0 },
  { label: "S-03", features: [4.7, 3.2, 1.3, 0.2], species: 0 },
  { label: "S-04", features: [5.0, 3.6, 1.4, 0.2], species: 0 },
  { label: "S-05", features: [5.4, 3.9, 1.7, 0.4], species: 0 },
  { label: "Ve-01", features: [7.0, 3.2, 4.7, 1.4], species: 1 },
  { label: "Ve-02", features: [6.4, 3.2, 4.5, 1.5], species: 1 },
  { label: "Ve-03", features: [6.9, 3.1, 4.9, 1.5], species: 1 },
  { label: "Ve-04", features: [5.5, 2.3, 4.0, 1.3], species: 1 },
  { label: "Ve-05", features: [6.5, 2.8, 4.6, 1.5], species: 1 },
  { label: "Vi-01", features: [6.3, 3.3, 6.0, 2.5], species: 2 },
  { label: "Vi-02", features: [5.8, 2.7, 5.1, 1.9], species: 2 },
  { label: "Vi-03", features: [7.1, 3.0, 5.9, 2.1], species: 2 },
  { label: "Vi-04", features: [6.3, 2.9, 5.6, 1.8], species: 2 },
  { label: "Vi-05", features: [6.5, 3.0, 5.8, 2.2], species: 2 },
];

const SPECIES_NAMES = ["Iris setosa", "Iris versicolor", "Iris virginica"];

function euclid(a, b) {
  return Math.sqrt(a.features.reduce((s, v, i) => s + (v - b.features[i]) ** 2, 0));
}

function buildTree(pts) {
  let nodes = pts.map((_, i) => ({ height: 0, leaves: [i], children: null, x: 0 }));
  while (nodes.length > 1) {
    let minD = Infinity, mi = 0, mj = 1;
    for (let i = 0; i < nodes.length; i++) {
      for (let j = i + 1; j < nodes.length; j++) {
        let d = 0;
        for (const li of nodes[i].leaves)
          for (const lj of nodes[j].leaves)
            d = Math.max(d, euclid(pts[li], pts[lj]));
        if (d < minD) { minD = d; mi = i; mj = j; }
      }
    }
    const merged = {
      height: minD,
      leaves: [...nodes[mi].leaves, ...nodes[mj].leaves],
      children: [nodes[mi], nodes[mj]],
      x: 0,
    };
    nodes.splice(mj, 1);
    nodes.splice(mi, 1);
    nodes.push(merged);
  }
  return nodes[0];
}

function leafOrder(node) {
  if (!node.children) return [node.leaves[0]];
  return [...leafOrder(node.children[0]), ...leafOrder(node.children[1])];
}

function assignX(node, xMap) {
  if (!node.children) { node.x = xMap[node.leaves[0]]; return; }
  assignX(node.children[0], xMap);
  assignX(node.children[1], xMap);
  node.x = (node.children[0].x + node.children[1].x) / 2;
}

function getSegments(node) {
  if (!node.children) return [];
  const [l, r] = node.children;
  return [
    { x1: l.x, y1: node.height, x2: r.x, y2: node.height },
    { x1: l.x, y1: l.height,    x2: l.x, y2: node.height },
    { x1: r.x, y1: r.height,    x2: r.x, y2: node.height },
    ...getSegments(l),
    ...getSegments(r),
  ];
}

const root = buildTree(samples);
const n = samples.length;
const order = leafOrder(root);
const xMap = {};
order.forEach((li, pos) => { xMap[li] = pos; });
assignX(root, xMap);
const maxH = root.height;
const segs = getSegments(root);

const X_MIN = -0.5;
const X_MAX = n - 0.5;
const Y_MAX = maxH * 1.08;
const orderedLabels = order.map((li) => samples[li].label);

// Three scatter series — one per species — for species-coloured leaf dots
const scatterSeries = [0, 1, 2].map((sp) => ({
  type: "scatter",
  data: order
    .map((li, pos) => samples[li].species === sp ? { id: `sp${sp}-${pos}`, x: pos, y: 0 } : null)
    .filter(Boolean),
  label: SPECIES_NAMES[sp],
  color: t.palette[sp],
  markerSize: 8,
}));

const TITLE_H = 60;

// Dendrogram branch lines — drawn on the MUI X coordinate system
function DendrogramBranches() {
  const xs = useXScale();
  const ys = useYScale();
  if (!xs || !ys) return null;
  return (
    <g>
      {segs.map((s, i) => (
        <line
          key={i}
          x1={xs(s.x1)} y1={ys(s.y1)}
          x2={xs(s.x2)} y2={ys(s.y2)}
          stroke={t.ink}
          strokeWidth={2}
          strokeLinecap="round"
        />
      ))}
    </g>
  );
}

// Species legend anchored to the right of the drawing area
function Legend() {
  const { left, top, width } = useDrawingArea();
  const lx = left + width + 14;
  return (
    <g fontFamily={FONT}>
      {SPECIES_NAMES.map((name, i) => (
        <g key={i} transform={`translate(${lx}, ${top + 20 + i * 32})`}>
          <circle cx={8} cy={0} r={7} fill={t.palette[i]} />
          <text x={22} y={5} fontSize={14} fill={t.ink}>{name}</text>
        </g>
      ))}
    </g>
  );
}

export default function Chart() {
  const W = window.ANYPLOT_SIZE.width;
  const H = window.ANYPLOT_SIZE.height;
  return (
    <div style={{
      width: W, height: H, background: t.pageBg,
      fontFamily: FONT, display: "flex", flexDirection: "column",
    }}>
      <div style={{ height: TITLE_H, display: "flex", alignItems: "center", justifyContent: "center" }}>
        <span style={{ fontSize: 22, fontWeight: 600, color: t.ink }}>
          dendrogram-basic · javascript · muix · anyplot.ai
        </span>
      </div>
      <ChartContainer
        width={W}
        height={H - TITLE_H}
        skipAnimation
        series={scatterSeries}
        margin={{ top: 16, right: 190, bottom: 110, left: 86 }}
        xAxis={[{
          min: X_MIN,
          max: X_MAX,
          tickInterval: Array.from({ length: n }, (_, i) => i),
          valueFormatter: (v) => orderedLabels[Math.round(v)] ?? "",
          tickLabelStyle: { angle: -45, textAnchor: "end", fontSize: 13, fontFamily: FONT },
        }]}
        yAxis={[{
          min: 0,
          max: Y_MAX,
          label: "Distance (Complete Linkage)",
          tickLabelStyle: { fontSize: 13, fontFamily: FONT },
          labelStyle: { fontSize: 15, fontFamily: FONT },
        }]}
        sx={{
          "& .MuiChartsAxis-line": { stroke: t.inkSoft },
          "& .MuiChartsAxis-tick": { stroke: t.inkSoft },
          "& .MuiChartsLegend-root": { display: "none" },
        }}
      >
        <ChartsGrid horizontal />
        <DendrogramBranches />
        <ScatterPlot />
        <ChartsXAxis />
        <ChartsYAxis />
        <Legend />
      </ChartContainer>
    </div>
  );
}
Runnable source as JSON, for any HTTP client: https://api.anyplot.ai/specs/dendrogram-basic/muix/code. Any spec id and library id listed in llms-full.txt fit the same URL shape; every URL below is complete and callable.
{
  "spec_id": "dendrogram-basic",
  "language": "javascript",
  "library": "muix",
  "page": "https://anyplot.ai/dendrogram-basic/javascript/muix",
  "hub": "https://anyplot.ai/dendrogram-basic",
  "code_json": "https://api.anyplot.ai/specs/dendrogram-basic/muix/code",
  "spec_json": "https://api.anyplot.ai/specs/dendrogram-basic",
  "render_light_png": "https://storage.googleapis.com/anyplot-images/plots/dendrogram-basic/javascript/muix/plot-light.png",
  "render_dark_png": "https://storage.googleapis.com/anyplot-images/plots/dendrogram-basic/javascript/muix/plot-dark.png",
  "interactive_light_html": "https://storage.googleapis.com/anyplot-images/plots/dendrogram-basic/javascript/muix/plot-light.html",
  "interactive_dark_html": "https://storage.googleapis.com/anyplot-images/plots/dendrogram-basic/javascript/muix/plot-dark.html",
  "quality_score": 90.0,
  "license": "MIT",
  "guide": "https://anyplot.ai/llms.txt"
}
Part of Basic Dendrogram on anyplot.ai.