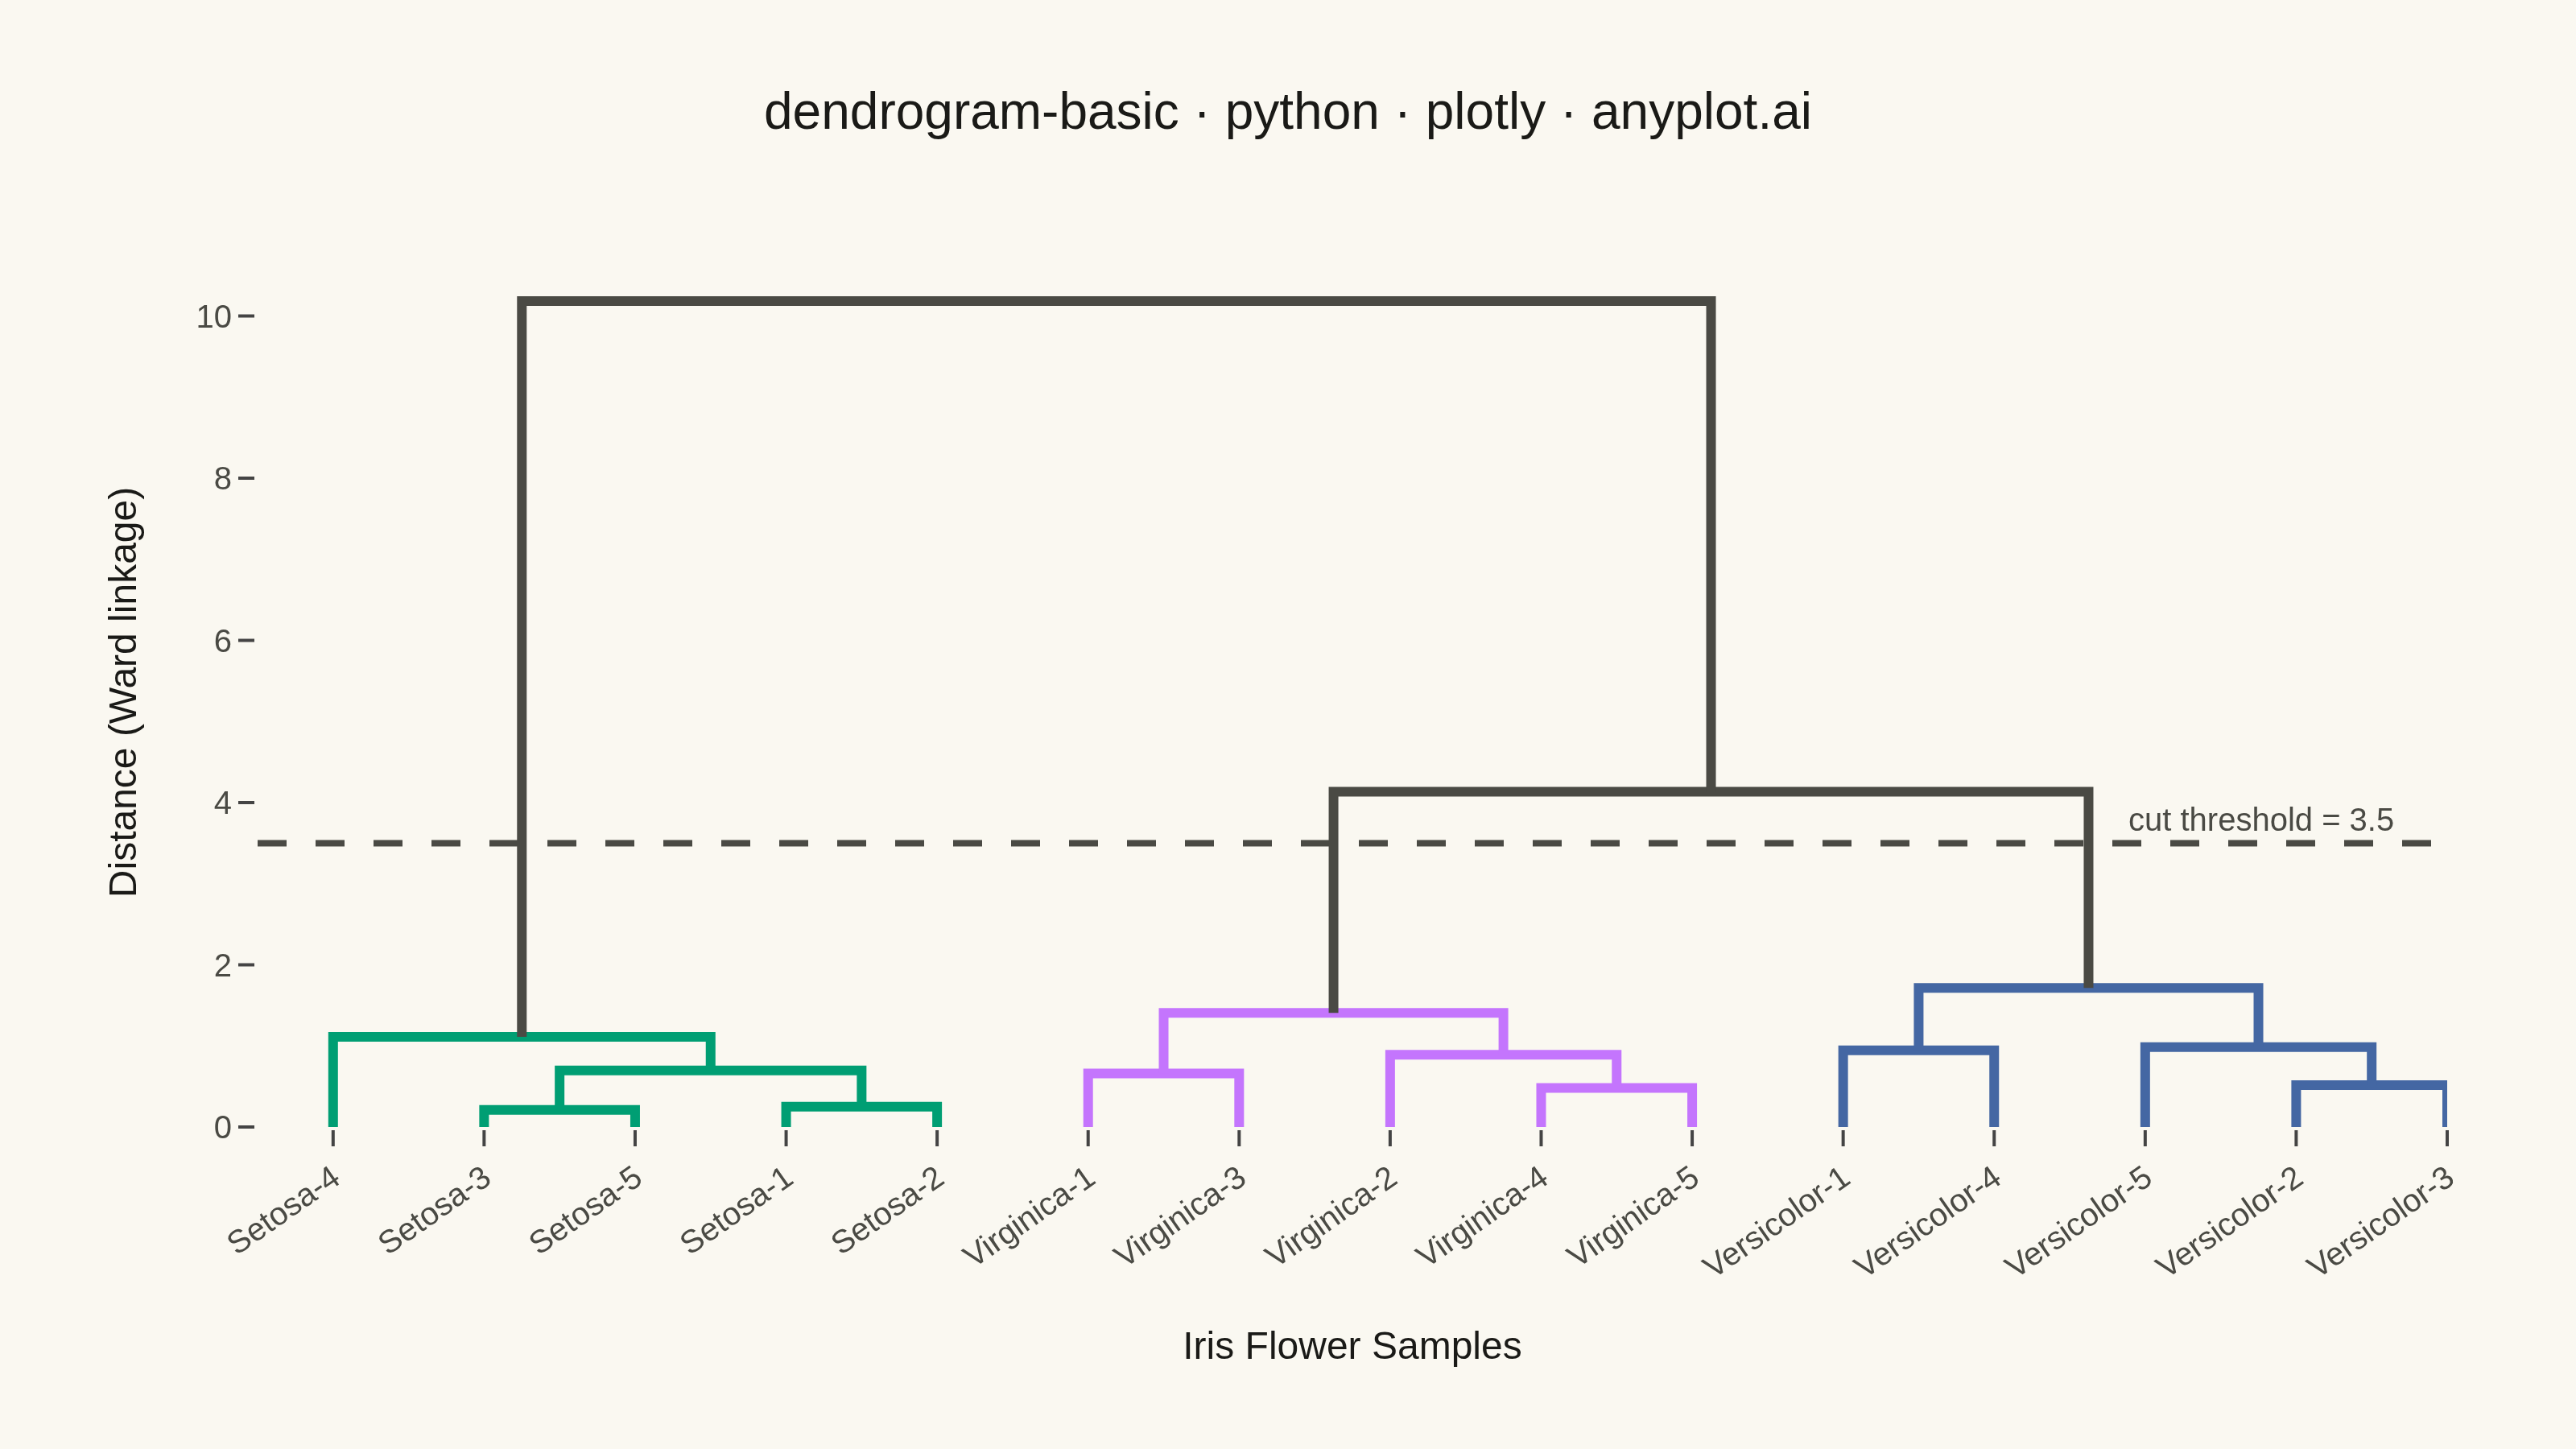
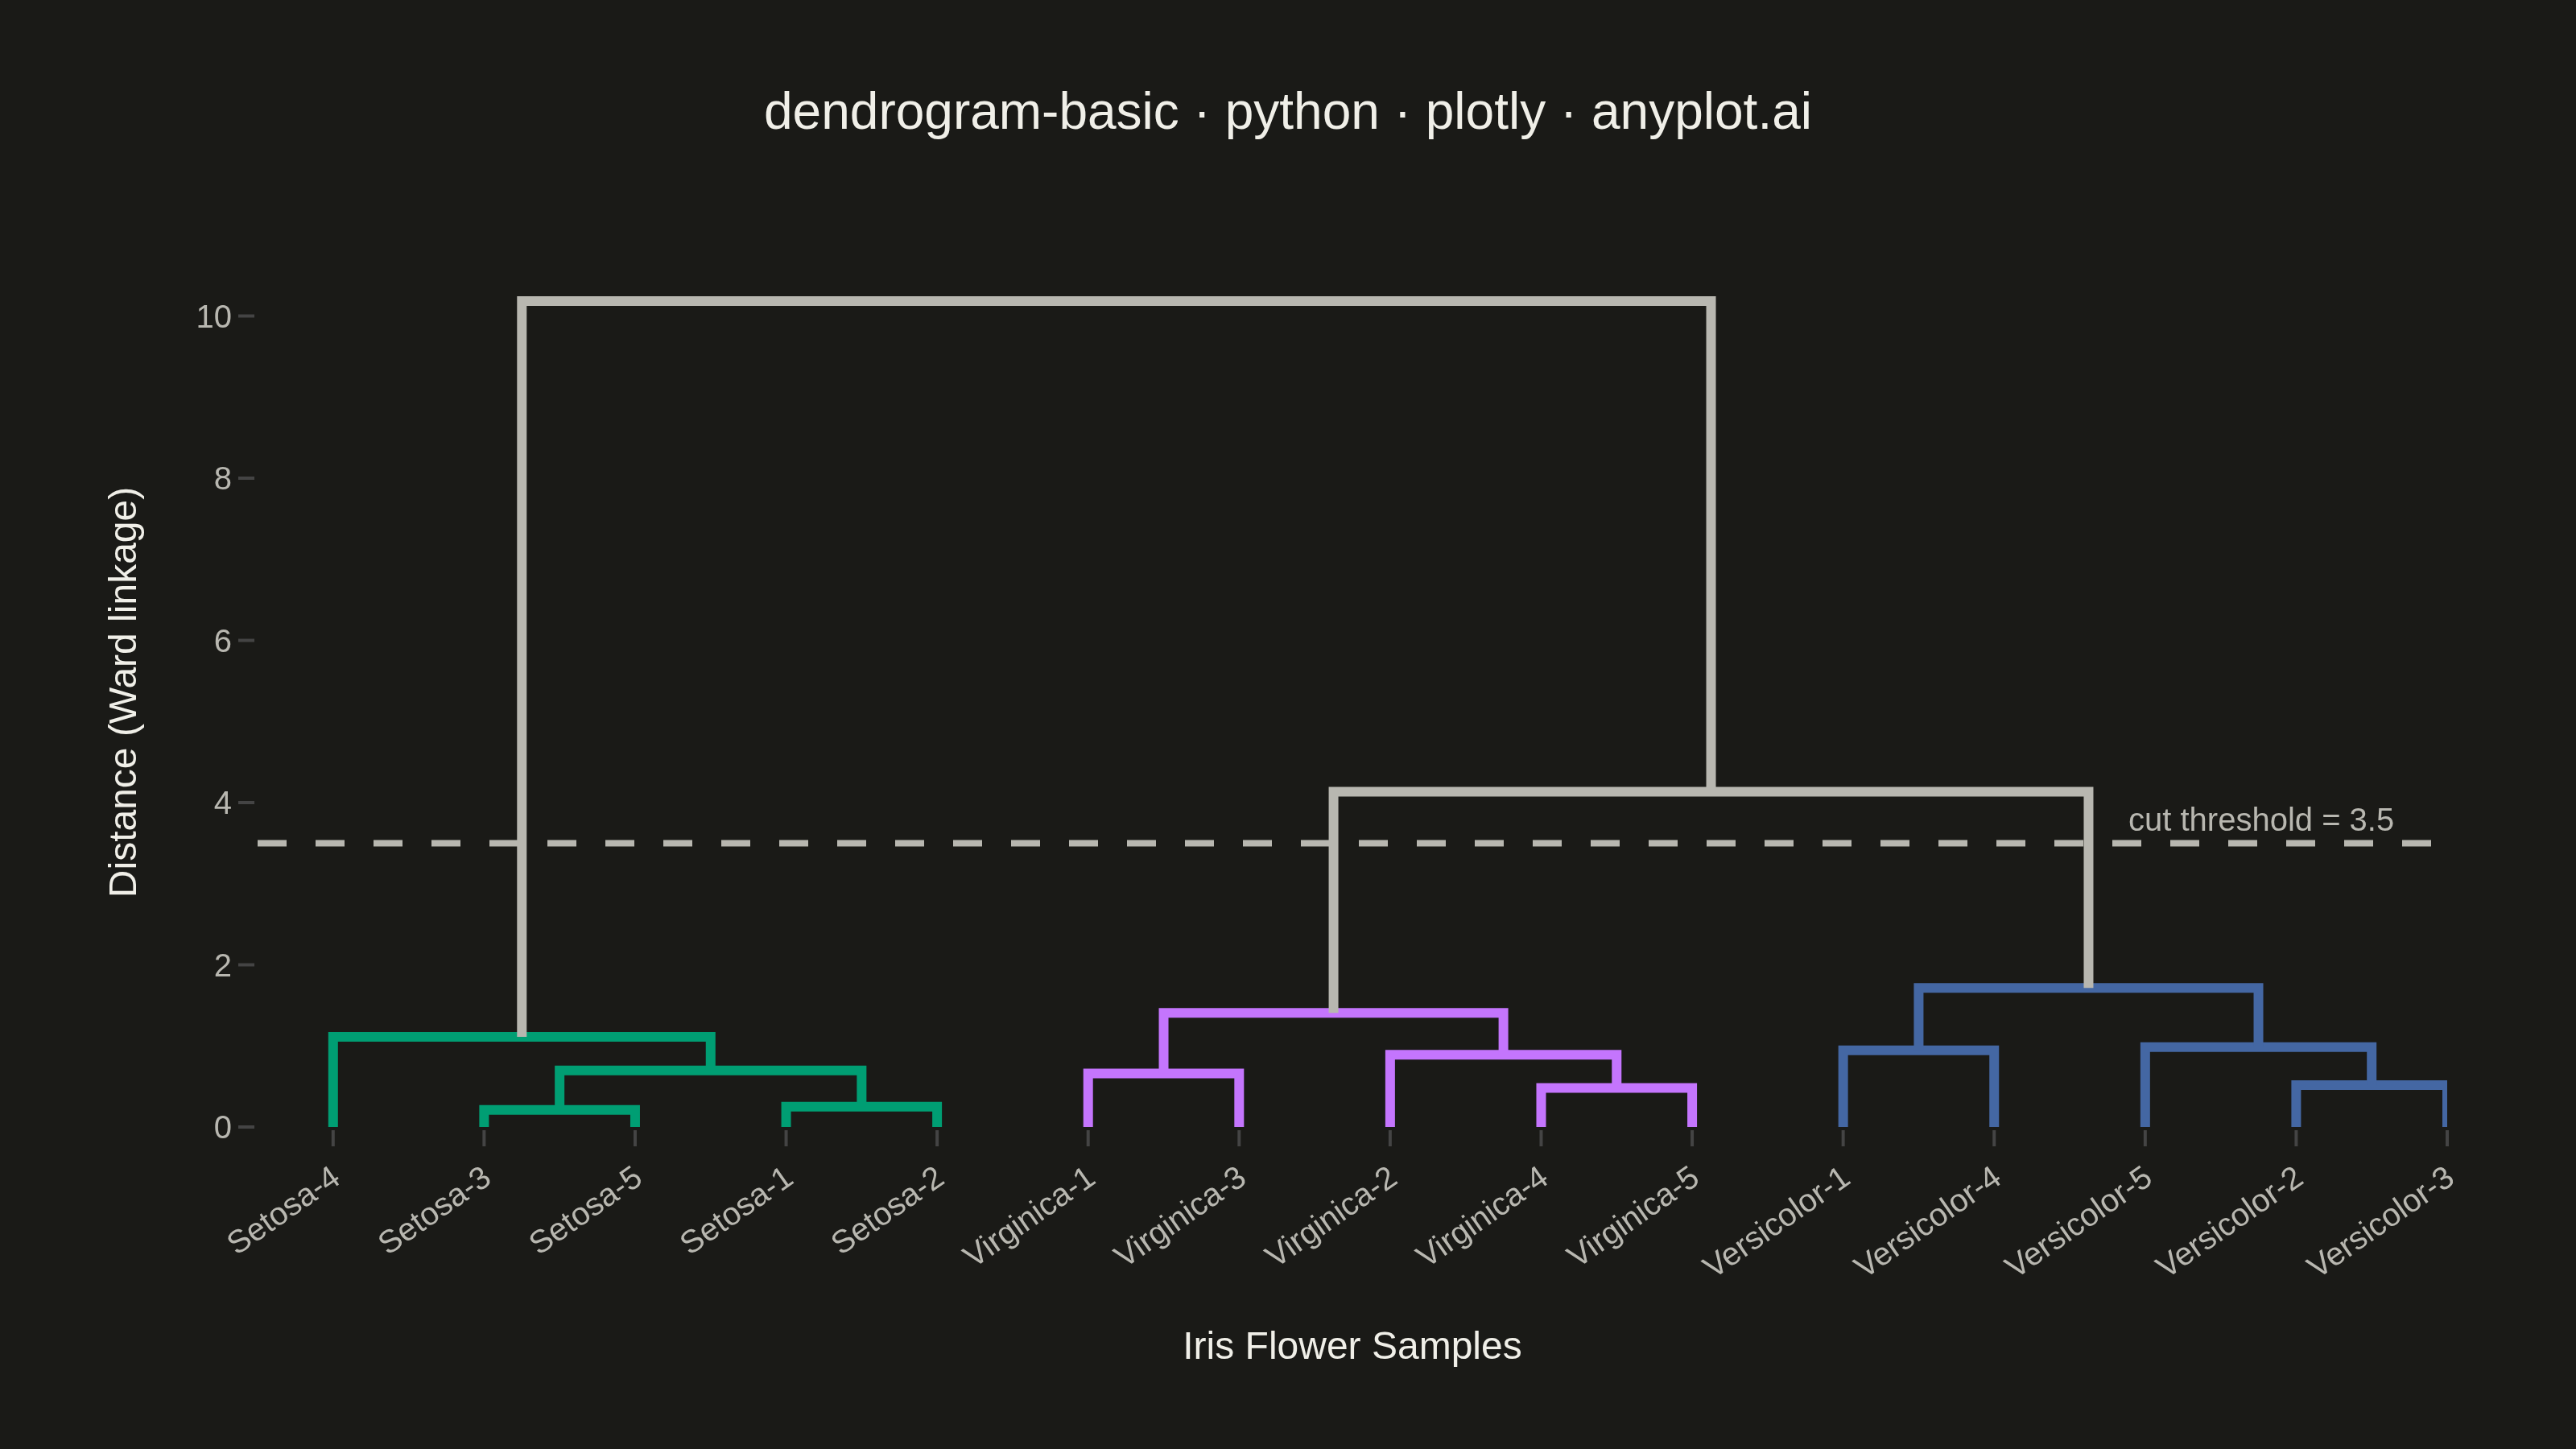
A dendrogram visualizes hierarchical clustering by showing how data points or clusters merge at different distance levels. The tree-like structure reveals relationships and similarity between items, with branch heights indicating the distance at which clusters merge. This visualization is essential for understanding the hierarchical structure in data and identifying natural groupings.
""" anyplot.ai
dendrogram-basic: Basic Dendrogram
Library: plotly 6.8.0 | Python 3.13.13
Quality: 91/100 | Updated: 2026-06-18
"""

import os

import numpy as np
import plotly.figure_factory as ff
from scipy.cluster.hierarchy import linkage


# Theme tokens
THEME = os.getenv("ANYPLOT_THEME", "light")
PAGE_BG = "#FAF8F1" if THEME == "light" else "#1A1A17"
ELEVATED_BG = "#FFFDF6" if THEME == "light" else "#242420"
INK = "#1A1A17" if THEME == "light" else "#F0EFE8"
INK_SOFT = "#4A4A44" if THEME == "light" else "#B8B7B0"
GRID = "rgba(26,26,23,0.15)" if THEME == "light" else "rgba(240,239,232,0.15)"

# Colorscale: maps to scipy color keys (b,c,g,k,m,r,w,y) alphabetically
# C0→b(above threshold), C1→g(cluster 1), C2→r(cluster 2), C3→c(cluster 3)
# Imprint palette — brand green on C1 slot, lavender on C2, blue on C3
colorscale = [
    INK_SOFT,  # b → above-threshold merges (theme-adaptive)
    "#4467A3",  # c → Imprint blue (cluster 3)
    "#009E73",  # g → Imprint green, brand — first cluster colour
    INK_SOFT,  # k → muted ink (softens above-threshold branch rendering)
    "#954477",  # m → Imprint rose
    "#C475FD",  # r → Imprint lavender (cluster 2)
    PAGE_BG,  # w → page background (theme-adaptive)
    "#BD8233",  # y → Imprint ochre
]

# Data - Iris flower measurements for 15 samples across 3 species
np.random.seed(42)
labels = [
    "Setosa-1",
    "Setosa-2",
    "Setosa-3",
    "Setosa-4",
    "Setosa-5",
    "Versicolor-1",
    "Versicolor-2",
    "Versicolor-3",
    "Versicolor-4",
    "Versicolor-5",
    "Virginica-1",
    "Virginica-2",
    "Virginica-3",
    "Virginica-4",
    "Virginica-5",
]

# Sepal length, sepal width, petal length, petal width
# Anisotropic per-feature spread creates richer within-cluster distance variation
setosa = np.random.randn(5, 4) * np.array([0.25, 0.40, 0.15, 0.12]) + np.array([5.0, 3.4, 1.5, 0.2])
versicolor = np.random.randn(5, 4) * np.array([0.55, 0.35, 0.50, 0.28]) + np.array([5.9, 2.8, 4.3, 1.3])
virginica = np.random.randn(5, 4) * np.array([0.50, 0.30, 0.55, 0.32]) + np.array([6.6, 3.0, 5.5, 2.0])
data = np.vstack([setosa, versicolor, virginica])

# Plot - Ward linkage dendrogram with Imprint cluster colouring
fig = ff.create_dendrogram(
    data, labels=labels, colorscale=colorscale, linkagefun=lambda x: linkage(x, method="ward"), color_threshold=3.5
)

# Update branch widths and add merge-distance hover
for trace in fig.data:
    trace.line.width = 3
    max_y = max((y for y in trace.y if y is not None and y > 0), default=0)
    trace.hovertemplate = f"Merge distance: {max_y:.2f}<extra></extra>"

# Dashed cut-threshold line marks the cluster boundary
fig.add_shape(
    type="line",
    x0=0,
    x1=1,
    xref="paper",
    y0=3.5,
    y1=3.5,
    yref="y",
    line={"color": INK_SOFT, "width": 2, "dash": "dash"},
)
fig.add_annotation(
    x=0.98,
    xref="paper",
    y=3.5,
    text="cut threshold = 3.5",
    showarrow=False,
    font={"color": INK_SOFT, "size": 10},
    xanchor="right",
    yanchor="bottom",
)

title = "dendrogram-basic · python · plotly · anyplot.ai"

fig.update_layout(
    autosize=False,
    paper_bgcolor=PAGE_BG,
    plot_bgcolor=PAGE_BG,
    font={"color": INK},
    title={"text": title, "font": {"size": 16, "color": INK}, "x": 0.5, "xanchor": "center"},
    xaxis={
        "title": {"text": "Iris Flower Samples", "font": {"color": INK, "size": 12}},
        "tickfont": {"size": 10, "color": INK_SOFT},
        "tickangle": -35,
        "showline": False,
        "zeroline": False,
        "mirror": False,
        "gridcolor": GRID,
        "linecolor": INK_SOFT,
        "zerolinecolor": INK_SOFT,
    },
    yaxis={
        "title": {"text": "Distance (Ward linkage)", "font": {"color": INK, "size": 12}},
        "tickfont": {"size": 10, "color": INK_SOFT},
        "showline": False,
        "zeroline": False,
        "mirror": False,
        "gridcolor": GRID,
        "linecolor": INK_SOFT,
        "zerolinecolor": INK_SOFT,
    },
    xaxis2={
        "visible": False,
        "showticklabels": False,
        "showline": False,
        "showgrid": False,
        "zeroline": False,
        "ticks": "",
    },
    yaxis2={
        "visible": False,
        "showticklabels": False,
        "showline": False,
        "showgrid": False,
        "zeroline": False,
        "ticks": "",
    },
    margin={"l": 80, "r": 40, "t": 80, "b": 100},
    hoverlabel={"bgcolor": ELEVATED_BG, "font_size": 12, "bordercolor": INK_SOFT},
)

# Save
fig.write_image(f"plot-{THEME}.png", width=800, height=450, scale=4)
fig.write_html(f"plot-{THEME}.html", include_plotlyjs="cdn")
Runnable source as JSON, for any HTTP client: https://api.anyplot.ai/specs/dendrogram-basic/plotly/code. Any spec id and library id listed in llms-full.txt fit the same URL shape; every URL below is complete and callable.
{
  "spec_id": "dendrogram-basic",
  "language": "python",
  "library": "plotly",
  "page": "https://anyplot.ai/dendrogram-basic/python/plotly",
  "hub": "https://anyplot.ai/dendrogram-basic",
  "code_json": "https://api.anyplot.ai/specs/dendrogram-basic/plotly/code",
  "spec_json": "https://api.anyplot.ai/specs/dendrogram-basic",
  "render_light_png": "https://storage.googleapis.com/anyplot-images/plots/dendrogram-basic/python/plotly/plot-light.png",
  "render_dark_png": "https://storage.googleapis.com/anyplot-images/plots/dendrogram-basic/python/plotly/plot-dark.png",
  "interactive_light_html": "https://storage.googleapis.com/anyplot-images/plots/dendrogram-basic/python/plotly/plot-light.html",
  "interactive_dark_html": "https://storage.googleapis.com/anyplot-images/plots/dendrogram-basic/python/plotly/plot-dark.html",
  "quality_score": 91.0,
  "license": "MIT",
  "guide": "https://anyplot.ai/llms.txt"
}
Part of Basic Dendrogram on anyplot.ai.