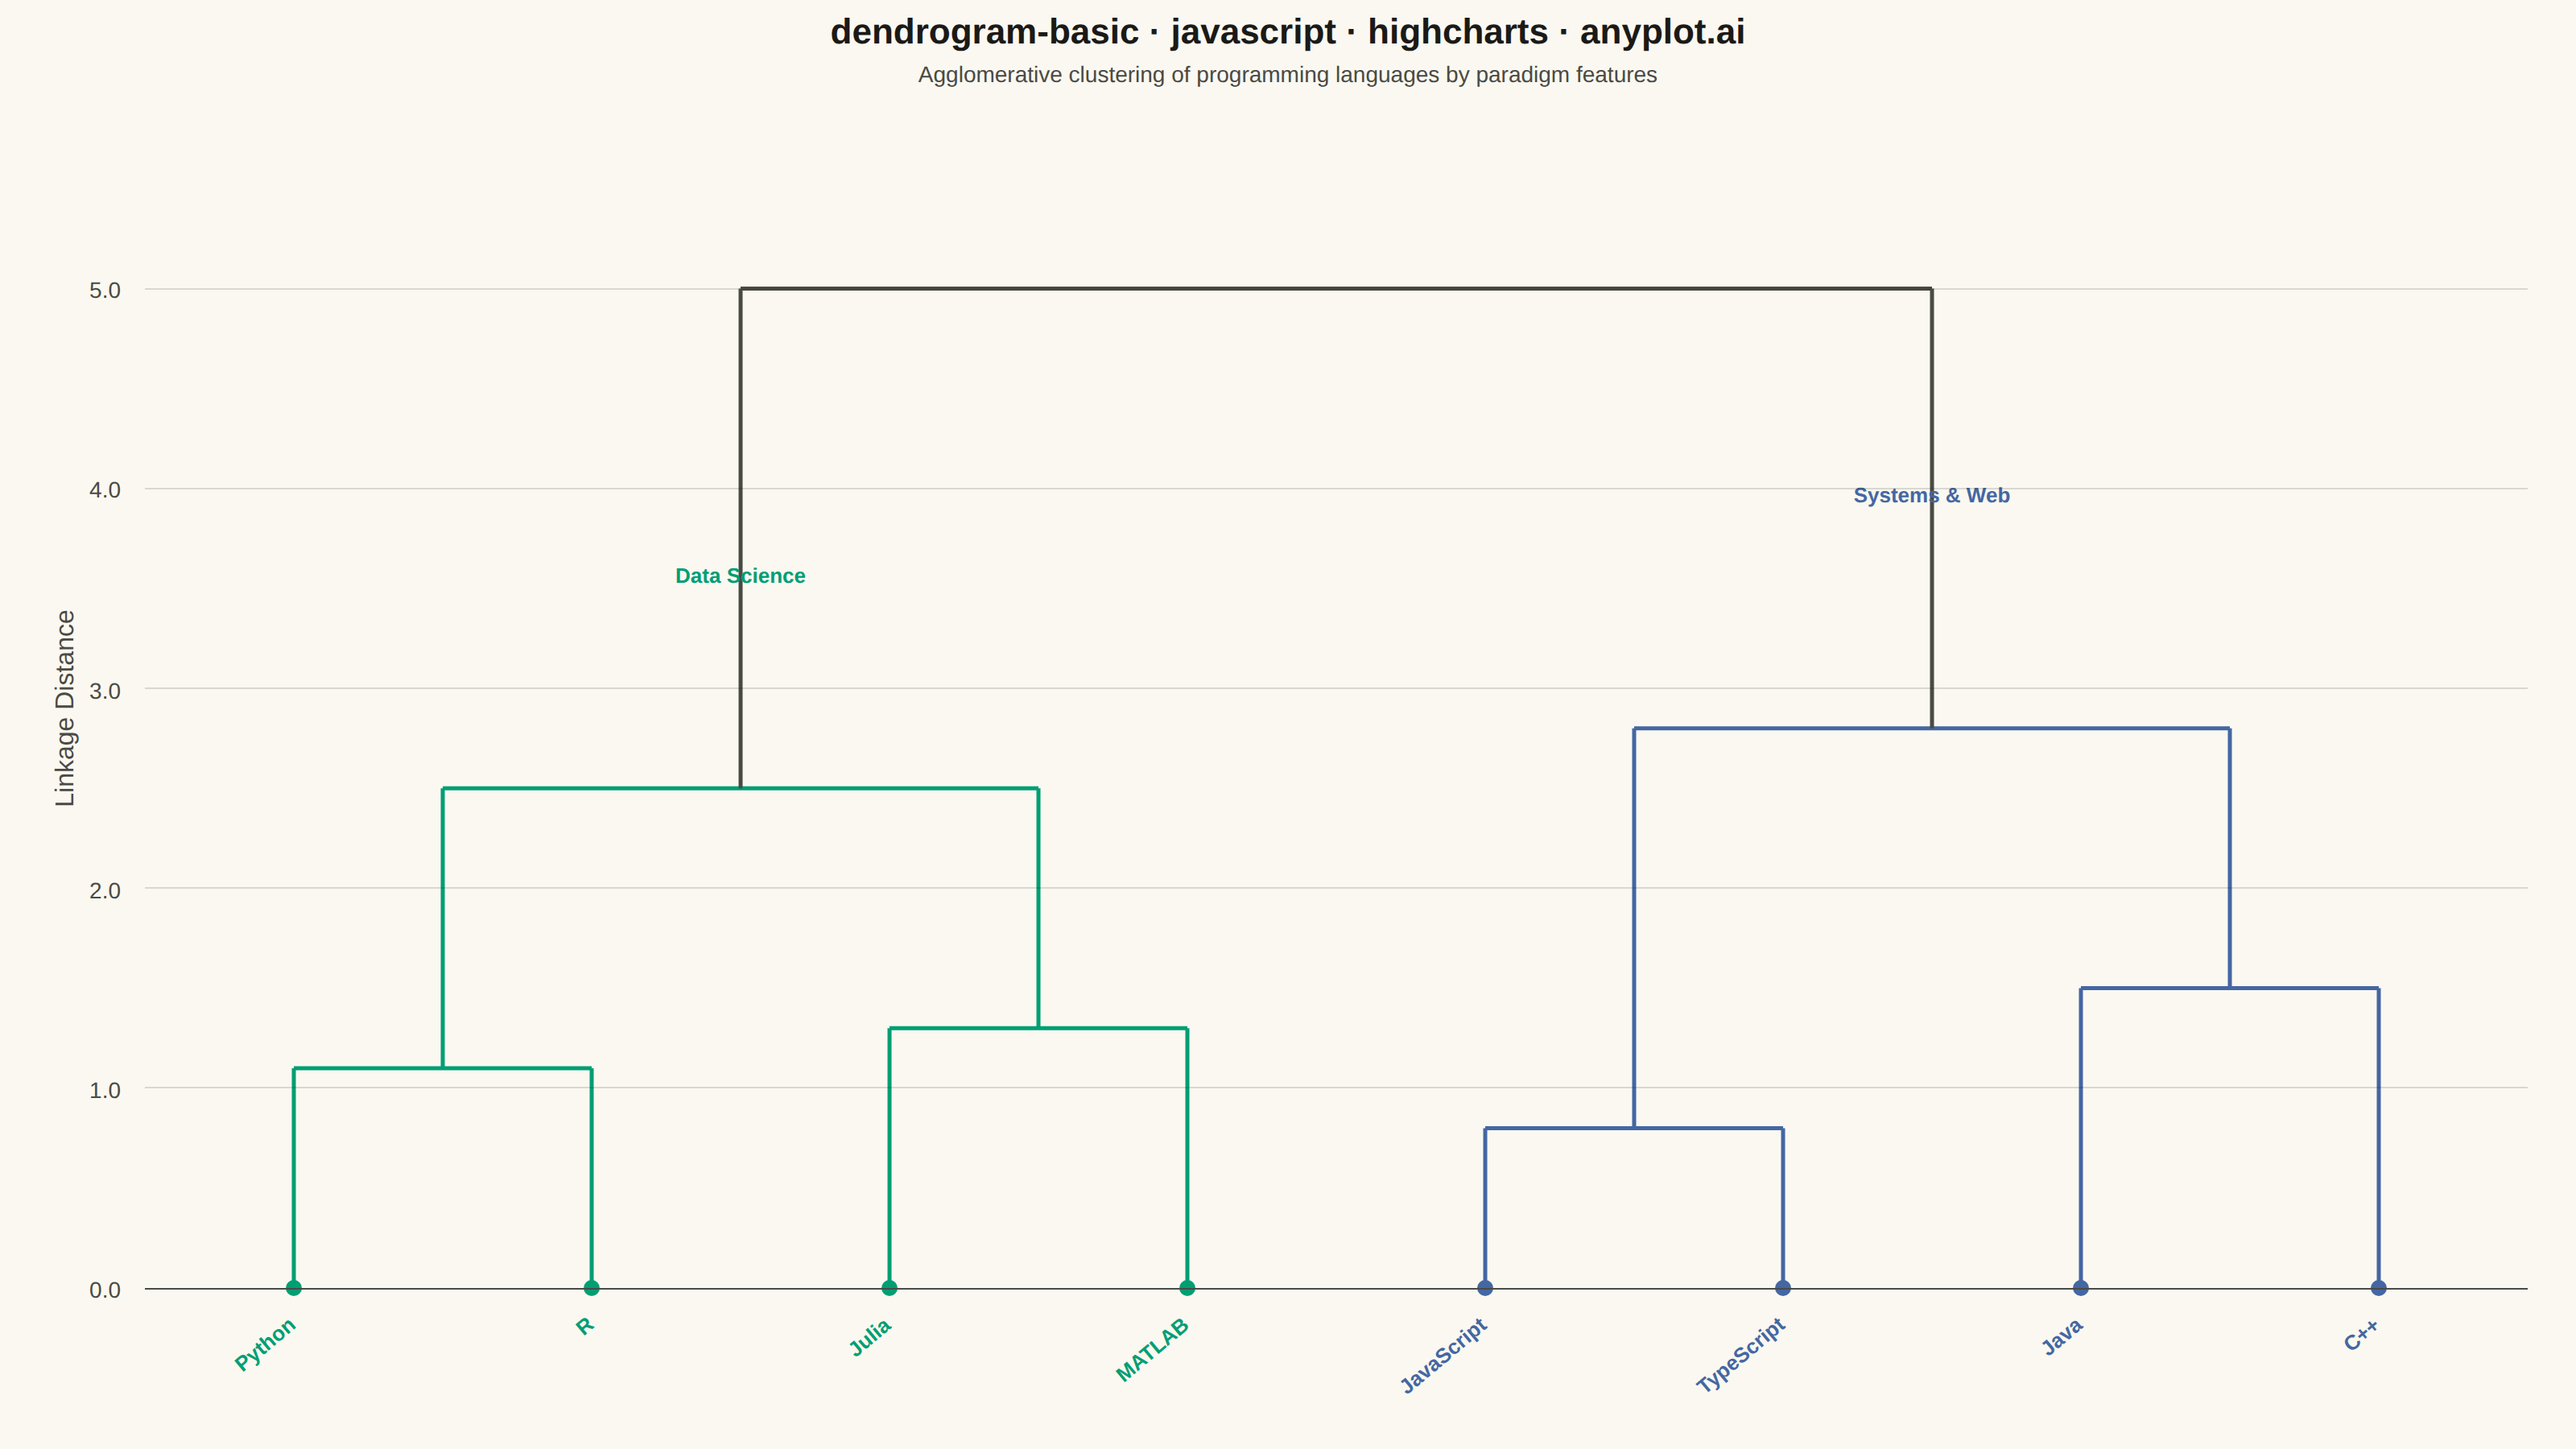
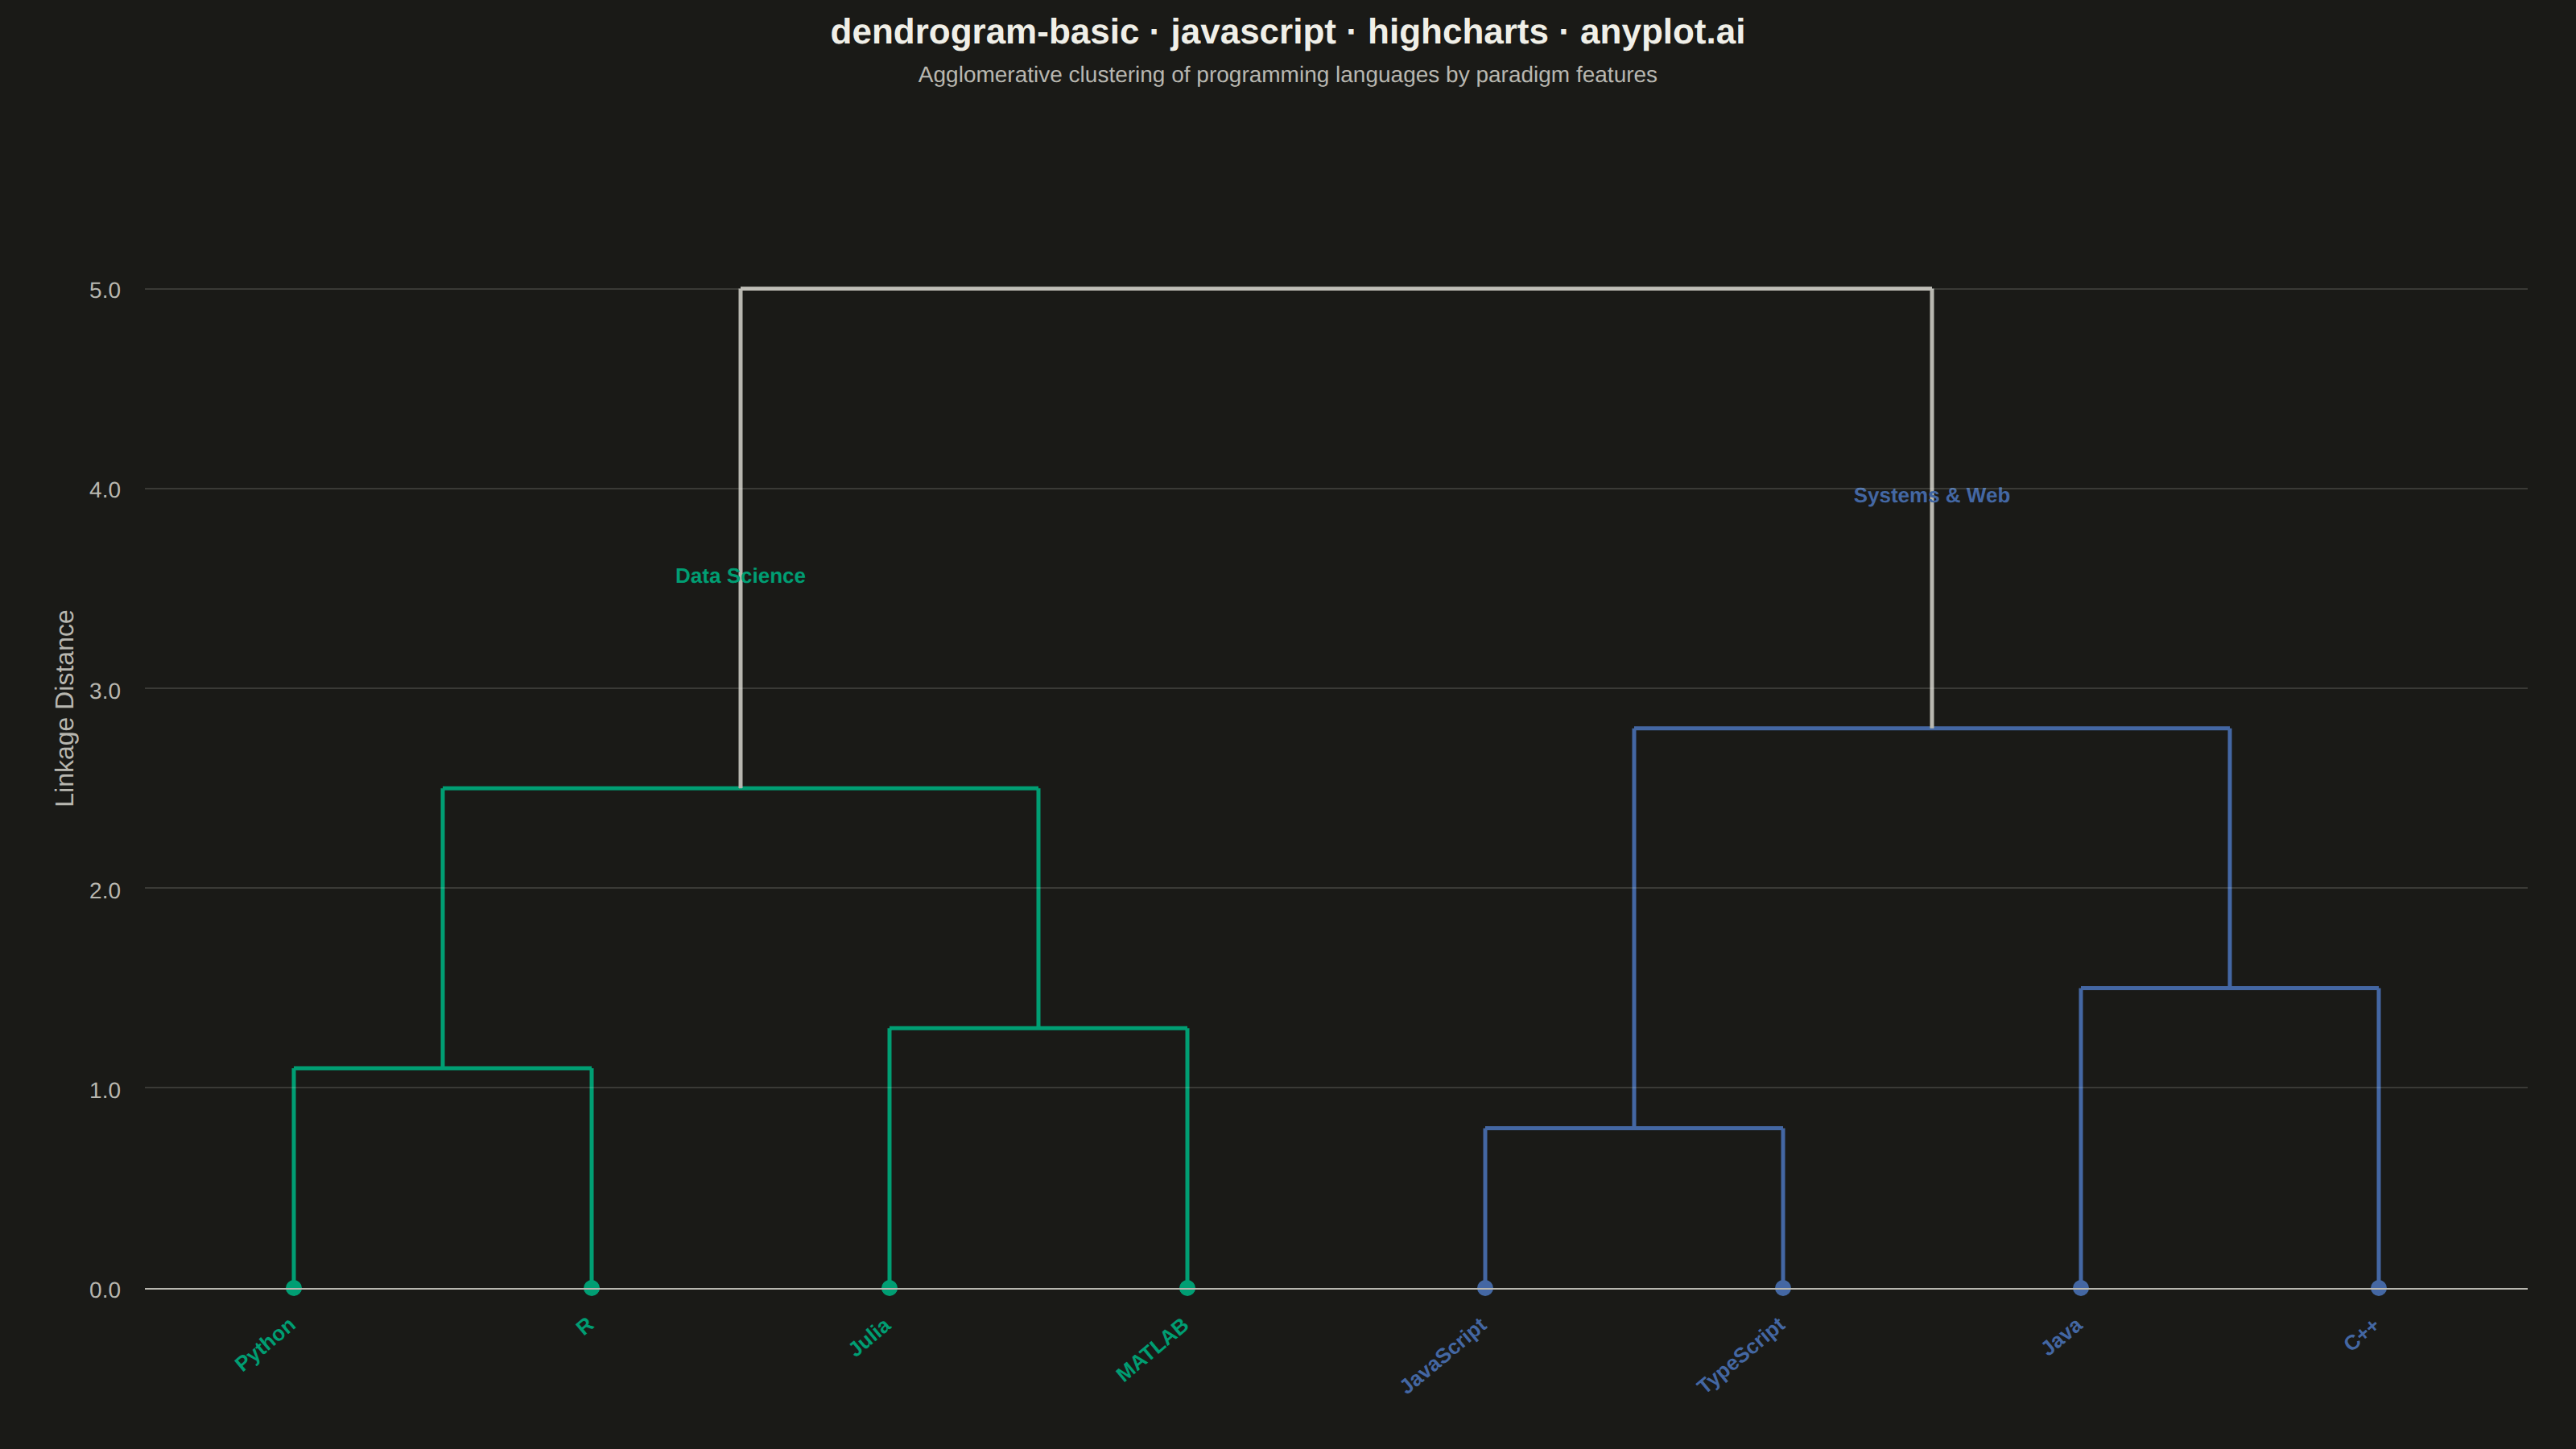
A dendrogram visualizes hierarchical clustering by showing how data points or clusters merge at different distance levels. The tree-like structure reveals relationships and similarity between items, with branch heights indicating the distance at which clusters merge. This visualization is essential for understanding the hierarchical structure in data and identifying natural groupings.
// anyplot.ai
// dendrogram-basic: Basic Dendrogram
// Library: highcharts 12.6.0 | JavaScript 22.22.3
// Quality: 91/100 | Created: 2026-06-18
//# anyplot-orientation: landscape
// anyplot.ai
// dendrogram-basic: Basic Dendrogram
// Library: Highcharts 12.6.0 | Node 22
// License: Highcharts — commercial license, free for non-commercial use (highcharts.com/license)
// Quality: pending | Created: 2026-06-18

const t = window.ANYPLOT_TOKENS;
const GREEN = t.palette[0];  // #009E73 — data-science / scripting cluster
const BLUE  = t.palette[2];  // #4467A3 — systems / web cluster

const leafLabels = ["Python", "R", "Julia", "MATLAB", "JavaScript", "TypeScript", "Java", "C++"];

// Pre-computed agglomerative clustering of programming languages by paradigm features.
// Each row: [leftX, leftH, rightX, rightH, mergeH, branchColor]
//   leftX / rightX  — x-centre of the child (leaf index or midpoint of a prior merge)
//   leftH / rightH  — merge height of that child (0 for leaves)
//   mergeH          — linkage distance at which the two children join
const merges = [
    [0,   0,    1,   0,    1.1, GREEN],          // Python  + R
    [2,   0,    3,   0,    1.3, GREEN],          // Julia   + MATLAB
    [0.5, 1.1,  2.5, 1.3,  2.5, GREEN],         // scripting + scientific → data-science cluster
    [4,   0,    5,   0,    0.8, BLUE],           // JavaScript + TypeScript
    [6,   0,    7,   0,    1.5, BLUE],           // Java    + C++
    [4.5, 0.8,  6.5, 1.5,  2.8, BLUE],          // web     + systems → systems cluster
    [1.5, 2.5,  5.5, 2.8,  5.0, t.inkSoft],     // root merge
];

Highcharts.chart("container", {
    chart: {
        backgroundColor: "transparent",
        animation: false,
        marginLeft:   90,
        marginRight:  30,
        marginBottom: 100,
        marginTop:    80,
        style: { fontFamily: "inherit" },
        events: {
            render: function () {
                const c = this;

                // Destroy and recreate the renderer group on every render pass
                if (c._dg) c._dg.destroy();
                const g = c.renderer.g("dg").add();
                c._dg = g;

                const xa = c.xAxis[0];
                const ya = c.yAxis[0];
                const lw = 2.5;

                // Draw each merge as three line segments: horizontal bar + two vertical drops
                merges.forEach(([lx, lh, rx, rh, mh, col]) => {
                    const x1 = xa.toPixels(lx, false);
                    const x2 = xa.toPixels(rx, false);
                    const ym = ya.toPixels(mh, false);
                    const yl = ya.toPixels(lh, false);
                    const yr = ya.toPixels(rh, false);

                    // Horizontal bar at merge height
                    c.renderer.path(["M", x1, ym, "L", x2, ym])
                        .attr({ stroke: col, "stroke-width": lw, zIndex: 5 })
                        .add(g);
                    // Left vertical drop
                    c.renderer.path(["M", x1, ym, "L", x1, yl])
                        .attr({ stroke: col, "stroke-width": lw, zIndex: 5 })
                        .add(g);
                    // Right vertical drop
                    c.renderer.path(["M", x2, ym, "L", x2, yr])
                        .attr({ stroke: col, "stroke-width": lw, zIndex: 5 })
                        .add(g);
                });

                // Leaf dots at y = 0, colored by cluster membership
                leafLabels.forEach(function (_, i) {
                    const px = xa.toPixels(i, false);
                    const py = ya.toPixels(0, false);
                    c.renderer.circle(px, py, 5)
                        .attr({ fill: i < 4 ? GREEN : BLUE, zIndex: 6 })
                        .add(g);
                });

                // Inline cluster labels positioned inside each subtree
                var greenLx = xa.toPixels(1.5, false);
                var greenLy = ya.toPixels(3.5, false) - 4;
                c.renderer.text("Data Science", greenLx, greenLy)
                    .css({ color: GREEN, fontSize: "13px", fontWeight: "700" })
                    .attr({ align: "center", zIndex: 7 })
                    .add(g);

                var blueLx = xa.toPixels(5.5, false);
                var blueLy = ya.toPixels(3.9, false) - 4;
                c.renderer.text("Systems & Web", blueLx, blueLy)
                    .css({ color: BLUE, fontSize: "13px", fontWeight: "700" })
                    .attr({ align: "center", zIndex: 7 })
                    .add(g);
            }
        }
    },
    credits: { enabled: false },
    title: {
        text: "dendrogram-basic · javascript · highcharts · anyplot.ai",
        style: { color: t.ink, fontSize: "22px", fontWeight: "600" }
    },
    subtitle: {
        text: "Agglomerative clustering of programming languages by paradigm features",
        style: { color: t.inkSoft, fontSize: "14px" }
    },
    xAxis: {
        min: -0.5,
        max: 7.5,
        tickPositions: [0, 1, 2, 3, 4, 5, 6, 7],
        startOnTick: false,
        endOnTick: false,
        lineColor: t.inkSoft,
        tickColor: "transparent",
        gridLineWidth: 0,
        labels: {
            useHTML: true,
            formatter: function () {
                var i = Math.round(this.value);
                if (i < 0 || i >= leafLabels.length) return "";
                var col = i < 4 ? GREEN : BLUE;
                return "<span style=\"color:" + col + ";font-weight:700\">" + leafLabels[i] + "</span>";
            },
            style: { fontSize: "13px" },
            rotation: -40,
            align: "right"
        },
        title: { enabled: false }
    },
    yAxis: {
        title: {
            text: "Linkage Distance",
            style: { color: t.inkSoft, fontSize: "16px" }
        },
        min: 0,
        max: 5.8,
        startOnTick: false,
        endOnTick: false,
        lineColor: t.inkSoft,
        gridLineColor: t.grid,
        gridLineWidth: 1,
        labels: {
            format: "{value:.1f}",
            style: { color: t.inkSoft, fontSize: "14px" }
        }
    },
    legend:      { enabled: false },
    plotOptions: { series: { animation: false } },
    series:      [{ type: "scatter", data: [], showInLegend: false, enableMouseTracking: false }]
});
Runnable source as JSON, for any HTTP client: https://api.anyplot.ai/specs/dendrogram-basic/highcharts/code. Any spec id and library id listed in llms-full.txt fit the same URL shape; every URL below is complete and callable.
{
  "spec_id": "dendrogram-basic",
  "language": "javascript",
  "library": "highcharts",
  "page": "https://anyplot.ai/dendrogram-basic/javascript/highcharts",
  "hub": "https://anyplot.ai/dendrogram-basic",
  "code_json": "https://api.anyplot.ai/specs/dendrogram-basic/highcharts/code",
  "spec_json": "https://api.anyplot.ai/specs/dendrogram-basic",
  "render_light_png": "https://storage.googleapis.com/anyplot-images/plots/dendrogram-basic/javascript/highcharts/plot-light.png",
  "render_dark_png": "https://storage.googleapis.com/anyplot-images/plots/dendrogram-basic/javascript/highcharts/plot-dark.png",
  "interactive_light_html": "https://storage.googleapis.com/anyplot-images/plots/dendrogram-basic/javascript/highcharts/plot-light.html",
  "interactive_dark_html": "https://storage.googleapis.com/anyplot-images/plots/dendrogram-basic/javascript/highcharts/plot-dark.html",
  "quality_score": 91.0,
  "license": "MIT",
  "guide": "https://anyplot.ai/llms.txt"
}
Part of Basic Dendrogram on anyplot.ai.