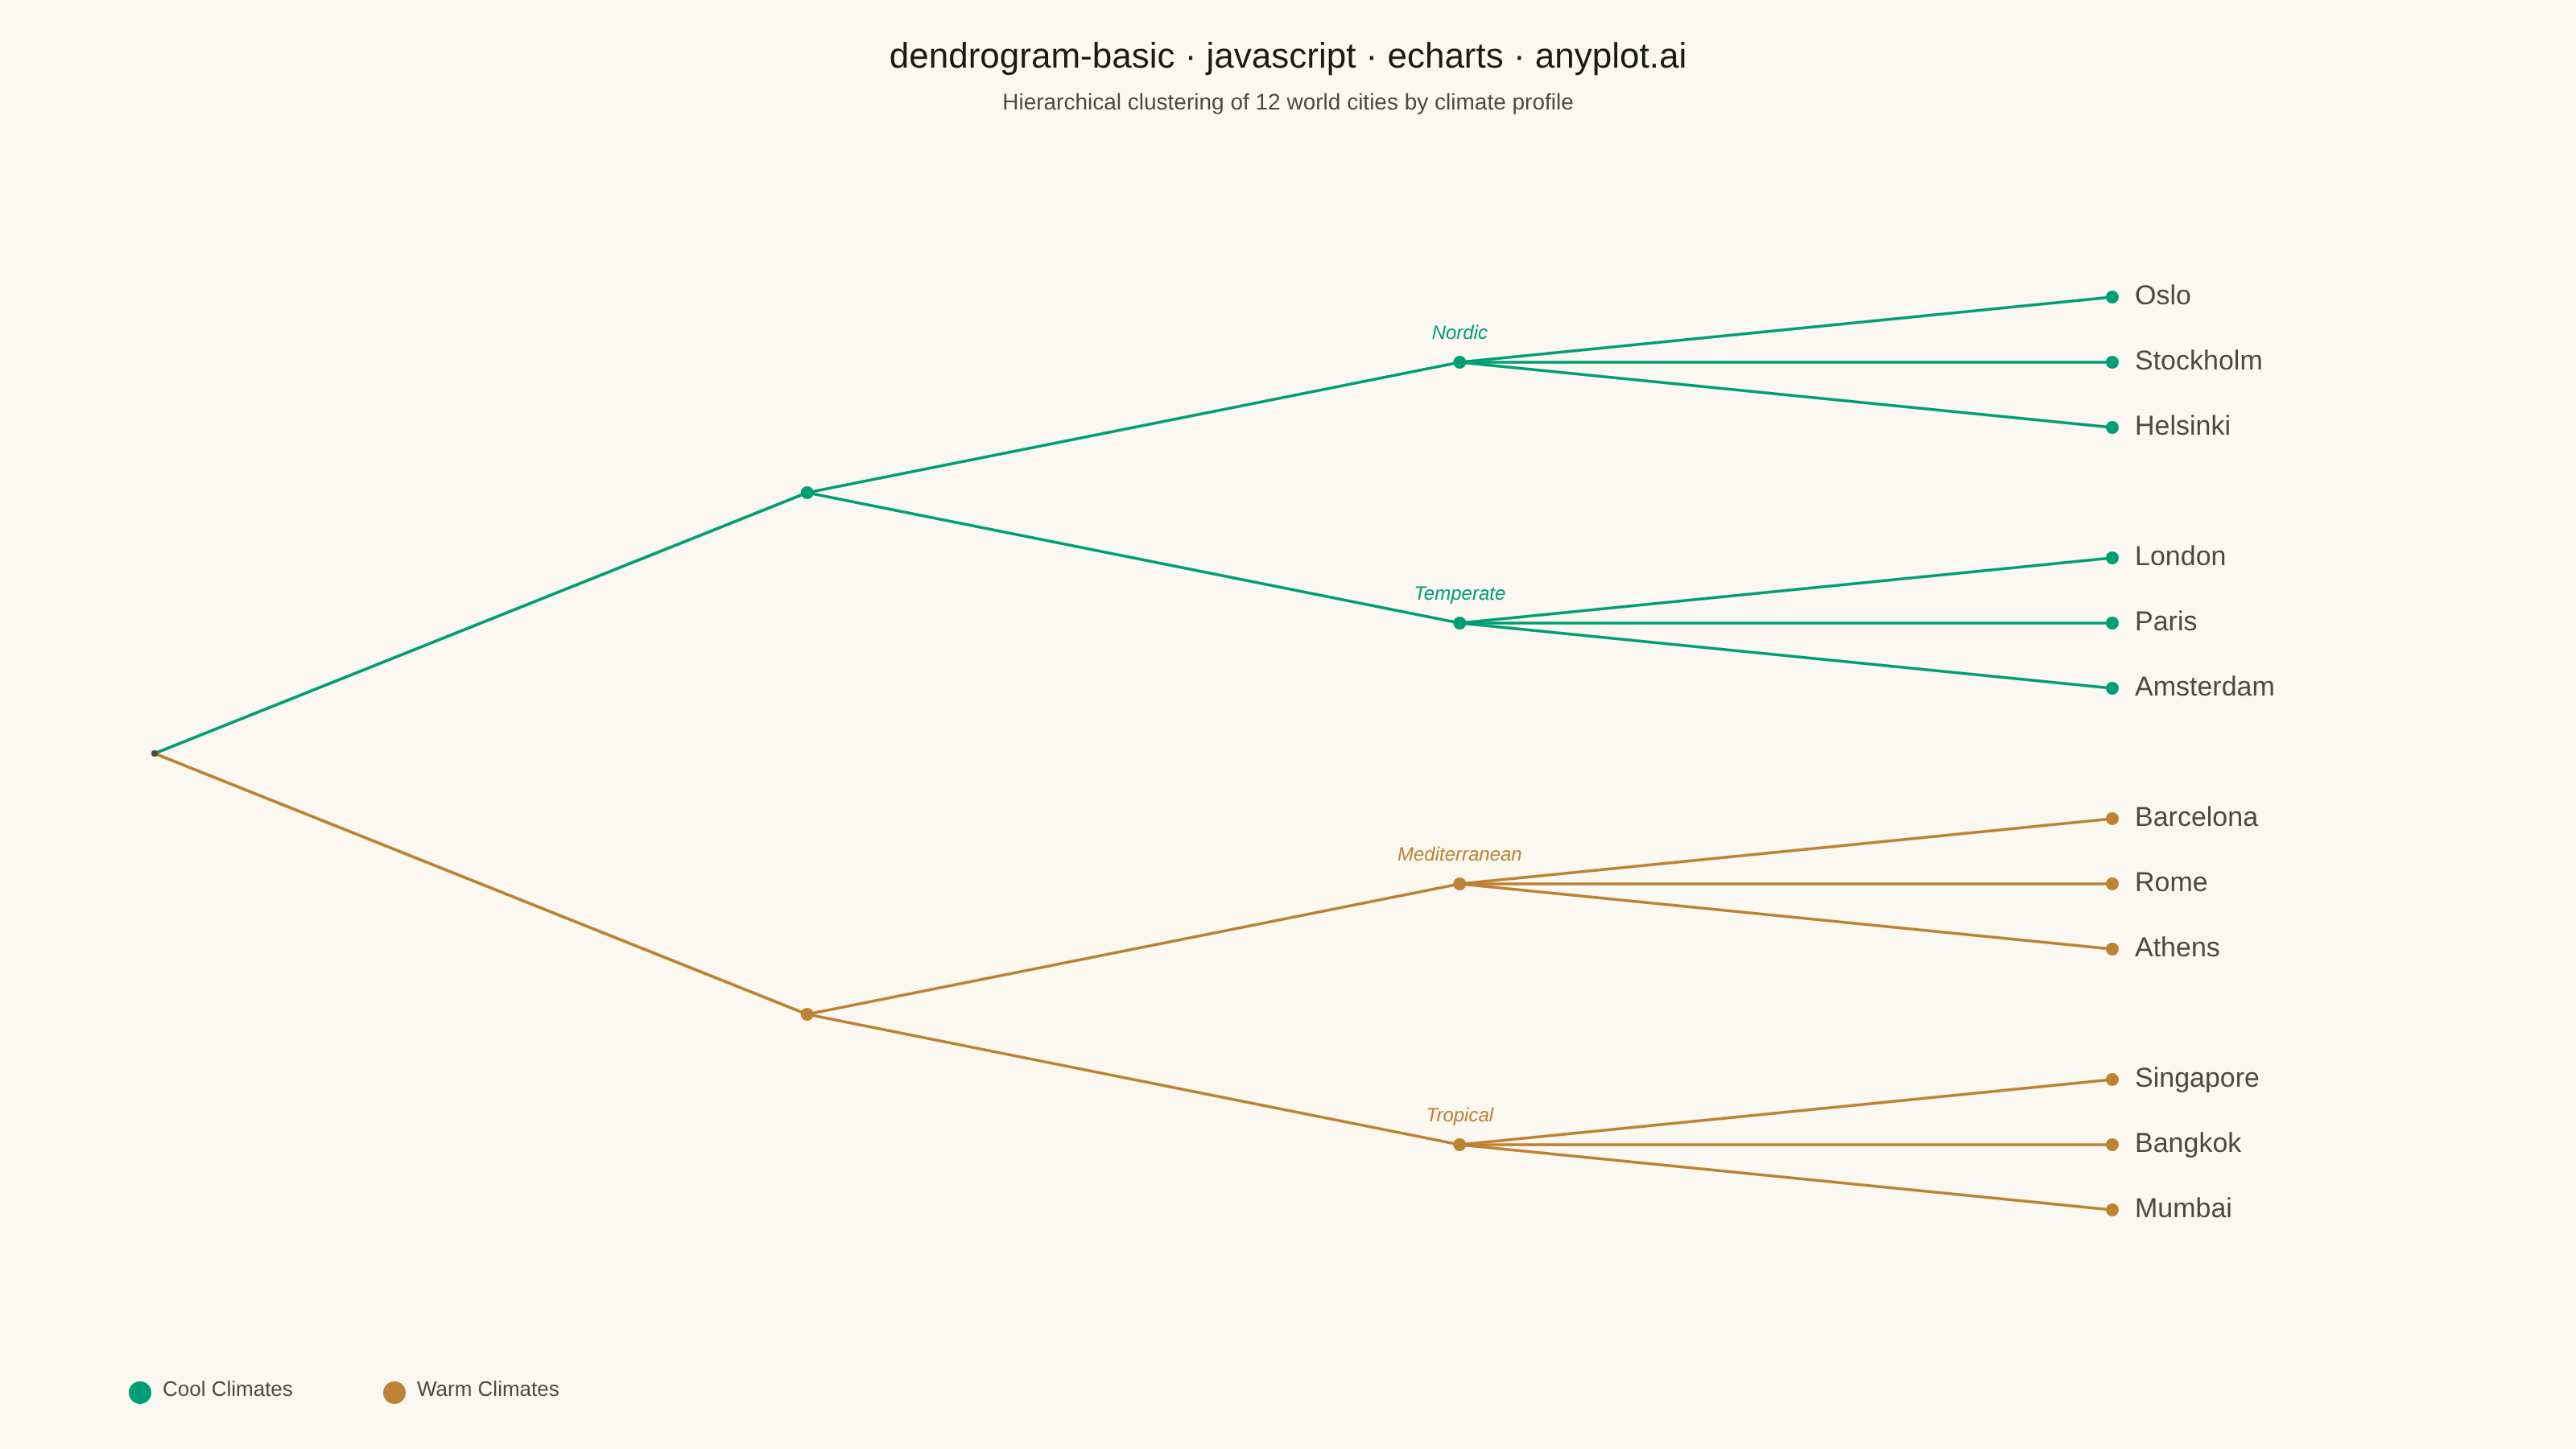
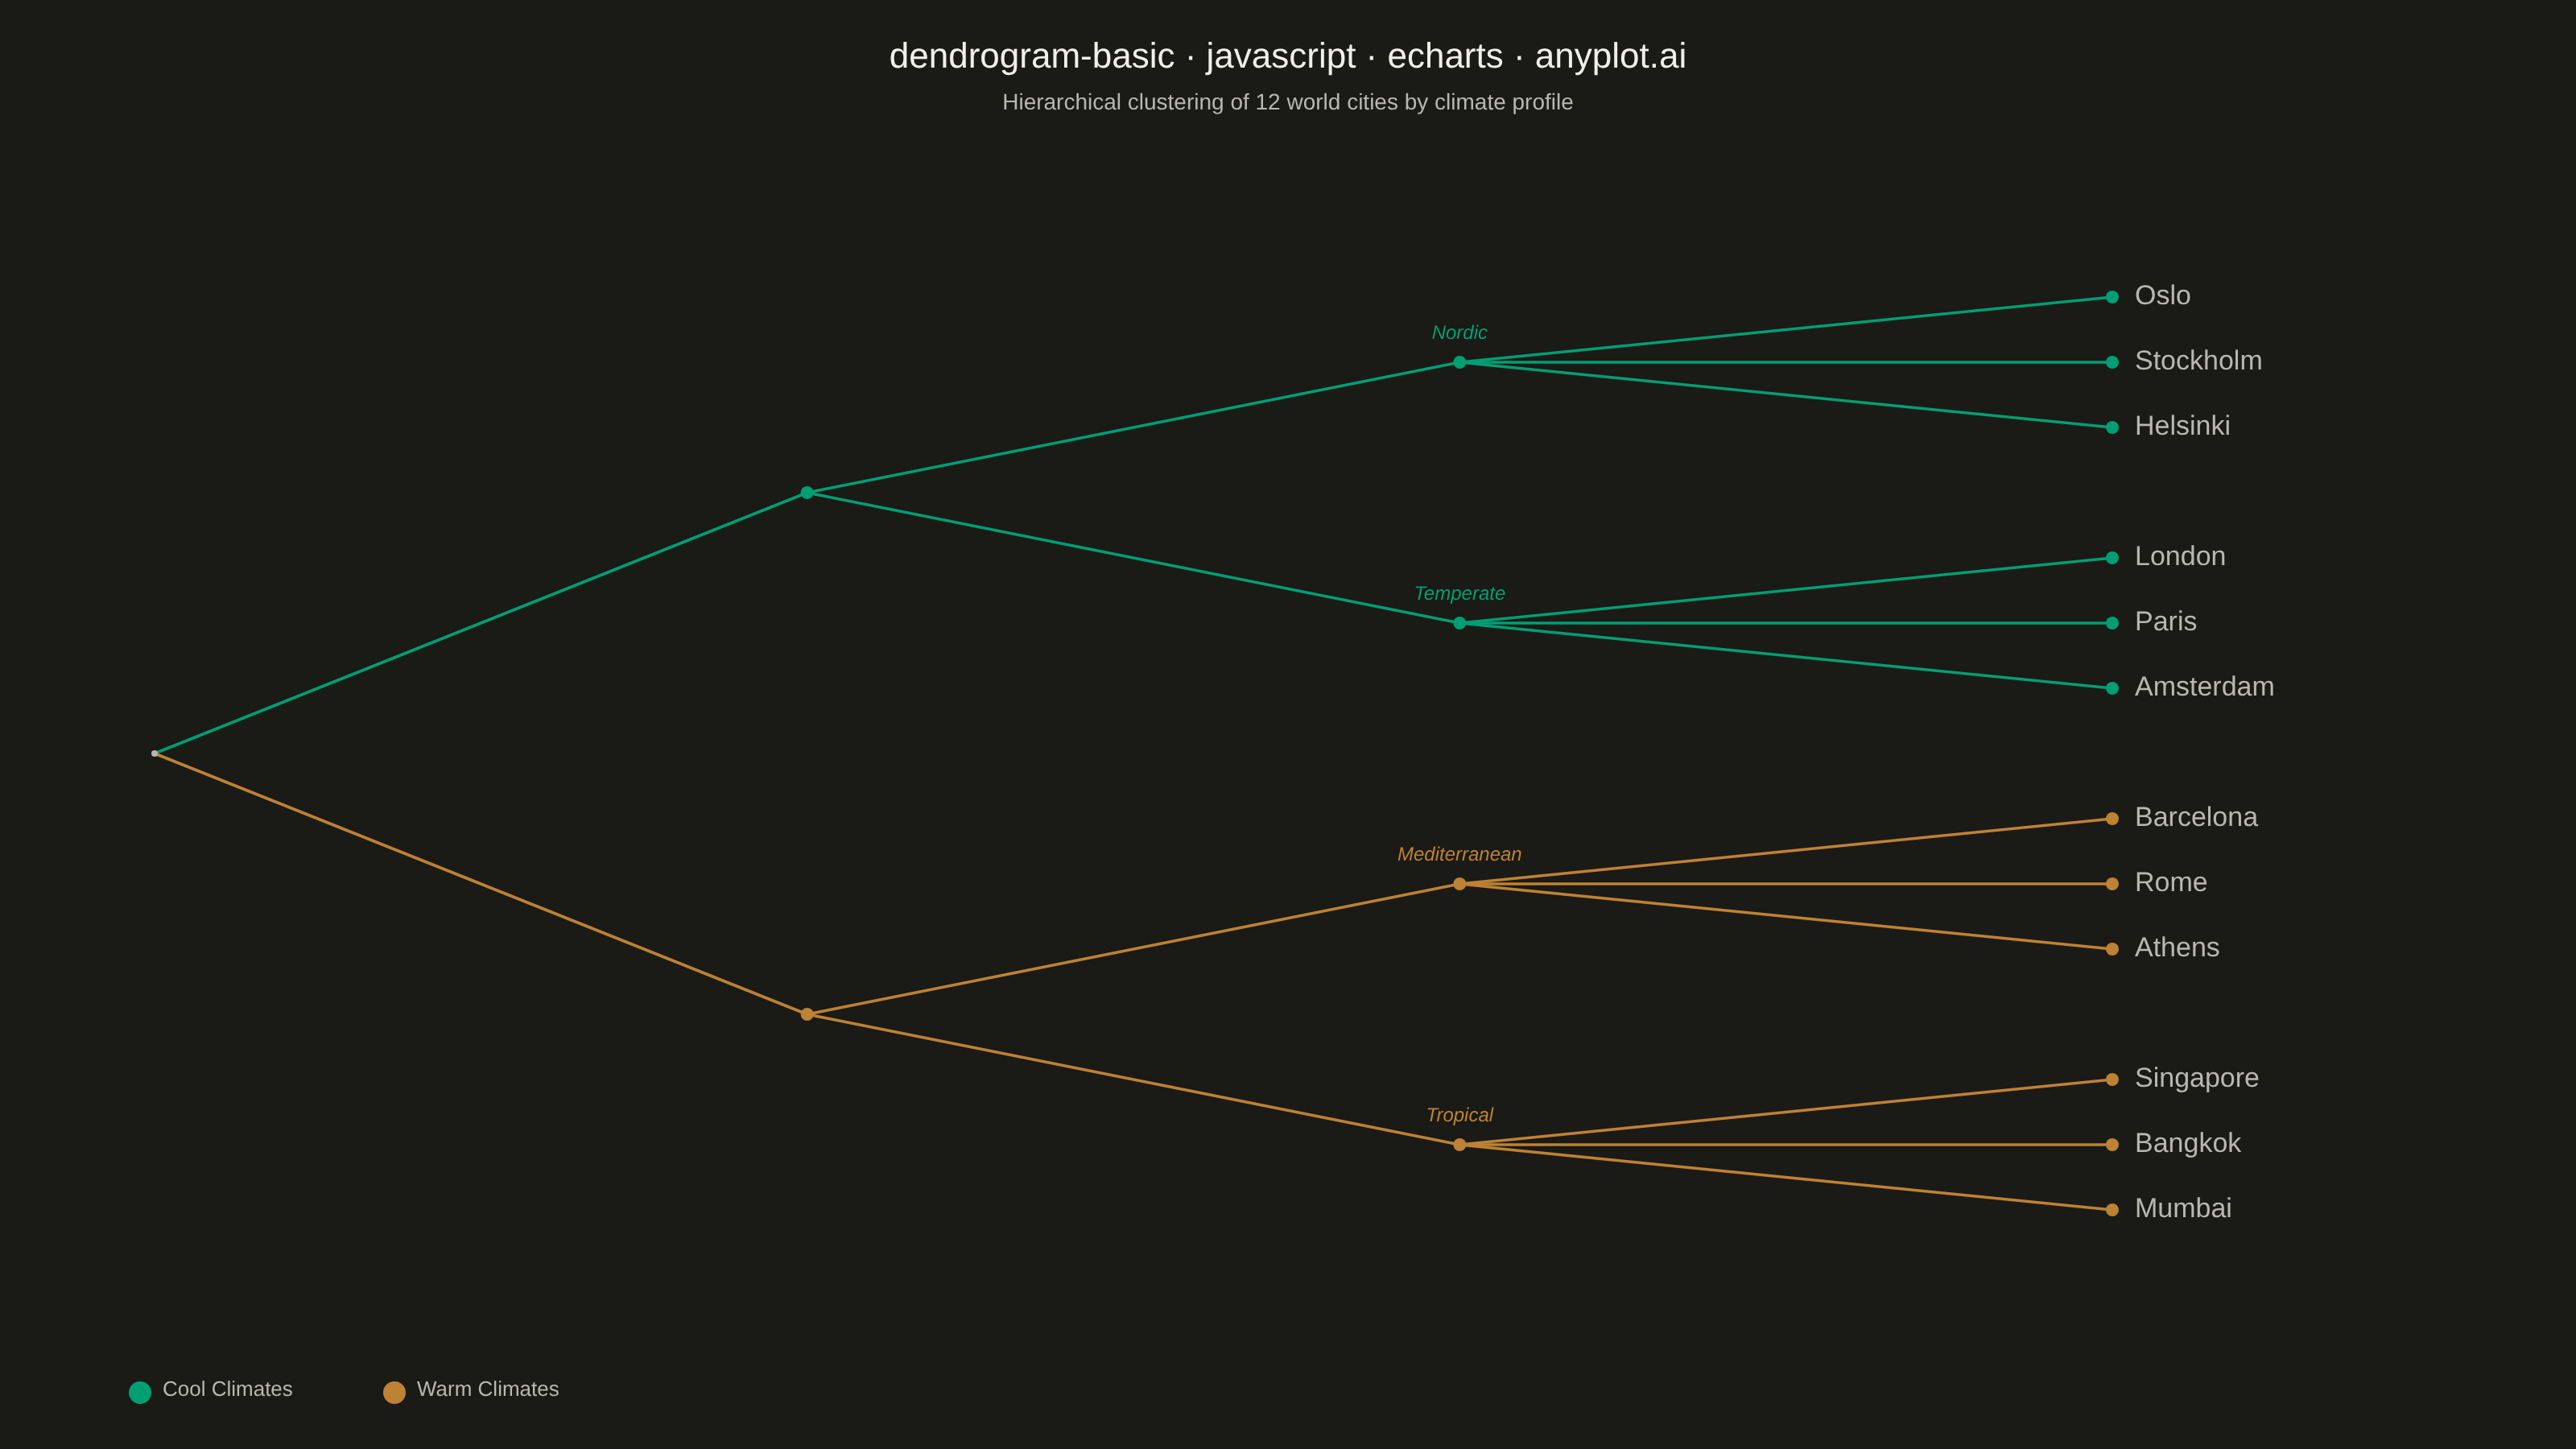
A dendrogram visualizes hierarchical clustering by showing how data points or clusters merge at different distance levels. The tree-like structure reveals relationships and similarity between items, with branch heights indicating the distance at which clusters merge. This visualization is essential for understanding the hierarchical structure in data and identifying natural groupings.
// anyplot.ai
// dendrogram-basic: Basic Dendrogram
// Library: echarts 5.5.1 | JavaScript 22.22.3
// Quality: 88/100 | Created: 2026-06-18

const t = window.ANYPLOT_TOKENS;

const COOL = t.palette[0];  // #009E73 brand green — cool climates
const WARM = t.palette[3];  // #BD8233 ochre — warm climates

// Leaf city labels — sized for readability at mobile viewports
const LEAF_LABEL = {
  show: true,
  position: "right",
  verticalAlign: "middle",
  align: "left",
  fontSize: 17,
  color: t.inkSoft,
  distance: 10,
};

// Sub-group cluster label (Nordic, Temperate, etc.) — italic annotation above node
const clusterLabel = (color) => ({
  show: true,
  position: "top",
  verticalAlign: "bottom",
  align: "center",
  fontSize: 12,
  fontStyle: "italic",
  color,
  distance: 8,
});

// Leaf node helper — still needs per-node lineStyle/itemStyle since ECharts tree
// does not cascade edge color from ancestor nodes to descendant edges
const city = (name, color) => ({
  name,
  label: LEAF_LABEL,
  lineStyle: { color },
  itemStyle: { color },
});

// 12 world cities hierarchically clustered by climate profile (topology only —
// ECharts tree uses uniform level spacing, not proportional merge distances)
const treeData = {
  name: "",
  label: { show: false },
  symbolSize: 4,
  itemStyle: { color: t.inkSoft },
  children: [
    {
      name: "Cool Climates",
      label: { show: false },
      lineStyle: { color: COOL },
      itemStyle: { color: COOL },
      children: [
        {
          name: "Nordic",
          label: clusterLabel(COOL),
          lineStyle: { color: COOL },
          itemStyle: { color: COOL },
          children: [
            city("Oslo", COOL),
            city("Stockholm", COOL),
            city("Helsinki", COOL),
          ],
        },
        {
          name: "Temperate",
          label: clusterLabel(COOL),
          lineStyle: { color: COOL },
          itemStyle: { color: COOL },
          children: [
            city("London", COOL),
            city("Paris", COOL),
            city("Amsterdam", COOL),
          ],
        },
      ],
    },
    {
      name: "Warm Climates",
      label: { show: false },
      lineStyle: { color: WARM },
      itemStyle: { color: WARM },
      children: [
        {
          name: "Mediterranean",
          label: clusterLabel(WARM),
          lineStyle: { color: WARM },
          itemStyle: { color: WARM },
          children: [
            city("Barcelona", WARM),
            city("Rome", WARM),
            city("Athens", WARM),
          ],
        },
        {
          name: "Tropical",
          label: clusterLabel(WARM),
          lineStyle: { color: WARM },
          itemStyle: { color: WARM },
          children: [
            city("Singapore", WARM),
            city("Bangkok", WARM),
            city("Mumbai", WARM),
          ],
        },
      ],
    },
  ],
};

// Init
const chart = echarts.init(document.getElementById("container"));

chart.setOption({
  animation: false,
  backgroundColor: "transparent",
  title: {
    text: "dendrogram-basic · javascript · echarts · anyplot.ai",
    subtext: "Hierarchical clustering of 12 world cities by climate profile",
    left: "center",
    top: 20,
    textStyle: { color: t.ink, fontSize: 22, fontWeight: "500" },
    subtextStyle: { color: t.inkSoft, fontSize: 14 },
  },
  graphic: [
    {
      type: "group",
      left: 80,
      bottom: 28,
      children: [
        { type: "circle", shape: { cx: 8, cy: 8, r: 7 }, style: { fill: COOL } },
        {
          type: "text",
          left: 22,
          top: 0,
          style: { text: "Cool Climates", fill: t.inkSoft, fontSize: 13, fontFamily: "sans-serif" },
        },
        { type: "circle", shape: { cx: 166, cy: 8, r: 7 }, style: { fill: WARM } },
        {
          type: "text",
          left: 180,
          top: 0,
          style: { text: "Warm Climates", fill: t.inkSoft, fontSize: 13, fontFamily: "sans-serif" },
        },
      ],
    },
  ],
  series: [
    {
      type: "tree",
      data: [treeData],
      layout: "orthogonal",
      orient: "LR",
      left: "6%",
      right: "18%",
      top: "16%",
      bottom: "12%",
      symbol: "circle",
      symbolSize: 8,
      expandAndCollapse: false,
      initialTreeDepth: -1,
      roam: false,
      lineStyle: {
        width: 1.8,
        curveness: 0,
      },
      label: {
        show: false,
      },
    },
  ],
});
Runnable source as JSON, for any HTTP client: https://api.anyplot.ai/specs/dendrogram-basic/echarts/code. Any spec id and library id listed in llms-full.txt fit the same URL shape; every URL below is complete and callable.
{
  "spec_id": "dendrogram-basic",
  "language": "javascript",
  "library": "echarts",
  "page": "https://anyplot.ai/dendrogram-basic/javascript/echarts",
  "hub": "https://anyplot.ai/dendrogram-basic",
  "code_json": "https://api.anyplot.ai/specs/dendrogram-basic/echarts/code",
  "spec_json": "https://api.anyplot.ai/specs/dendrogram-basic",
  "render_light_png": "https://storage.googleapis.com/anyplot-images/plots/dendrogram-basic/javascript/echarts/plot-light.png",
  "render_dark_png": "https://storage.googleapis.com/anyplot-images/plots/dendrogram-basic/javascript/echarts/plot-dark.png",
  "interactive_light_html": "https://storage.googleapis.com/anyplot-images/plots/dendrogram-basic/javascript/echarts/plot-light.html",
  "interactive_dark_html": "https://storage.googleapis.com/anyplot-images/plots/dendrogram-basic/javascript/echarts/plot-dark.html",
  "quality_score": 88.0,
  "license": "MIT",
  "guide": "https://anyplot.ai/llms.txt"
}
Part of Basic Dendrogram on anyplot.ai.