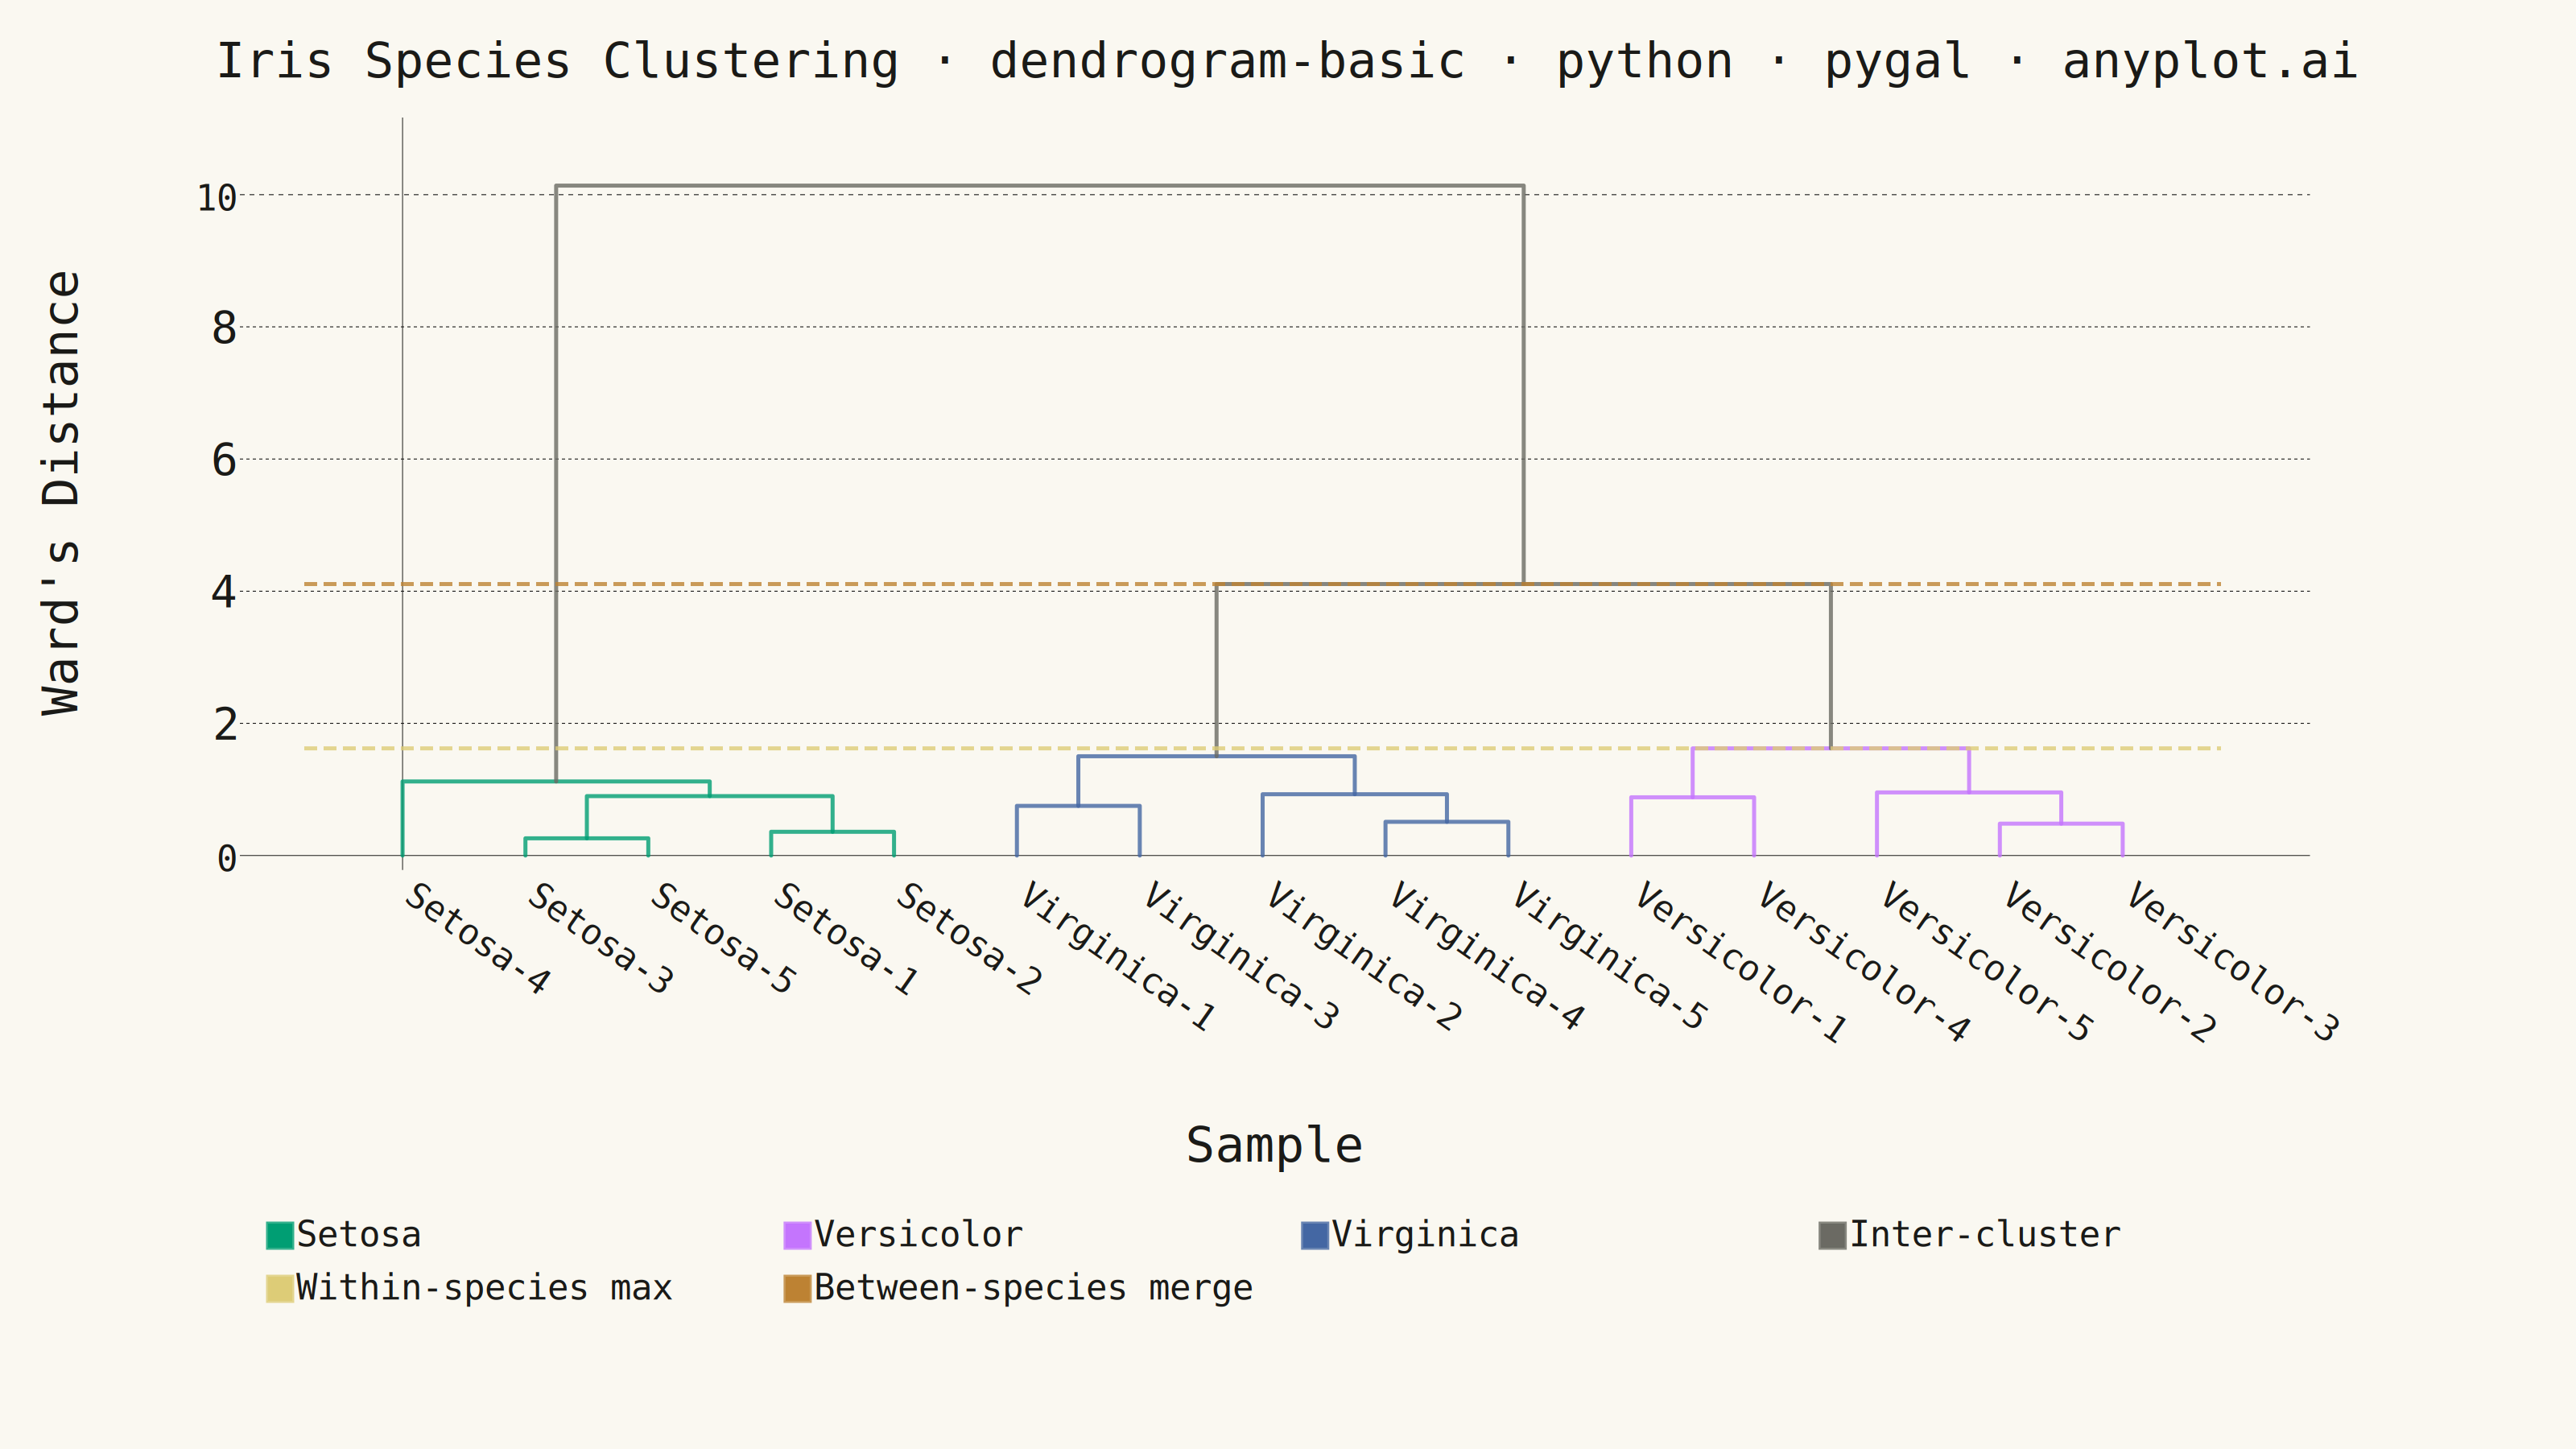
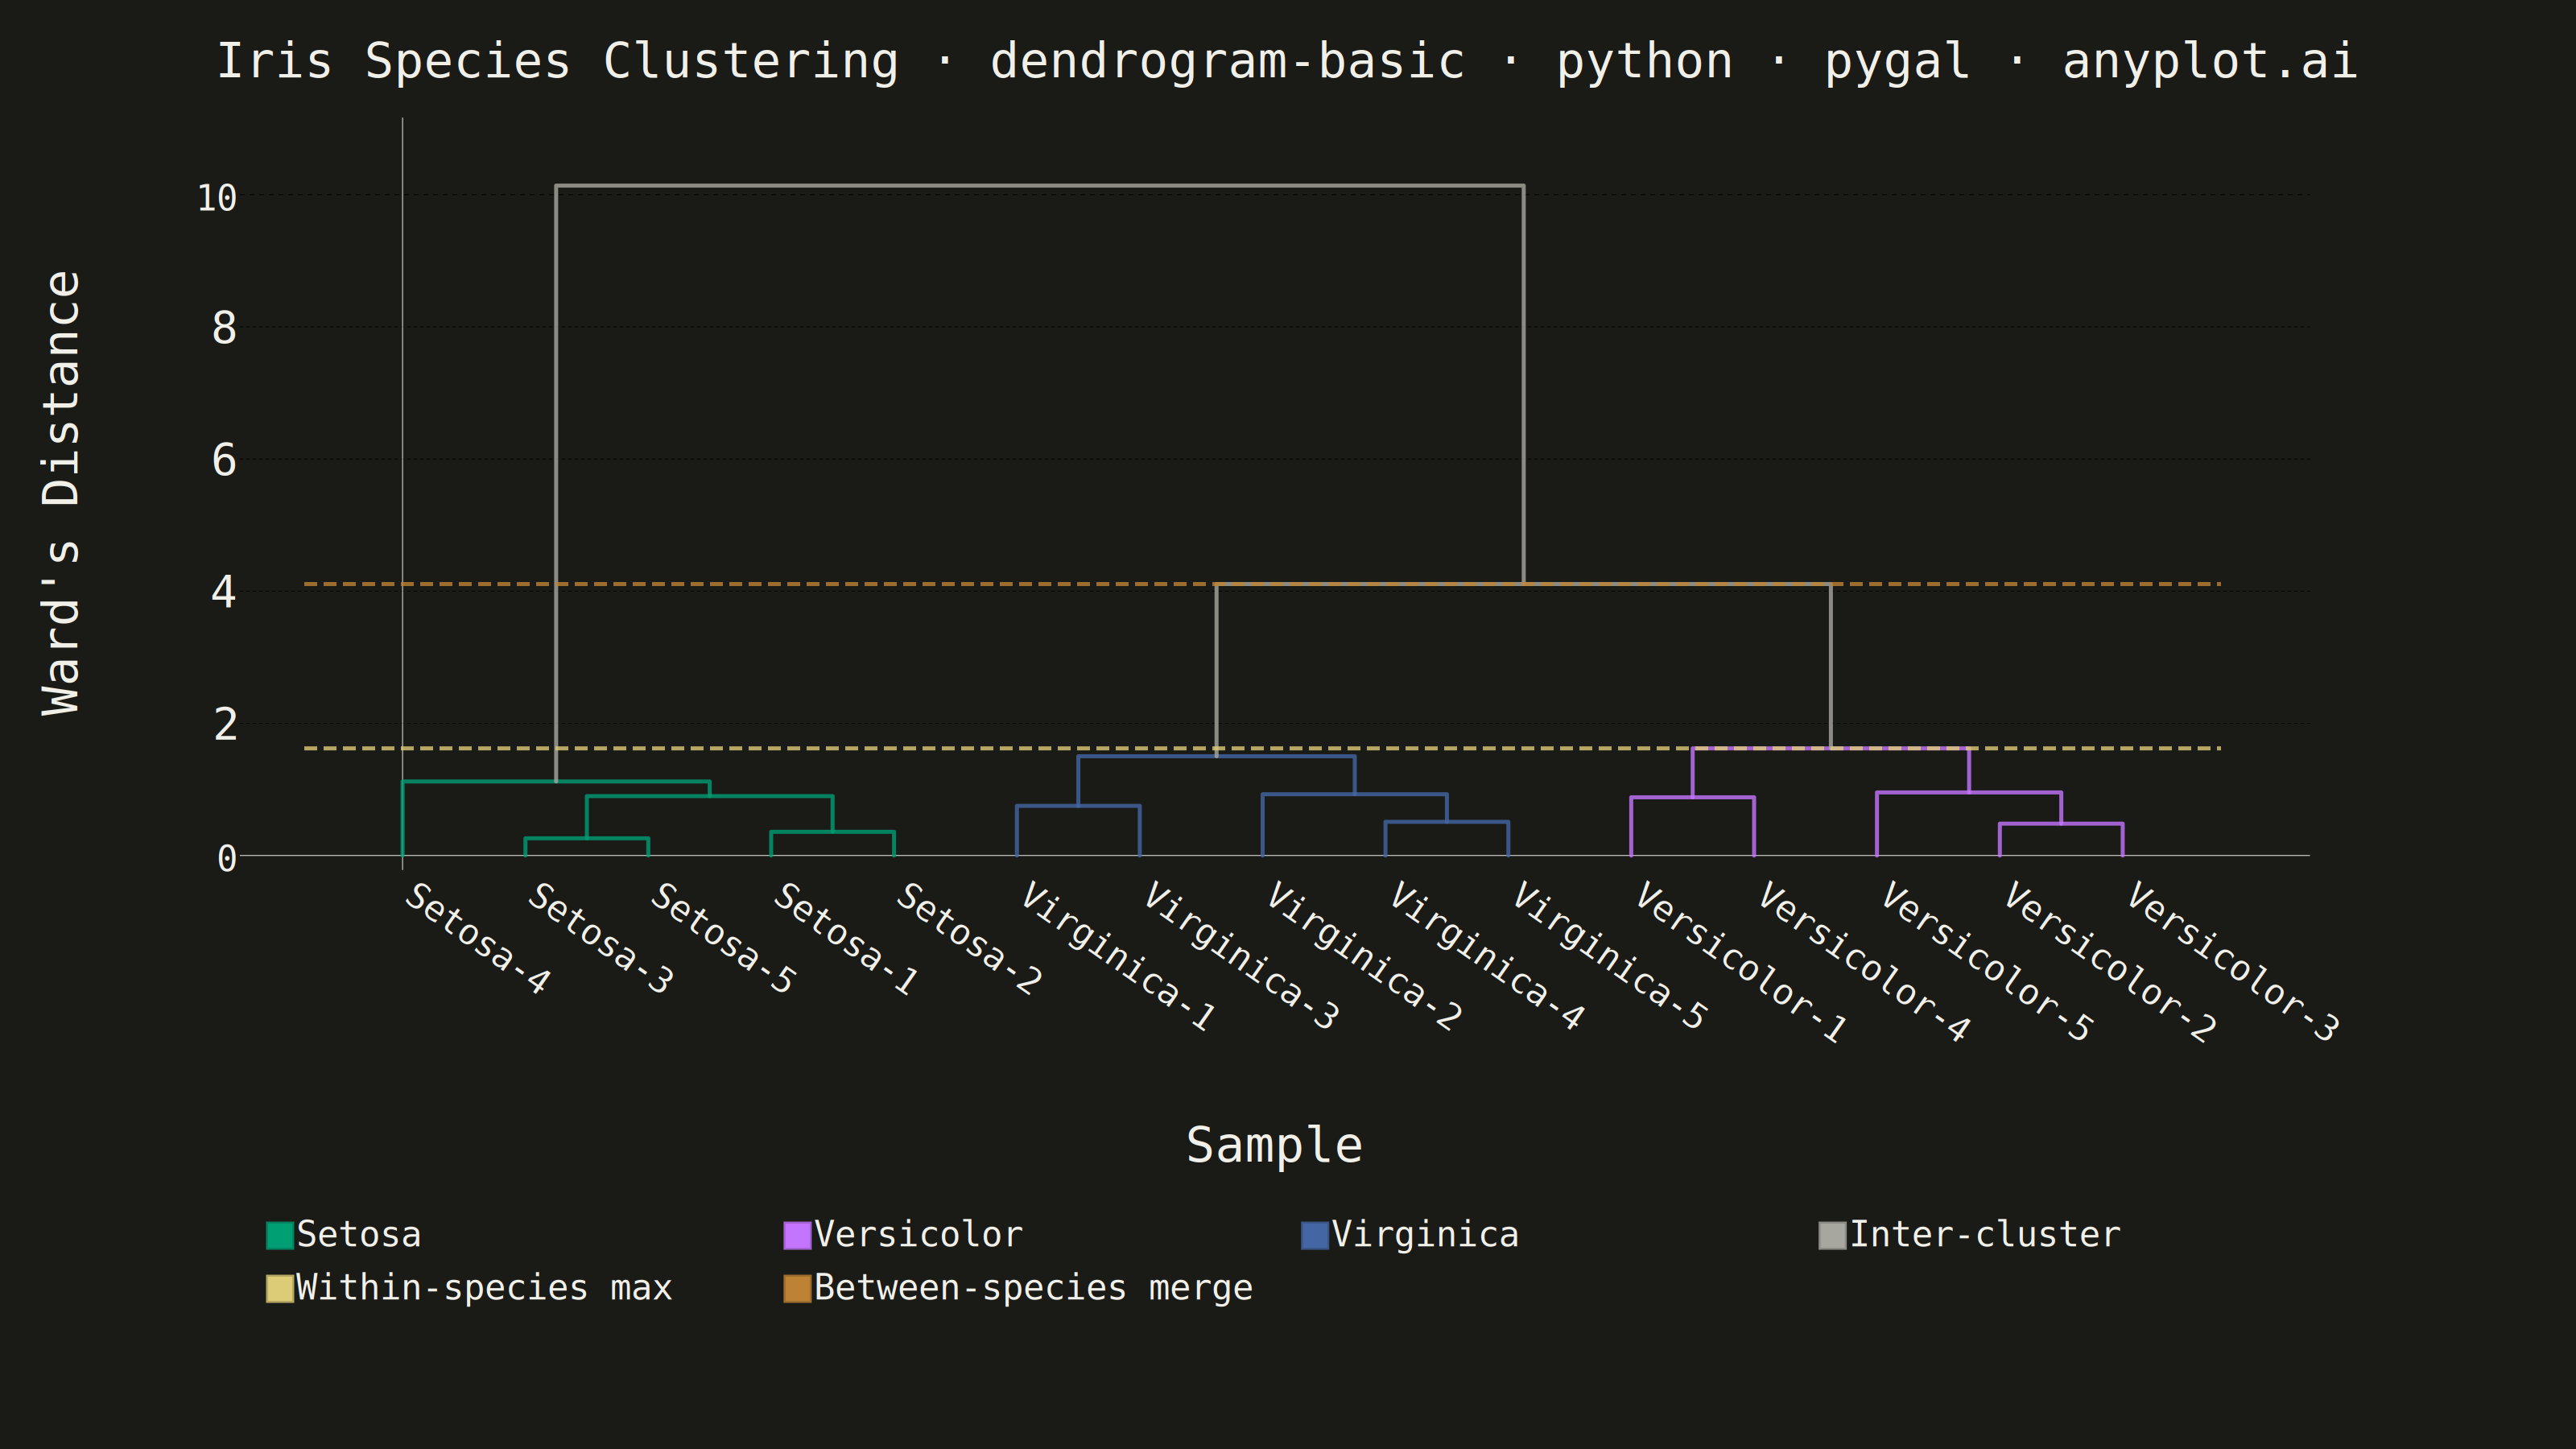
A dendrogram visualizes hierarchical clustering by showing how data points or clusters merge at different distance levels. The tree-like structure reveals relationships and similarity between items, with branch heights indicating the distance at which clusters merge. This visualization is essential for understanding the hierarchical structure in data and identifying natural groupings.
""" anyplot.ai
dendrogram-basic: Basic Dendrogram
Library: pygal 3.1.0 | Python 3.13.13
Quality: 88/100 | Updated: 2026-06-18
"""

import os
import sys


# Prevent this file (pygal.py) from shadowing the installed pygal package
_here = os.path.dirname(os.path.realpath(__file__))
sys.path = [p for p in sys.path if os.path.realpath(p) != _here]
os.chdir(_here)

import numpy as np
import pygal
from pygal.style import Style
from scipy.cluster.hierarchy import fcluster, linkage


# Theme tokens — Imprint palette chrome
THEME = os.getenv("ANYPLOT_THEME", "light")
PAGE_BG = "#FAF8F1" if THEME == "light" else "#1A1A17"
INK = "#1A1A17" if THEME == "light" else "#F0EFE8"
INK_SOFT = "#4A4A44" if THEME == "light" else "#B8B7B0"
INK_MUTED = "#6B6A63" if THEME == "light" else "#A8A79F"
ANYPLOT_AMBER = "#DDCC77"

# Imprint categorical palette — first series is always #009E73
IMPRINT_PALETTE = ("#009E73", "#C475FD", "#4467A3", "#BD8233", "#AE3030", "#2ABCCD", "#954477", "#99B314")

# Data - Iris flower measurements (4 features for 15 samples)
np.random.seed(42)
samples_per_species = 5

labels = []
measurements = []

# Setosa: shorter petals, wider sepals
for i in range(samples_per_species):
    labels.append(f"Setosa-{i + 1}")
    measurements.append(
        [
            5.0 + np.random.randn() * 0.35,
            3.4 + np.random.randn() * 0.35,
            1.5 + np.random.randn() * 0.25,
            0.3 + np.random.randn() * 0.12,
        ]
    )

# Versicolor: medium measurements
for i in range(samples_per_species):
    labels.append(f"Versicolor-{i + 1}")
    measurements.append(
        [
            5.9 + np.random.randn() * 0.5,
            2.8 + np.random.randn() * 0.35,
            4.3 + np.random.randn() * 0.5,
            1.3 + np.random.randn() * 0.25,
        ]
    )

# Virginica: longer petals and sepals
for i in range(samples_per_species):
    labels.append(f"Virginica-{i + 1}")
    measurements.append(
        [
            6.6 + np.random.randn() * 0.55,
            3.0 + np.random.randn() * 0.35,
            5.5 + np.random.randn() * 0.55,
            2.0 + np.random.randn() * 0.3,
        ]
    )

measurements = np.array(measurements)

# Compute hierarchical clustering
linkage_matrix = linkage(measurements, method="ward")
n = len(labels)

# Assign cluster colors - cut at 3 clusters matching species
cluster_ids = fcluster(linkage_matrix, t=3, criterion="maxclust")

# Build leaf ordering from linkage (iterative traversal)
leaf_order = []
stack = [2 * n - 2]
while stack:
    node_id = stack.pop()
    if node_id < n:
        leaf_order.append(node_id)
    else:
        idx = node_id - n
        left = int(linkage_matrix[idx, 0])
        right = int(linkage_matrix[idx, 1])
        stack.append(right)
        stack.append(left)

# Compute node positions and determine cluster membership for coloring
node_x = {}
node_height = {}
node_cluster = {}

for pos, leaf_id in enumerate(leaf_order):
    node_x[leaf_id] = pos
    node_height[leaf_id] = 0
    node_cluster[leaf_id] = cluster_ids[leaf_id]

# Map cluster IDs to species names
cluster_species = {}
for leaf_id in range(n):
    cid = cluster_ids[leaf_id]
    species = labels[leaf_id].rsplit("-", 1)[0]
    cluster_species[cid] = species

# Species colors from Imprint palette (positions 1-3)
species_colors = {
    "Setosa": IMPRINT_PALETTE[0],  # #009E73 brand green
    "Versicolor": IMPRINT_PALETTE[1],  # #C475FD lavender
    "Virginica": IMPRINT_PALETTE[2],  # #4467A3 blue
}
mixed_color = INK_MUTED  # theme-adaptive for inter-cluster merges

# Build U-shape series with color and distance metadata
u_shapes = []
max_dist = linkage_matrix[:, 2].max()

for idx in range(len(linkage_matrix)):
    left = int(linkage_matrix[idx, 0])
    right = int(linkage_matrix[idx, 1])
    dist = linkage_matrix[idx, 2]
    new_node = n + idx

    x_left = node_x[left]
    x_right = node_x[right]
    node_x[new_node] = (x_left + x_right) / 2
    node_height[new_node] = dist

    h_left = node_height[left]
    h_right = node_height[right]

    cl = node_cluster[left]
    cr = node_cluster[right]
    if cl == cr:
        node_cluster[new_node] = cl
        color = species_colors.get(cluster_species.get(cl, ""), mixed_color)
    else:
        node_cluster[new_node] = -1
        color = mixed_color

    # Stroke width scales with merge distance — minimum 5 ensures lower branches stay visible
    stroke_w = 5 + 8 * (dist / max_dist)

    u_shapes.append((color, stroke_w, dist, [(x_left, h_left), (x_left, dist), (x_right, dist), (x_right, h_right)]))

# Ordered labels for x-axis
ordered_labels = [labels[i] for i in leaf_order]

# Title with length-scaled fontsize
title = "Iris Species Clustering · dendrogram-basic · python · pygal · anyplot.ai"
title_len = len(title)
title_fontsize = round(66 * 67 / title_len) if title_len > 67 else 66

# Extended color tuple: U-shape colors + reference line colors (amber + ink)
u_shape_colors = tuple(color for color, _, _, _ in u_shapes)
BETWEEN_SPECIES_COLOR = IMPRINT_PALETTE[3]  # #BD8233 ochre — distinct from gray inter-cluster bridge
all_series_colors = u_shape_colors + (ANYPLOT_AMBER, BETWEEN_SPECIES_COLOR)

# Style — Imprint palette, theme-adaptive chrome
custom_style = Style(
    background=PAGE_BG,
    plot_background=PAGE_BG,
    foreground=INK,
    foreground_strong=INK,
    foreground_subtle=INK_MUTED,
    colors=all_series_colors,
    title_font_size=title_fontsize,
    label_font_size=56,
    major_label_font_size=44,
    legend_font_size=44,
    value_font_size=36,
    stroke_width=5,
    opacity=1.0,
)

# Chart — pygal XY configured as dendrogram (3200×1800 landscape)
chart = pygal.XY(
    width=3200,
    height=1800,
    style=custom_style,
    title=title,
    x_title="Sample",
    y_title="Ward's Distance",
    show_legend=True,
    show_dots=False,
    fill=False,
    show_x_guides=False,
    show_y_guides=True,
    show_minor_x_labels=False,
    x_label_rotation=35,
    truncate_label=30,
    xrange=(-1.0, n + 0.2),
    range=(0, max_dist * 1.08),
    margin_top=50,
    margin_bottom=80,
    margin_left=100,
    margin_right=80,
    legend_at_bottom=True,
    legend_box_size=30,
    tooltip_border_radius=10,
    print_values=False,
    spacing=35,
    js=[],
)

# Custom x-axis labels at leaf positions
chart.x_labels = list(range(n))
chart.x_labels_major = list(range(n))
chart.x_value_formatter = lambda x: ordered_labels[int(round(x))] if 0 <= round(x) < n else ""

# Y-axis: formatted distances
y_max_nice = int(np.ceil(max_dist))
step = 1 if y_max_nice <= 6 else 2
chart.y_labels = [{"value": v, "label": f"{v:.0f}"} for v in range(0, y_max_nice + 1, step)]

# Draw dendrogram — each U-shape as its own series
color_to_species = {v: k for k, v in species_colors.items()}
color_to_species[mixed_color] = "Inter-cluster"

named_colors = set()
for color, stroke_w, dist, points in u_shapes:
    if color not in named_colors:
        series_name = color_to_species.get(color, "Other")
        named_colors.add(color)
    else:
        series_name = None

    chart.add(
        series_name,
        [{"value": p, "label": f"d={dist:.2f}"} for p in points],
        show_dots=False,
        stroke_style={"width": stroke_w, "linecap": "round", "linejoin": "round"},
        allow_interruptions=False,
    )

# Reference lines for key distance thresholds — amber color, clearly visible
key_merges = sorted(linkage_matrix[:, 2])
within_cluster_max = key_merges[n - 4]
between_cluster = key_merges[-2]

for ref_dist, ref_label in [(within_cluster_max, "Within-species max"), (between_cluster, "Between-species merge")]:
    chart.add(
        ref_label,
        [(-0.8, ref_dist), (n - 0.2, ref_dist)],
        show_dots=False,
        stroke_style={"width": 4, "dasharray": "16, 8", "linecap": "butt"},
    )

# Save — both PNG and interactive HTML
chart.render_to_file(f"plot-{THEME}.html")
chart.render_to_png(f"plot-{THEME}.png")
Runnable source as JSON, for any HTTP client: https://api.anyplot.ai/specs/dendrogram-basic/pygal/code. Any spec id and library id listed in llms-full.txt fit the same URL shape; every URL below is complete and callable.
{
  "spec_id": "dendrogram-basic",
  "language": "python",
  "library": "pygal",
  "page": "https://anyplot.ai/dendrogram-basic/python/pygal",
  "hub": "https://anyplot.ai/dendrogram-basic",
  "code_json": "https://api.anyplot.ai/specs/dendrogram-basic/pygal/code",
  "spec_json": "https://api.anyplot.ai/specs/dendrogram-basic",
  "render_light_png": "https://storage.googleapis.com/anyplot-images/plots/dendrogram-basic/python/pygal/plot-light.png",
  "render_dark_png": "https://storage.googleapis.com/anyplot-images/plots/dendrogram-basic/python/pygal/plot-dark.png",
  "interactive_light_html": "https://storage.googleapis.com/anyplot-images/plots/dendrogram-basic/python/pygal/plot-light.html",
  "interactive_dark_html": "https://storage.googleapis.com/anyplot-images/plots/dendrogram-basic/python/pygal/plot-dark.html",
  "quality_score": 88.0,
  "license": "MIT",
  "guide": "https://anyplot.ai/llms.txt"
}
Part of Basic Dendrogram on anyplot.ai.