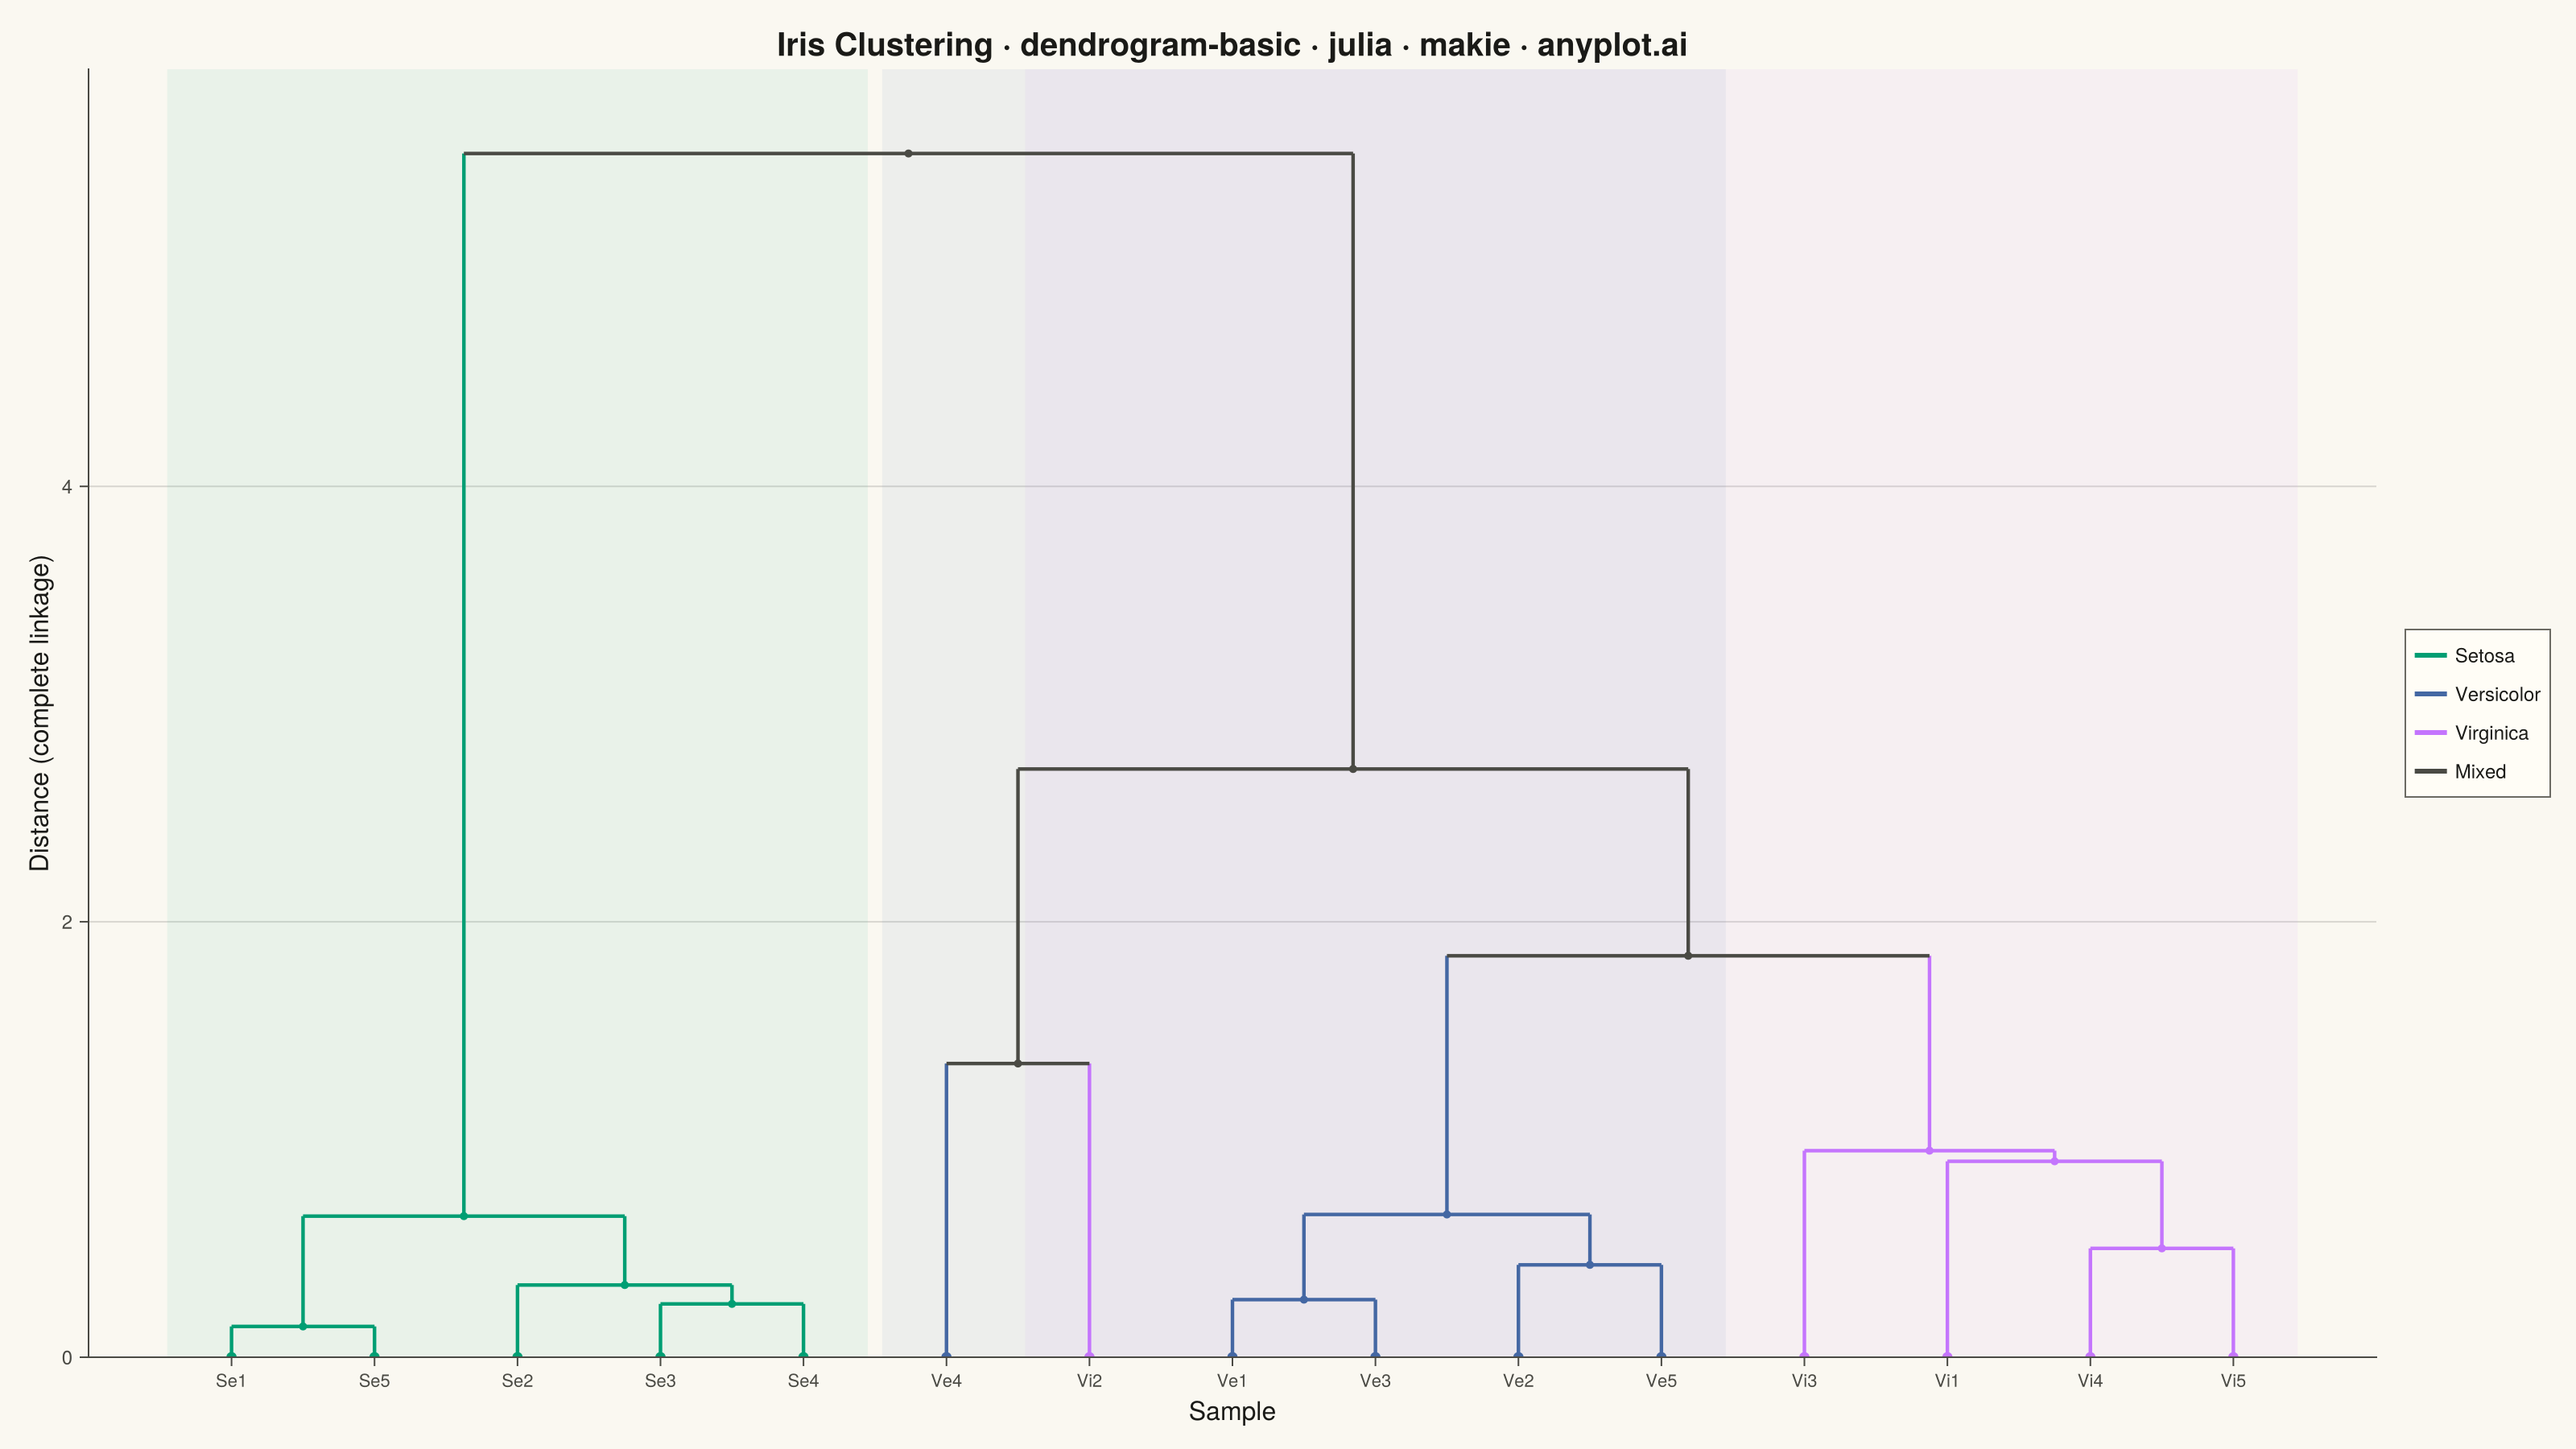
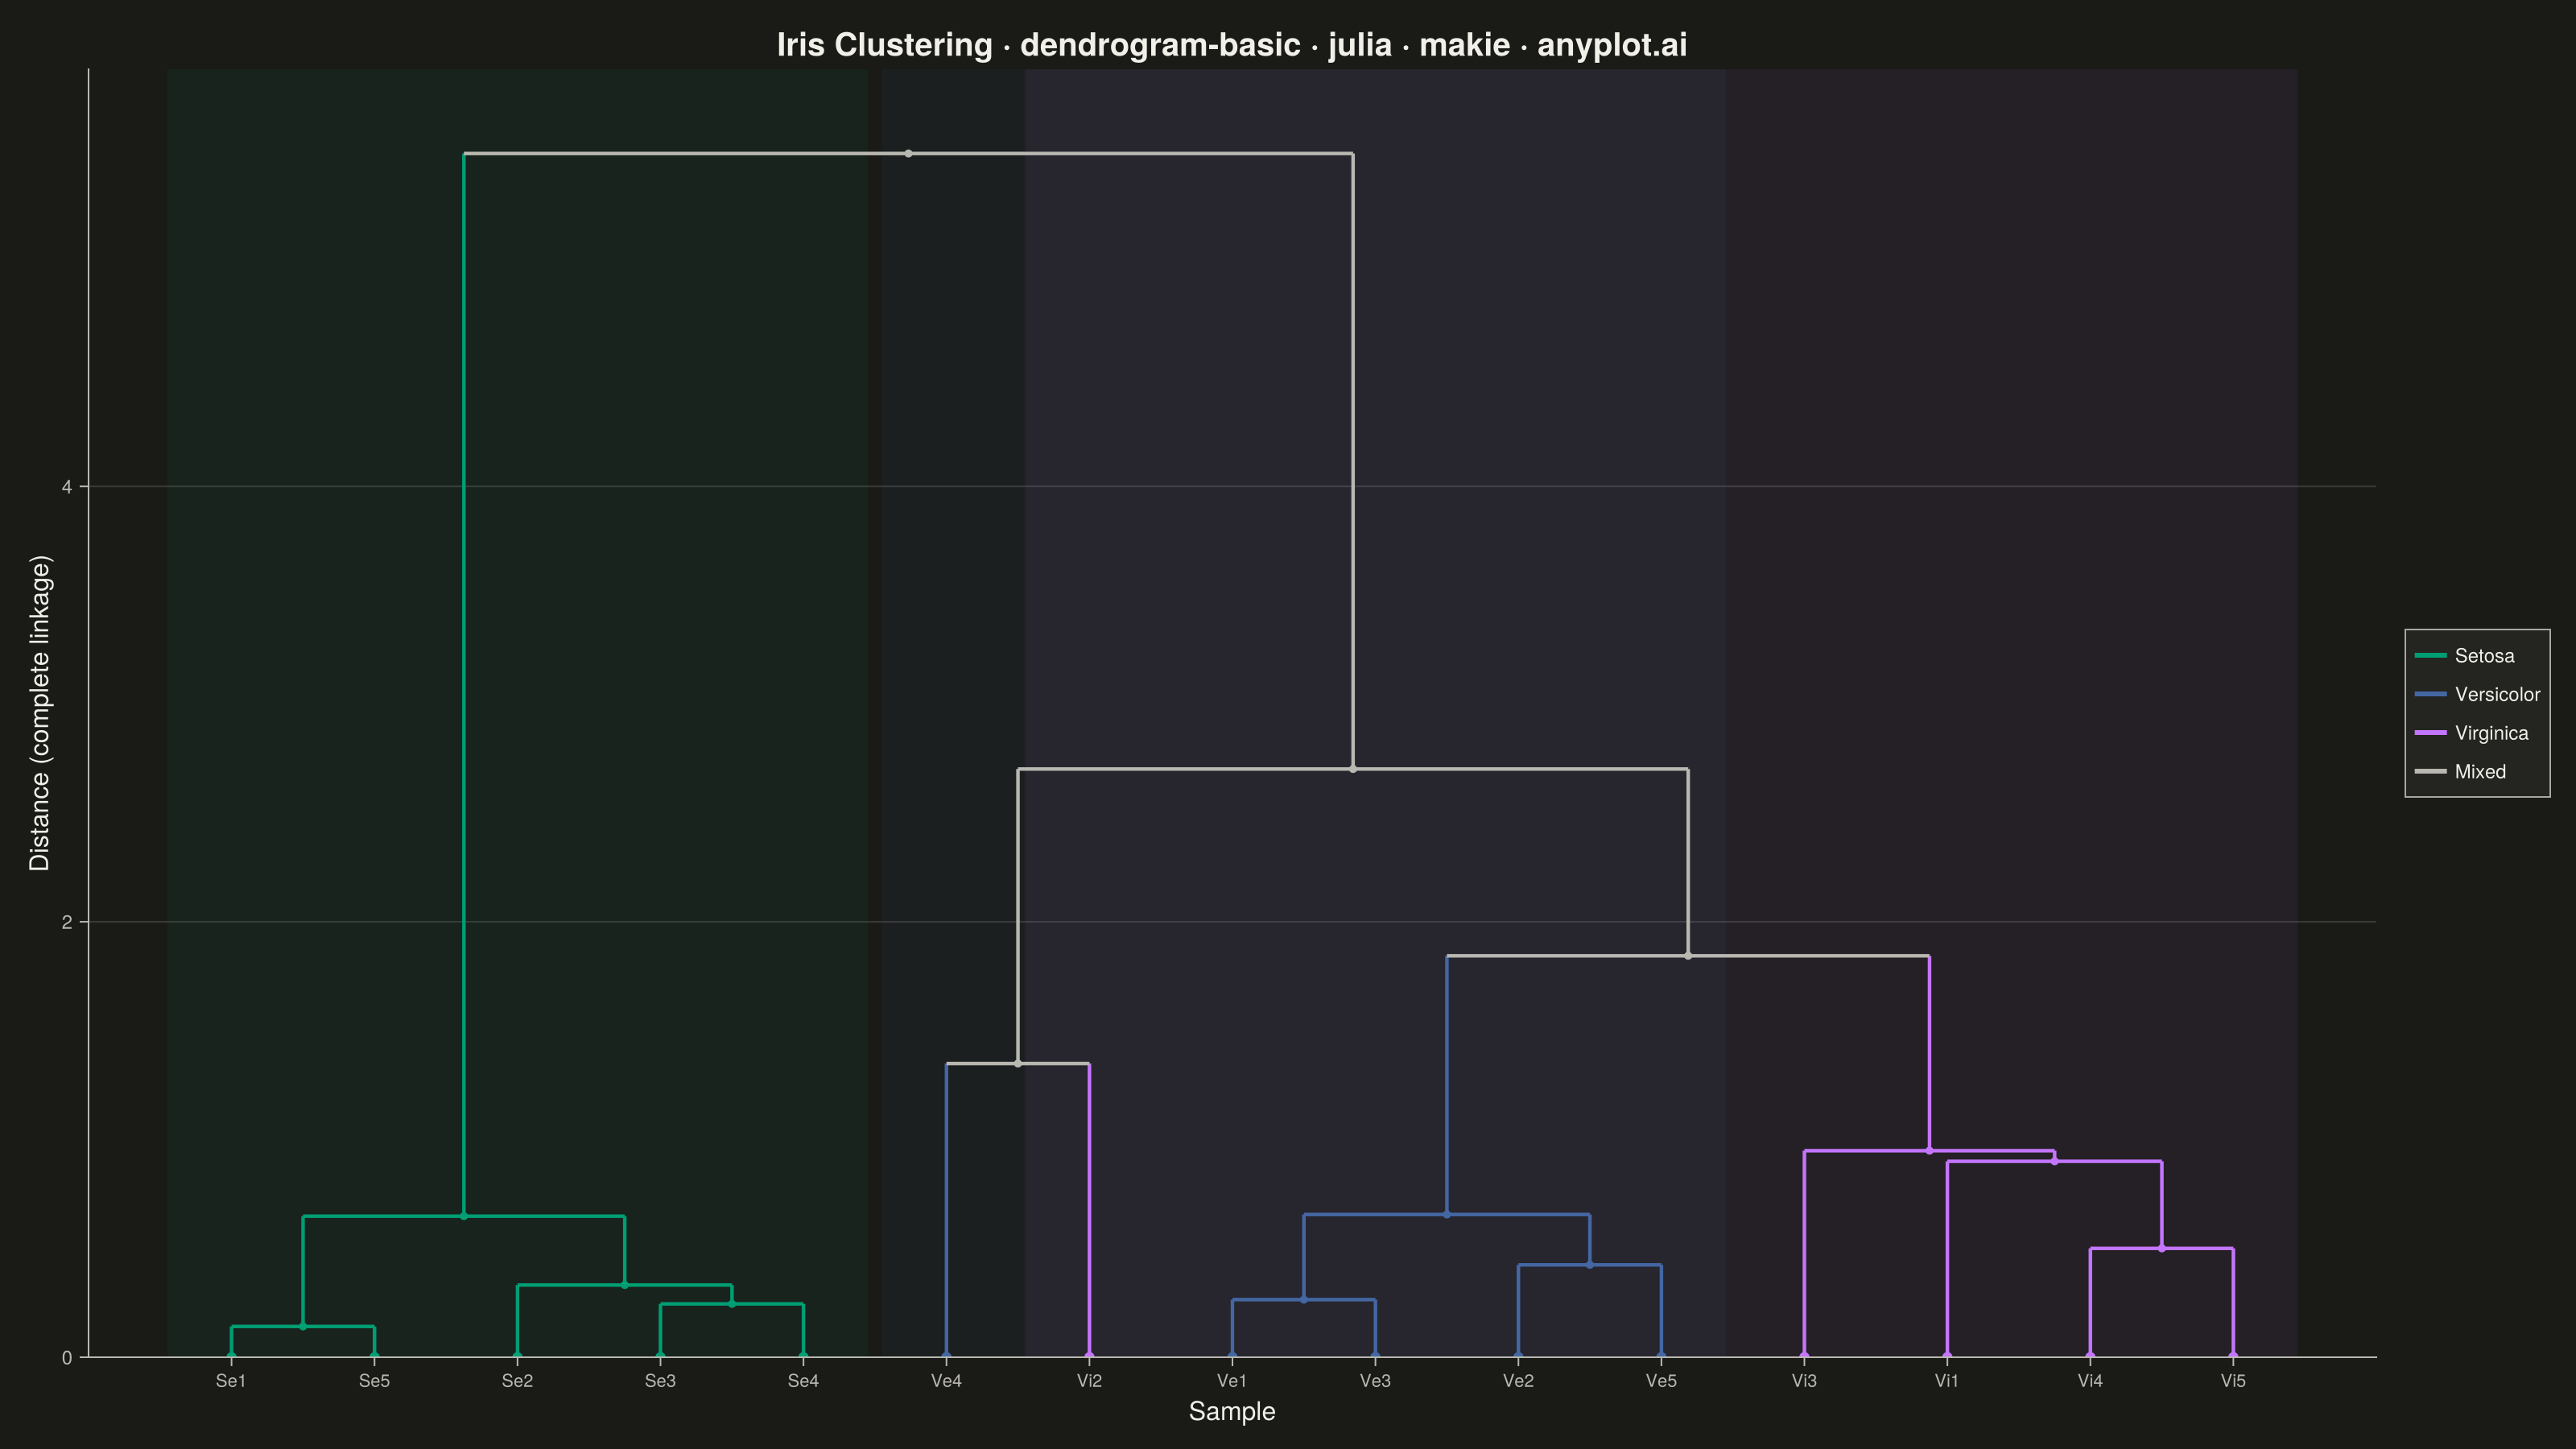
A dendrogram visualizes hierarchical clustering by showing how data points or clusters merge at different distance levels. The tree-like structure reveals relationships and similarity between items, with branch heights indicating the distance at which clusters merge. This visualization is essential for understanding the hierarchical structure in data and identifying natural groupings.
# anyplot.ai
# dendrogram-basic: Basic Dendrogram
# Library: makie 0.22.10 | Julia 1.11.9
# Quality: 89/100 | Created: 2026-06-18

using CairoMakie
using Colors
using Random
using RDatasets

Random.seed!(42)

# Theme tokens
const THEME       = get(ENV, "ANYPLOT_THEME", "light")
const PAGE_BG     = THEME == "light" ? colorant"#FAF8F1" : colorant"#1A1A17"
const ELEVATED_BG = THEME == "light" ? colorant"#FFFDF6" : colorant"#242420"
const INK         = THEME == "light" ? colorant"#1A1A17" : colorant"#F0EFE8"
const INK_SOFT    = THEME == "light" ? colorant"#4A4A44" : colorant"#B8B7B0"
const INK_MUTED   = THEME == "light" ? colorant"#6B6A63" : colorant"#A8A79F"

const IMPRINT_PALETTE = [
    colorant"#009E73",  # 1 — brand green (Setosa)
    colorant"#C475FD",  # 2 — lavender (Virginica)
    colorant"#4467A3",  # 3 — blue (Versicolor)
    colorant"#BD8233",  # 4 — ochre
    colorant"#AE3030",  # 5 — matte red
    colorant"#2ABCCD",  # 6 — cyan
    colorant"#954477",  # 7 — rose
    colorant"#99B314",  # 8 — lime
]

# Data: 5 samples from each iris species → 15 leaf nodes
iris_data = dataset("datasets", "iris")
sample_idx = vcat(1:5, 51:55, 101:105)
features = Matrix{Float64}(iris_data[sample_idx, 1:4])
species_vec = string.(iris_data[sample_idx, :Species])
n = size(features, 1)

sp_color = Dict(
    "setosa"     => IMPRINT_PALETTE[1],
    "versicolor" => IMPRINT_PALETTE[3],
    "virginica"  => IMPRINT_PALETTE[2],
)
sp_prefix = Dict("setosa" => "Se", "versicolor" => "Ve", "virginica" => "Vi")
sp_count  = Dict("setosa" => 0, "versicolor" => 0, "virginica" => 0)
leaf_labels = String[]
for i in 1:n
    sp = species_vec[i]
    sp_count[sp] += 1
    push!(leaf_labels, "$(sp_prefix[sp])$(sp_count[sp])")
end

# Pairwise Euclidean distances
D = [sqrt(sum((features[i, :] .- features[j, :]).^2)) for i in 1:n, j in 1:n]

# Complete-linkage agglomerative clustering
members = [[i] for i in 1:n]
active  = collect(1:n)
merges  = Tuple{Int,Int,Float64}[]

while length(active) > 1
    best_d, best_ai, best_bi = Inf, 1, 2
    for ai in 1:length(active), bi in (ai + 1):length(active)
        d = maximum(D[p, q] for p in members[active[ai]] for q in members[active[bi]])
        d < best_d && ((best_d, best_ai, best_bi) = (d, ai, bi))
    end
    ca, cb = active[best_ai], active[best_bi]
    push!(merges, (ca, cb, best_d))
    push!(members, vcat(members[ca], members[cb]))
    deleteat!(active, sort([best_ai, best_bi]))
    push!(active, length(members))
end

n_merges = length(merges)

# Build children map and DFS leaf order
node_children = Dict{Int,Tuple{Int,Int}}(n + i => (ca, cb) for (i, (ca, cb, _)) in enumerate(merges))

stack      = [n + n_merges]
leaf_order = Int[]
while !isempty(stack)
    node = pop!(stack)
    if node <= n
        push!(leaf_order, node)
    else
        ca, cb = node_children[node]
        push!(stack, cb)
        push!(stack, ca)
    end
end

# Node x-positions (leaves at integer positions 1..n; internals at midpoints)
node_x = zeros(n + n_merges)
for (pos, leaf_id) in enumerate(leaf_order)
    node_x[leaf_id] = Float64(pos)
end
for (i, (ca, cb, _)) in enumerate(merges)
    node_x[n + i] = (node_x[ca] + node_x[cb]) / 2
end

# Node y-positions (merge height; leaves at 0)
node_y = zeros(n + n_merges)
for (i, (_, _, h)) in enumerate(merges)
    node_y[n + i] = h
end

# Node colors: pure-species cluster → species color; mixed → INK_SOFT
node_colors = fill(INK_SOFT, n + n_merges)
for i in 1:n
    node_colors[i] = sp_color[species_vec[i]]
end
for (i, _) in enumerate(merges)
    new_id = n + i
    sp_set = Set(species_vec[l] for l in members[new_id])
    length(sp_set) == 1 && (node_colors[new_id] = sp_color[only(sp_set)])
end

ordered_labels = [leaf_labels[leaf_order[pos]] for pos in 1:n]
max_height     = maximum(h for (_, _, h) in merges)

# Species leaf position spans for vspan! background bands
species_spans = Dict{String, Tuple{Float64,Float64}}()
for sp in keys(sp_color)
    positions = [Float64(pos) for (pos, lid) in enumerate(leaf_order) if species_vec[lid] == sp]
    isempty(positions) || (species_spans[sp] = (minimum(positions) - 0.45, maximum(positions) + 0.45))
end

# Figure
title_str = "Iris Clustering · dendrogram-basic · julia · makie · anyplot.ai"
n_title   = length(title_str)
title_fs  = n_title > 67 ? round(Int, 20 * 67 / n_title) : 20

fig = Figure(
    size            = (1600, 900),
    fontsize        = 14,
    backgroundcolor = PAGE_BG,
)

ax = Axis(
    fig[1, 1];
    title              = title_str,
    titlesize          = title_fs,
    titlecolor         = INK,
    xlabel             = "Sample",
    ylabel             = "Distance (complete linkage)",
    xlabelsize         = 16,
    ylabelsize         = 16,
    xlabelcolor        = INK,
    ylabelcolor        = INK,
    xticks             = (collect(1:n), ordered_labels),
    xticklabelsize     = 11,
    yticklabelsize     = 12,
    xticklabelcolor    = INK_SOFT,
    yticklabelcolor    = INK_SOFT,
    xtickcolor         = INK_SOFT,
    ytickcolor         = INK_SOFT,
    backgroundcolor    = PAGE_BG,
    topspinevisible    = false,
    rightspinevisible  = false,
    leftspinecolor     = INK_SOFT,
    bottomspinecolor   = INK_SOFT,
    xgridvisible       = false,
    ygridcolor         = RGBAf(INK.r, INK.g, INK.b, 0.15f0),
)

# Species background bands — vspan! is a Makie-specific primitive
for (sp, (lo, hi)) in species_spans
    c = sp_color[sp]
    vspan!(ax, [lo], [hi]; color = RGBAf(Float32(red(c)), Float32(green(c)), Float32(blue(c)), 0.07f0))
end

# Dendrogram branches
for (i, (ca, cb, h)) in enumerate(merges)
    xa, ya = node_x[ca], node_y[ca]
    xb, yb = node_x[cb], node_y[cb]
    lines!(ax, [xa, xa], [ya, h]; color = node_colors[ca], linewidth = 2.2)
    lines!(ax, [xb, xb], [yb, h]; color = node_colors[cb], linewidth = 2.2)
    lines!(ax, [xa, xb], [h, h]; color = node_colors[n + i], linewidth = 2.2)
end

# Leaf node markers — scatter! composing with lines! showcases Makie's geom layering
leaf_x      = [node_x[leaf_order[pos]] for pos in 1:n]
leaf_colors = [node_colors[leaf_order[pos]] for pos in 1:n]
scatter!(ax, leaf_x, zeros(n); color = leaf_colors, markersize = 9, strokewidth = 0)

# Internal merge node markers
merge_x      = [node_x[n + i] for i in 1:n_merges]
merge_y      = [h for (_, _, h) in merges]
merge_colors = [node_colors[n + i] for i in 1:n_merges]
scatter!(ax, merge_x, merge_y; color = merge_colors, markersize = 7, strokewidth = 0)

xlims!(ax, 0.0, Float64(n) + 1.0)
ylims!(ax, 0.0, max_height * 1.07)

# Legend
legend_items = [
    LineElement(color = IMPRINT_PALETTE[1], linewidth = 3),
    LineElement(color = IMPRINT_PALETTE[3], linewidth = 3),
    LineElement(color = IMPRINT_PALETTE[2], linewidth = 3),
    LineElement(color = INK_SOFT, linewidth = 3),
]
Legend(fig[1, 2], legend_items, ["Setosa", "Versicolor", "Virginica", "Mixed"];
    framevisible    = true,
    framecolor      = INK_MUTED,
    backgroundcolor = ELEVATED_BG,
    labelcolor      = INK,
    labelsize       = 12,
    rowgap          = 4,
)

save(joinpath(@__DIR__, "plot-$(THEME).png"), fig; px_per_unit = 2)
Runnable source as JSON, for any HTTP client: https://api.anyplot.ai/specs/dendrogram-basic/makie/code. Any spec id and library id listed in llms-full.txt fit the same URL shape; every URL below is complete and callable.
{
  "spec_id": "dendrogram-basic",
  "language": "julia",
  "library": "makie",
  "page": "https://anyplot.ai/dendrogram-basic/julia/makie",
  "hub": "https://anyplot.ai/dendrogram-basic",
  "code_json": "https://api.anyplot.ai/specs/dendrogram-basic/makie/code",
  "spec_json": "https://api.anyplot.ai/specs/dendrogram-basic",
  "render_light_png": "https://storage.googleapis.com/anyplot-images/plots/dendrogram-basic/julia/makie/plot-light.png",
  "render_dark_png": "https://storage.googleapis.com/anyplot-images/plots/dendrogram-basic/julia/makie/plot-dark.png",
  "quality_score": 89.0,
  "license": "MIT",
  "guide": "https://anyplot.ai/llms.txt"
}
Part of Basic Dendrogram on anyplot.ai.