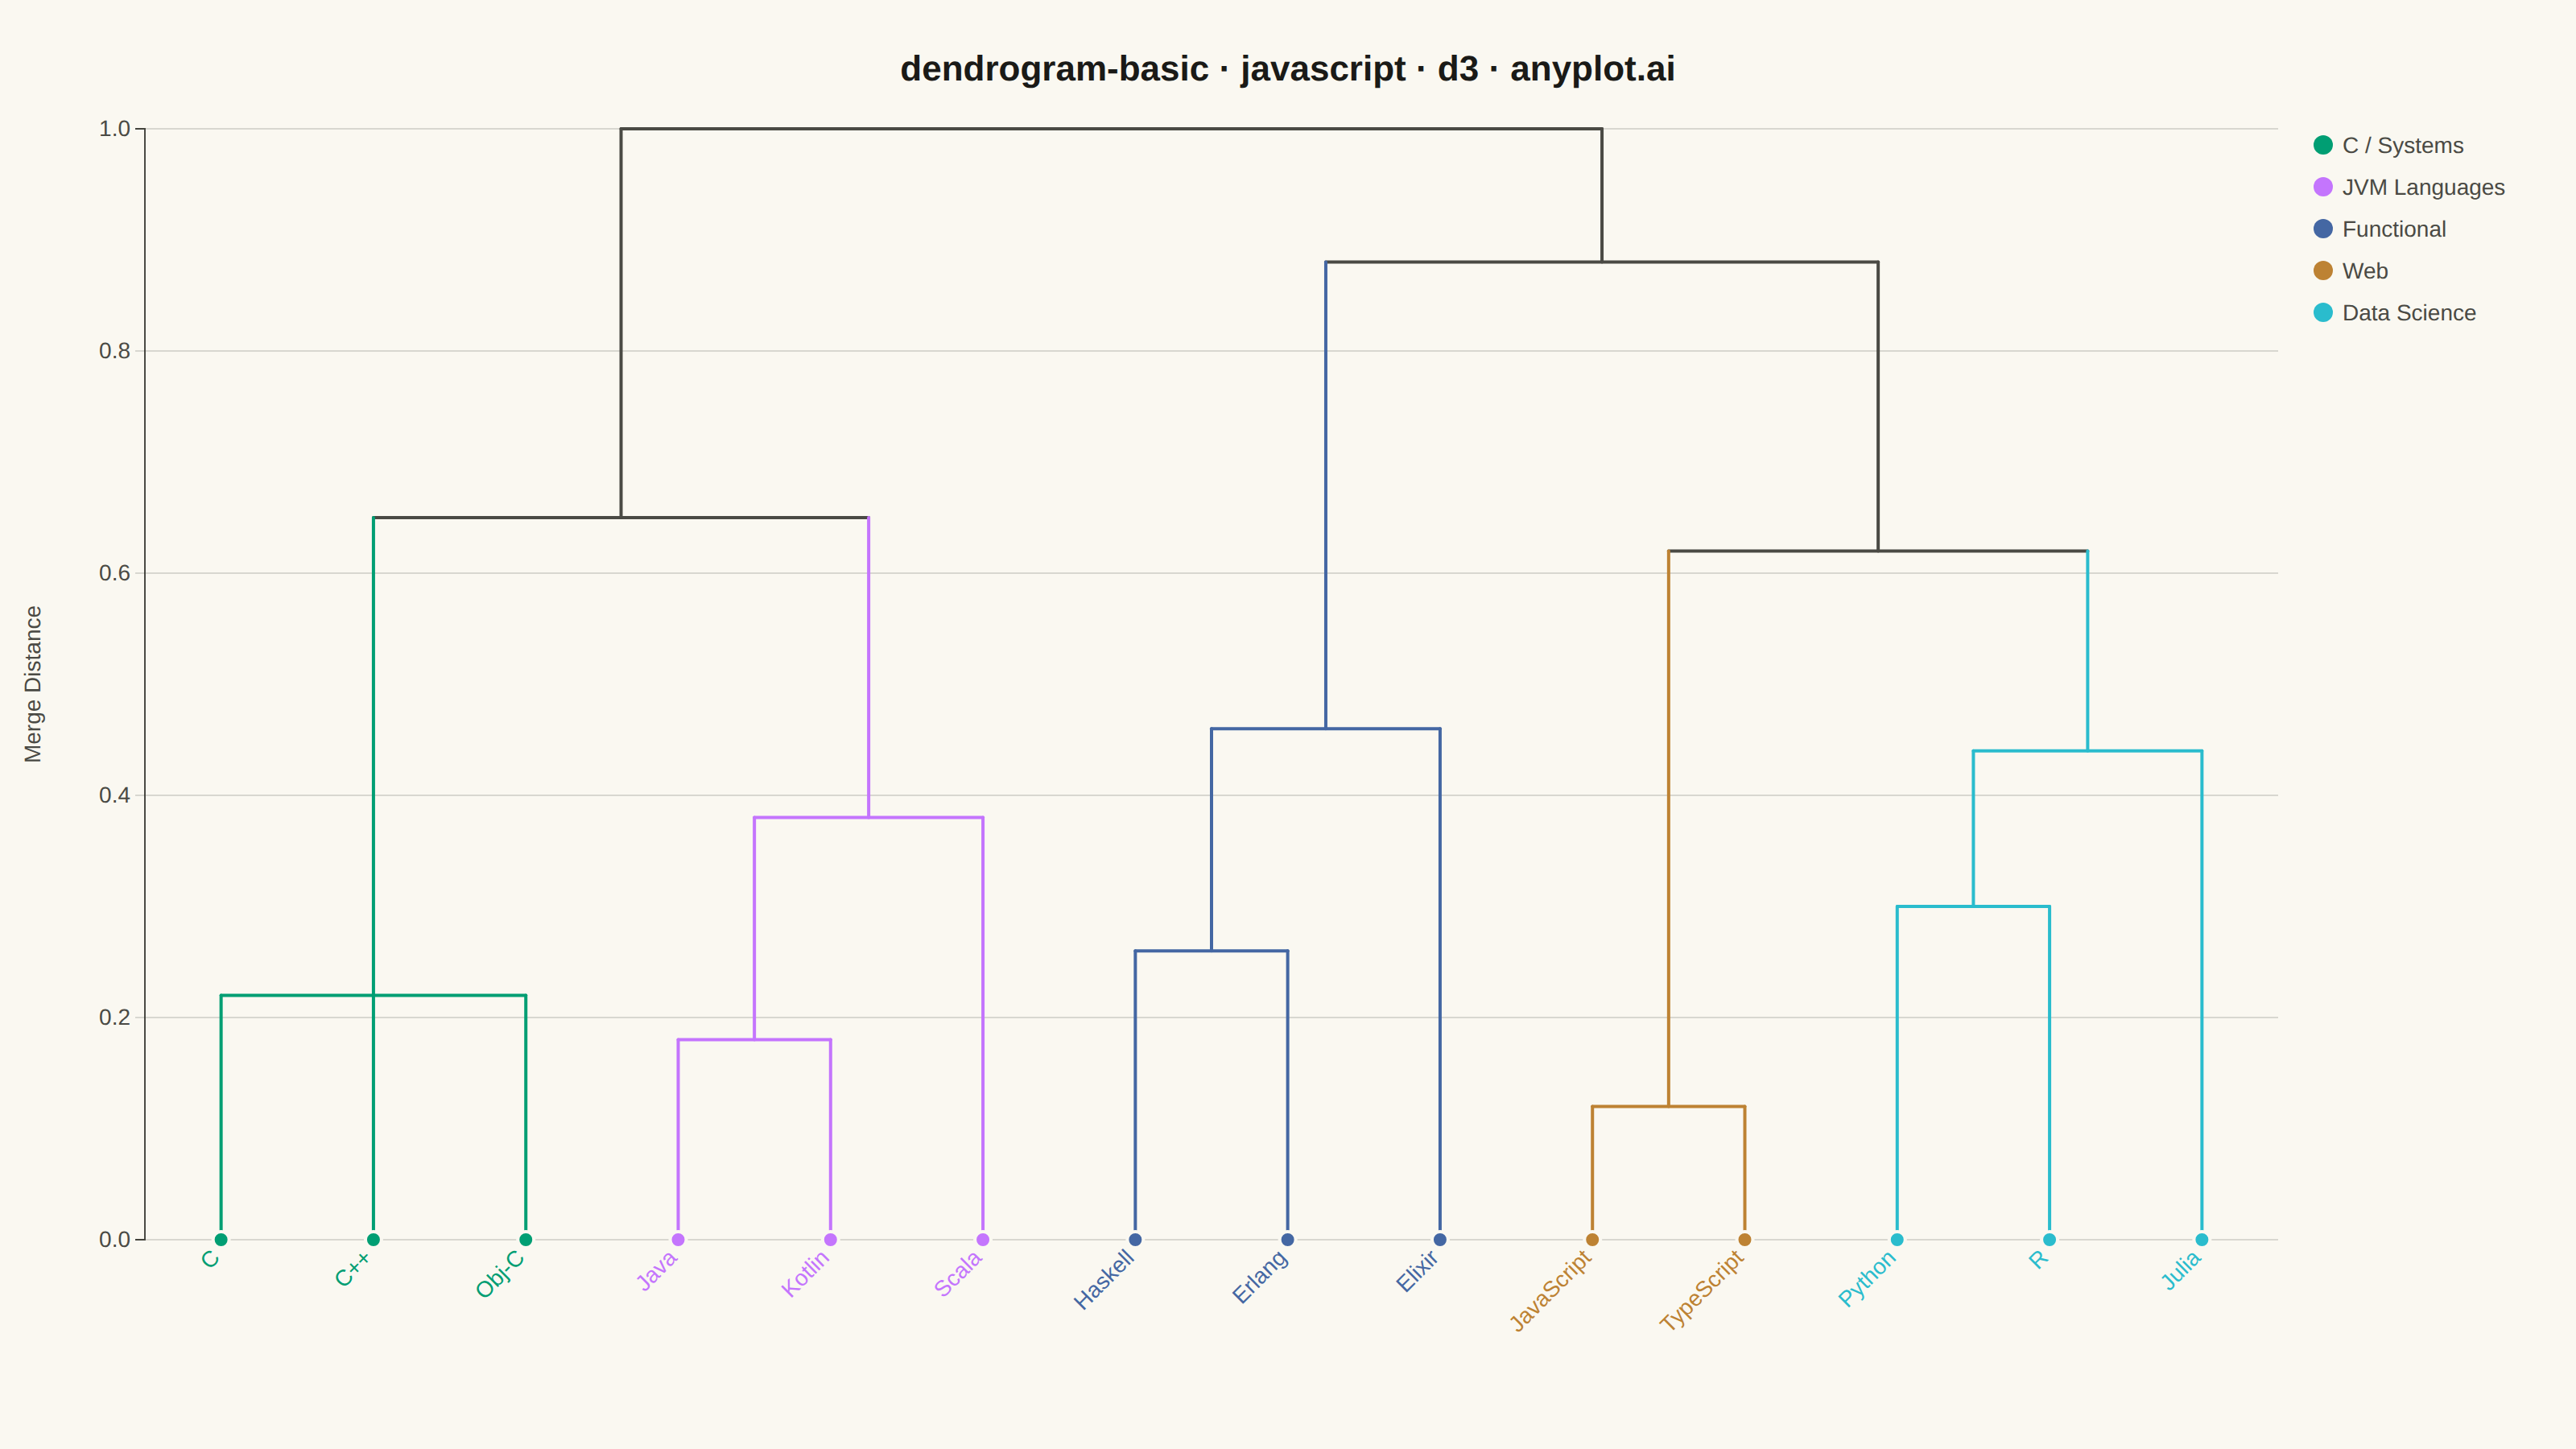
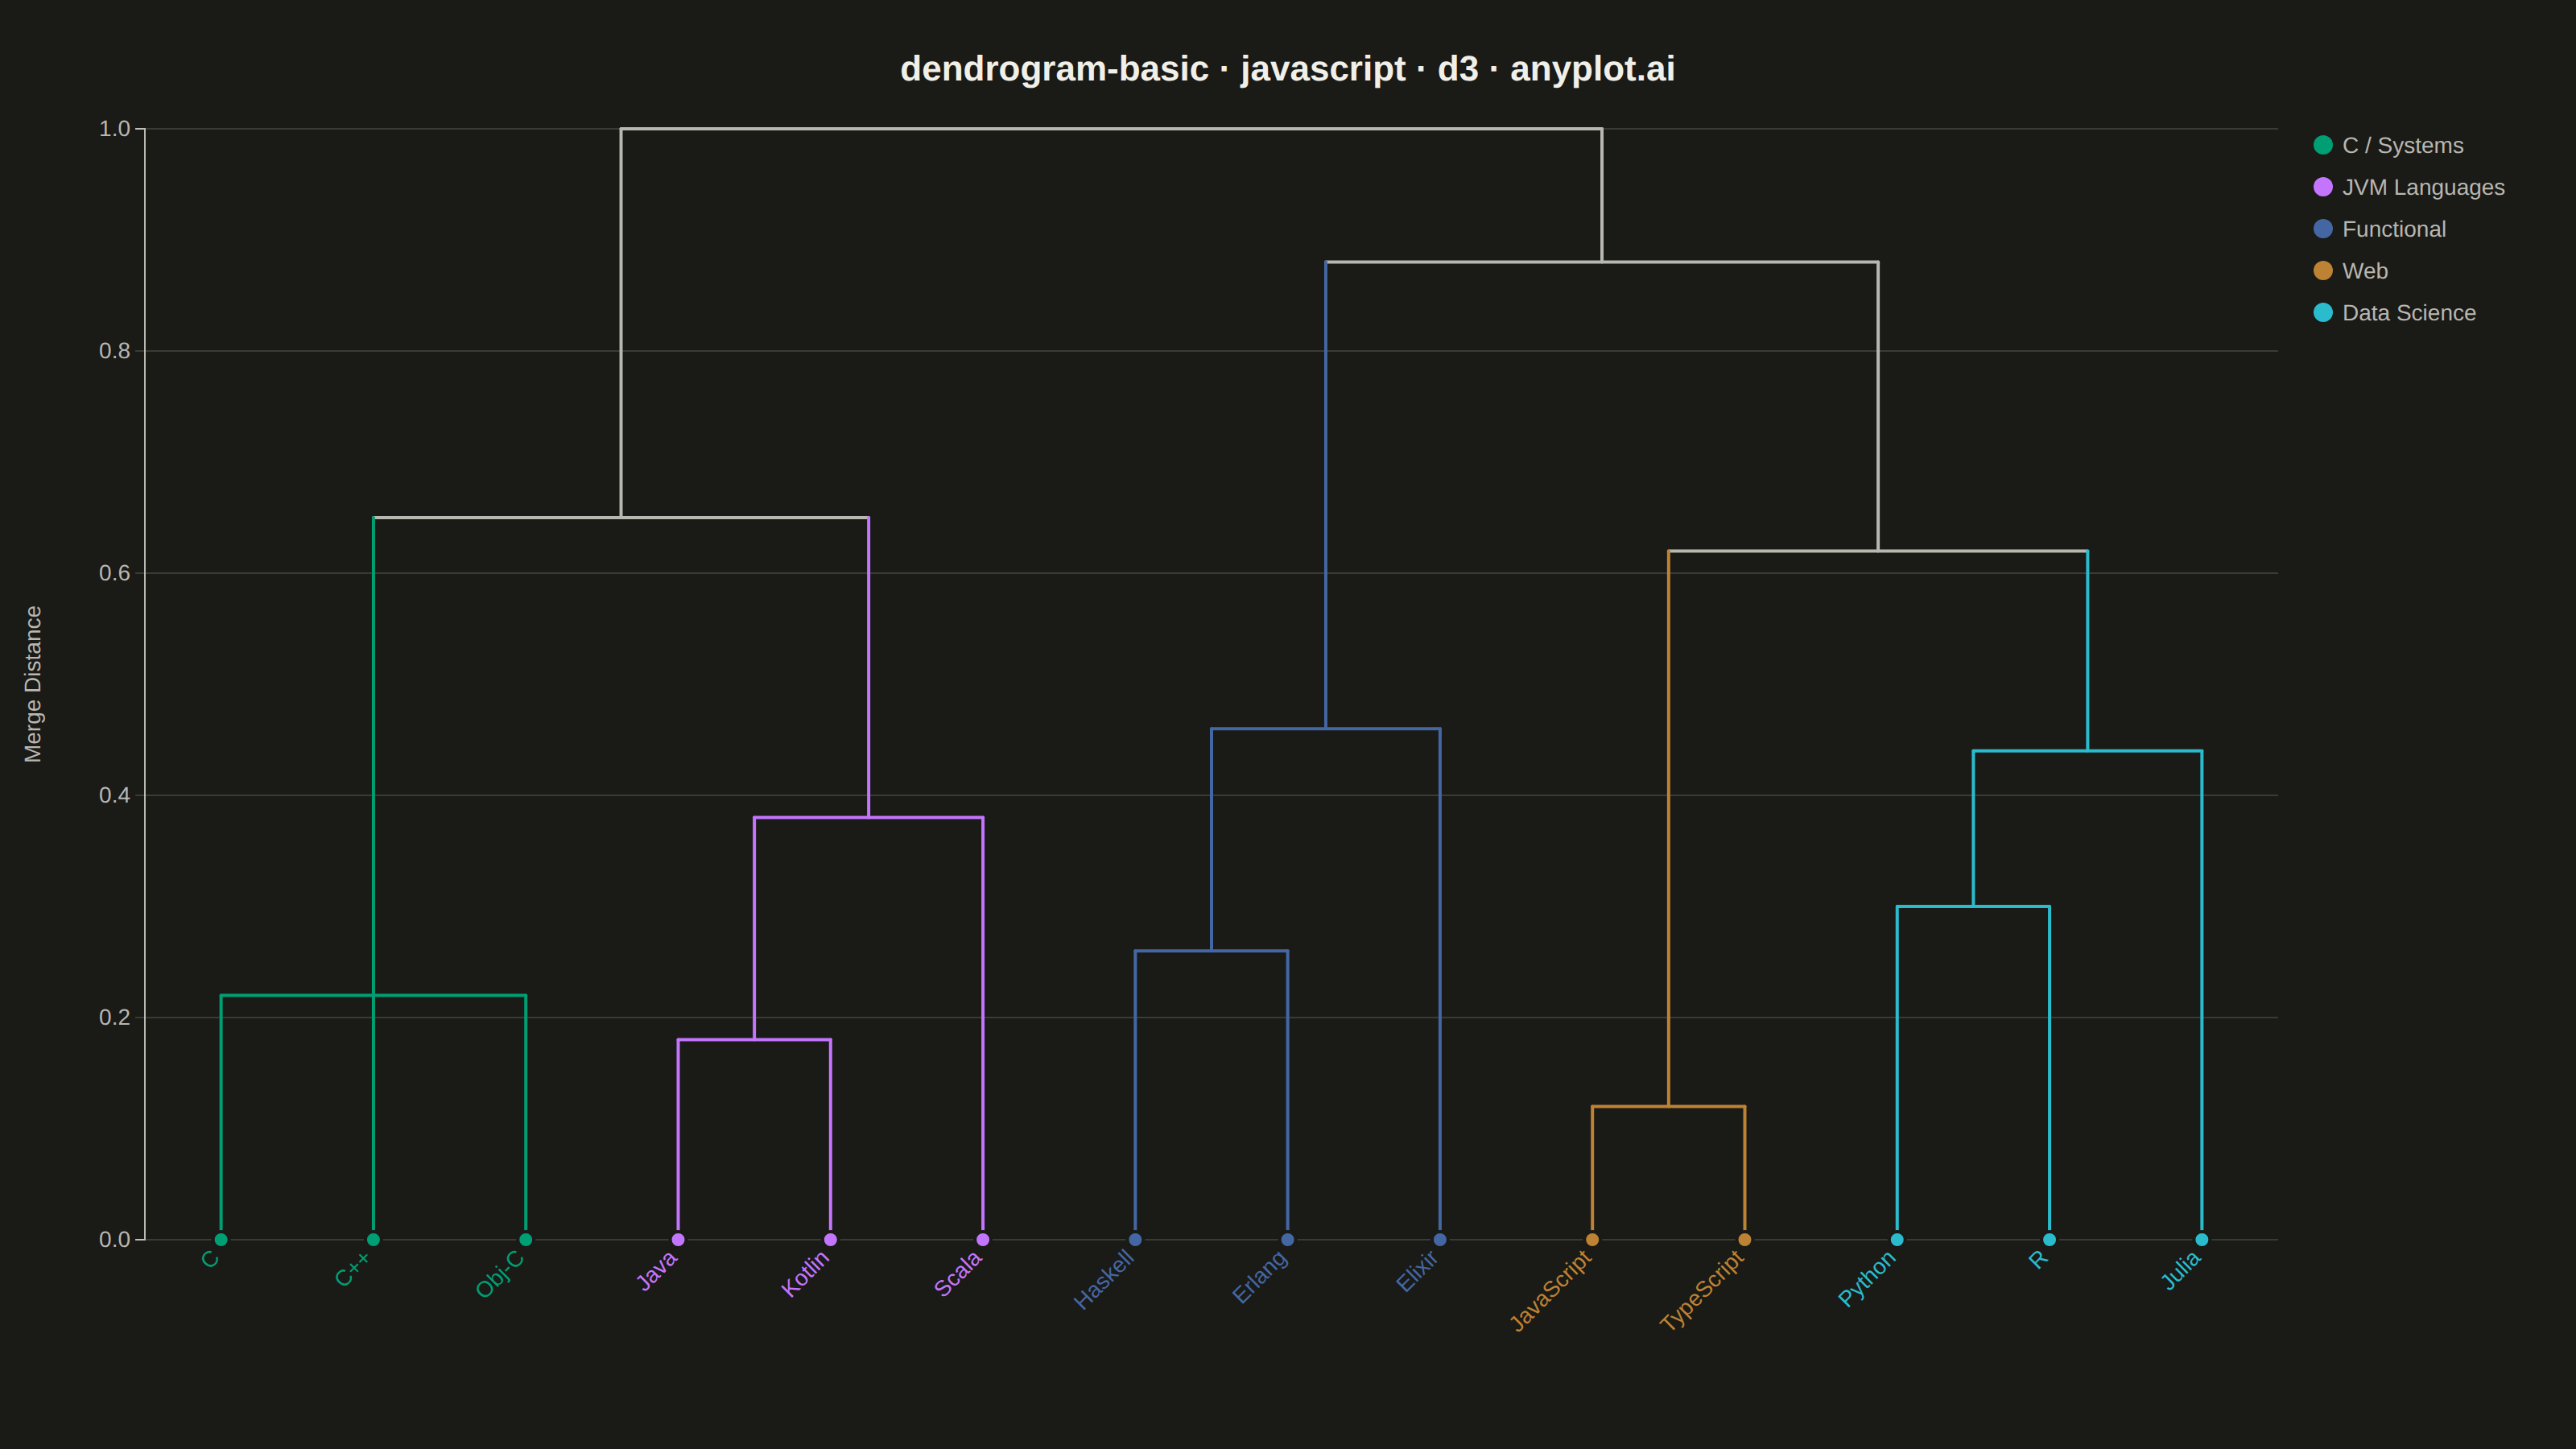
A dendrogram visualizes hierarchical clustering by showing how data points or clusters merge at different distance levels. The tree-like structure reveals relationships and similarity between items, with branch heights indicating the distance at which clusters merge. This visualization is essential for understanding the hierarchical structure in data and identifying natural groupings.
// anyplot.ai
// dendrogram-basic: Basic Dendrogram
// Library: d3 7.9.0 | JavaScript 22.22.3
// Quality: 88/100 | Created: 2026-06-18
//# anyplot-orientation: landscape

const t = window.ANYPLOT_TOKENS;
const { width, height } = window.ANYPLOT_SIZE;

const margin = { top: 80, right: 185, bottom: 130, left: 90 };
const iw = width - margin.left - margin.right;
const ih = height - margin.top - margin.bottom;

// Programming language similarity — pre-computed hierarchical clustering
// h = normalized merge height: 0.0 = leaf (most similar), 1.0 = root (most distant)
const treeData = {
  name: "root", h: 1.00,
  children: [
    {
      name: "compiled", h: 0.65,
      children: [
        {
          name: "c_family", h: 0.22,
          children: [
            { name: "C", h: 0, family: 0 },
            { name: "C++", h: 0, family: 0 },
            { name: "Obj-C", h: 0, family: 0 }
          ]
        },
        {
          name: "jvm", h: 0.38,
          children: [
            {
              name: "jvm_base", h: 0.18,
              children: [
                { name: "Java", h: 0, family: 1 },
                { name: "Kotlin", h: 0, family: 1 }
              ]
            },
            { name: "Scala", h: 0, family: 1 }
          ]
        }
      ]
    },
    {
      name: "dynamic", h: 0.88,
      children: [
        {
          name: "functional", h: 0.46,
          children: [
            {
              name: "core_func", h: 0.26,
              children: [
                { name: "Haskell", h: 0, family: 2 },
                { name: "Erlang", h: 0, family: 2 }
              ]
            },
            { name: "Elixir", h: 0, family: 2 }
          ]
        },
        {
          name: "scripting", h: 0.62,
          children: [
            {
              name: "web", h: 0.12,
              children: [
                { name: "JavaScript", h: 0, family: 3 },
                { name: "TypeScript", h: 0, family: 3 }
              ]
            },
            {
              name: "data_sci", h: 0.44,
              children: [
                {
                  name: "py_r", h: 0.30,
                  children: [
                    { name: "Python", h: 0, family: 4 },
                    { name: "R", h: 0, family: 4 }
                  ]
                },
                { name: "Julia", h: 0, family: 4 }
              ]
            }
          ]
        }
      ]
    }
  ]
};

// 5 language families — Imprint palette, skipping index 4 (semantic red)
const families = [
  { name: "C / Systems",   color: t.palette[0] },
  { name: "JVM Languages", color: t.palette[1] },
  { name: "Functional",    color: t.palette[2] },
  { name: "Web",           color: t.palette[3] },
  { name: "Data Science",  color: t.palette[5] }
];

// Build hierarchy and compute x-positions via cluster layout
const root = d3.hierarchy(treeData);
const clusterLayout = d3.cluster()
  .size([iw, ih])
  .separation(() => 1);
clusterLayout(root);

// Override y with merge-height positions (h=0 → bottom, h=1 → top)
root.descendants().forEach(d => {
  d.y = ih * (1 - d.data.h);
});

// Compute dominant family for each node (-1 = mixed subtree)
root.descendants().forEach(d => {
  if (d.data.family !== undefined) {
    d._family = d.data.family;
  } else {
    const familySet = new Set(d.leaves().map(leaf => leaf.data.family));
    d._family = familySet.size === 1 ? [...familySet][0] : -1;
  }
});

// SVG
const svg = d3.select("#container")
  .append("svg")
  .attr("width", width)
  .attr("height", height);

const g = svg.append("g")
  .attr("transform", `translate(${margin.left},${margin.top})`);

// Y scale for the distance axis
const yScale = d3.scaleLinear()
  .domain([0, 1])
  .range([ih, 0]);

// Horizontal gridlines
g.selectAll("line.grid")
  .data(yScale.ticks(5))
  .join("line")
  .attr("class", "grid")
  .attr("x1", 0)
  .attr("x2", iw)
  .attr("y1", d => yScale(d))
  .attr("y2", d => yScale(d))
  .attr("stroke", t.grid)
  .attr("stroke-width", 1);

// Internal node horizontal bars (spanning children's x range)
const internals = root.descendants().filter(d => d.children);

g.selectAll("line.hbar")
  .data(internals)
  .join("line")
  .attr("class", "hbar")
  .attr("x1", d => d3.min(d.children, c => c.x))
  .attr("y1", d => d.y)
  .attr("x2", d => d3.max(d.children, c => c.x))
  .attr("y2", d => d.y)
  .attr("stroke", d => d._family >= 0 ? families[d._family].color : t.inkSoft)
  .attr("stroke-width", 2)
  .attr("stroke-linecap", "round");

// Vertical bars: each node up to its parent's merge height
const nonRoot = root.descendants().filter(d => d.parent);

g.selectAll("line.vbar")
  .data(nonRoot)
  .join("line")
  .attr("class", "vbar")
  .attr("x1", d => d.x)
  .attr("y1", d => d.parent.y)
  .attr("x2", d => d.x)
  .attr("y2", d => d.y)
  .attr("stroke", d => d._family >= 0 ? families[d._family].color : t.inkSoft)
  .attr("stroke-width", 2)
  .attr("stroke-linecap", "round");

// Leaf circles (colored by language family)
const leaves = root.leaves();

g.selectAll("circle.leaf")
  .data(leaves)
  .join("circle")
  .attr("class", "leaf")
  .attr("cx", d => d.x)
  .attr("cy", d => d.y)
  .attr("r", 5)
  .attr("fill", d => families[d.data.family].color)
  .attr("stroke", t.pageBg)
  .attr("stroke-width", 2);

// Leaf labels (rotated -45° so they extend down-left from the leaf)
g.selectAll("text.leaf-label")
  .data(leaves)
  .join("text")
  .attr("class", "leaf-label")
  .attr("transform", d => `translate(${d.x},${d.y + 12}) rotate(-45)`)
  .attr("text-anchor", "end")
  .attr("fill", d => families[d.data.family].color)
  .style("font-size", "14px")
  .style("font-weight", "500")
  .text(d => d.data.name);

// Left Y axis (merge distance)
const yAxisGroup = g.append("g")
  .call(
    d3.axisLeft(yScale)
      .ticks(5)
      .tickFormat(d3.format(".1f"))
  );

yAxisGroup.selectAll("text")
  .attr("fill", t.inkSoft)
  .style("font-size", "14px");
yAxisGroup.selectAll("line")
  .attr("stroke", t.grid);
yAxisGroup.select(".domain")
  .attr("stroke", t.inkSoft);

// Y axis label
g.append("text")
  .attr("transform", "rotate(-90)")
  .attr("x", -ih / 2)
  .attr("y", -65)
  .attr("text-anchor", "middle")
  .attr("fill", t.inkSoft)
  .style("font-size", "14px")
  .text("Merge Distance");

// Legend (inside right margin)
const legendG = g.append("g")
  .attr("transform", `translate(${iw + 22}, 10)`);

families.forEach((fam, i) => {
  const row = legendG.append("g")
    .attr("transform", `translate(0, ${i * 26})`);

  row.append("circle")
    .attr("r", 6)
    .attr("cx", 6)
    .attr("fill", fam.color);

  row.append("text")
    .attr("x", 18)
    .attr("y", 5)
    .attr("fill", t.inkSoft)
    .style("font-size", "14px")
    .text(fam.name);
});

// Title
svg.append("text")
  .attr("x", width / 2)
  .attr("y", 50)
  .attr("text-anchor", "middle")
  .attr("fill", t.ink)
  .style("font-size", "22px")
  .style("font-weight", "600")
  .text("dendrogram-basic · javascript · d3 · anyplot.ai");
Runnable source as JSON, for any HTTP client: https://api.anyplot.ai/specs/dendrogram-basic/d3/code. Any spec id and library id listed in llms-full.txt fit the same URL shape; every URL below is complete and callable.
{
  "spec_id": "dendrogram-basic",
  "language": "javascript",
  "library": "d3",
  "page": "https://anyplot.ai/dendrogram-basic/javascript/d3",
  "hub": "https://anyplot.ai/dendrogram-basic",
  "code_json": "https://api.anyplot.ai/specs/dendrogram-basic/d3/code",
  "spec_json": "https://api.anyplot.ai/specs/dendrogram-basic",
  "render_light_png": "https://storage.googleapis.com/anyplot-images/plots/dendrogram-basic/javascript/d3/plot-light.png",
  "render_dark_png": "https://storage.googleapis.com/anyplot-images/plots/dendrogram-basic/javascript/d3/plot-dark.png",
  "interactive_light_html": "https://storage.googleapis.com/anyplot-images/plots/dendrogram-basic/javascript/d3/plot-light.html",
  "interactive_dark_html": "https://storage.googleapis.com/anyplot-images/plots/dendrogram-basic/javascript/d3/plot-dark.html",
  "quality_score": 88.0,
  "license": "MIT",
  "guide": "https://anyplot.ai/llms.txt"
}
Part of Basic Dendrogram on anyplot.ai.