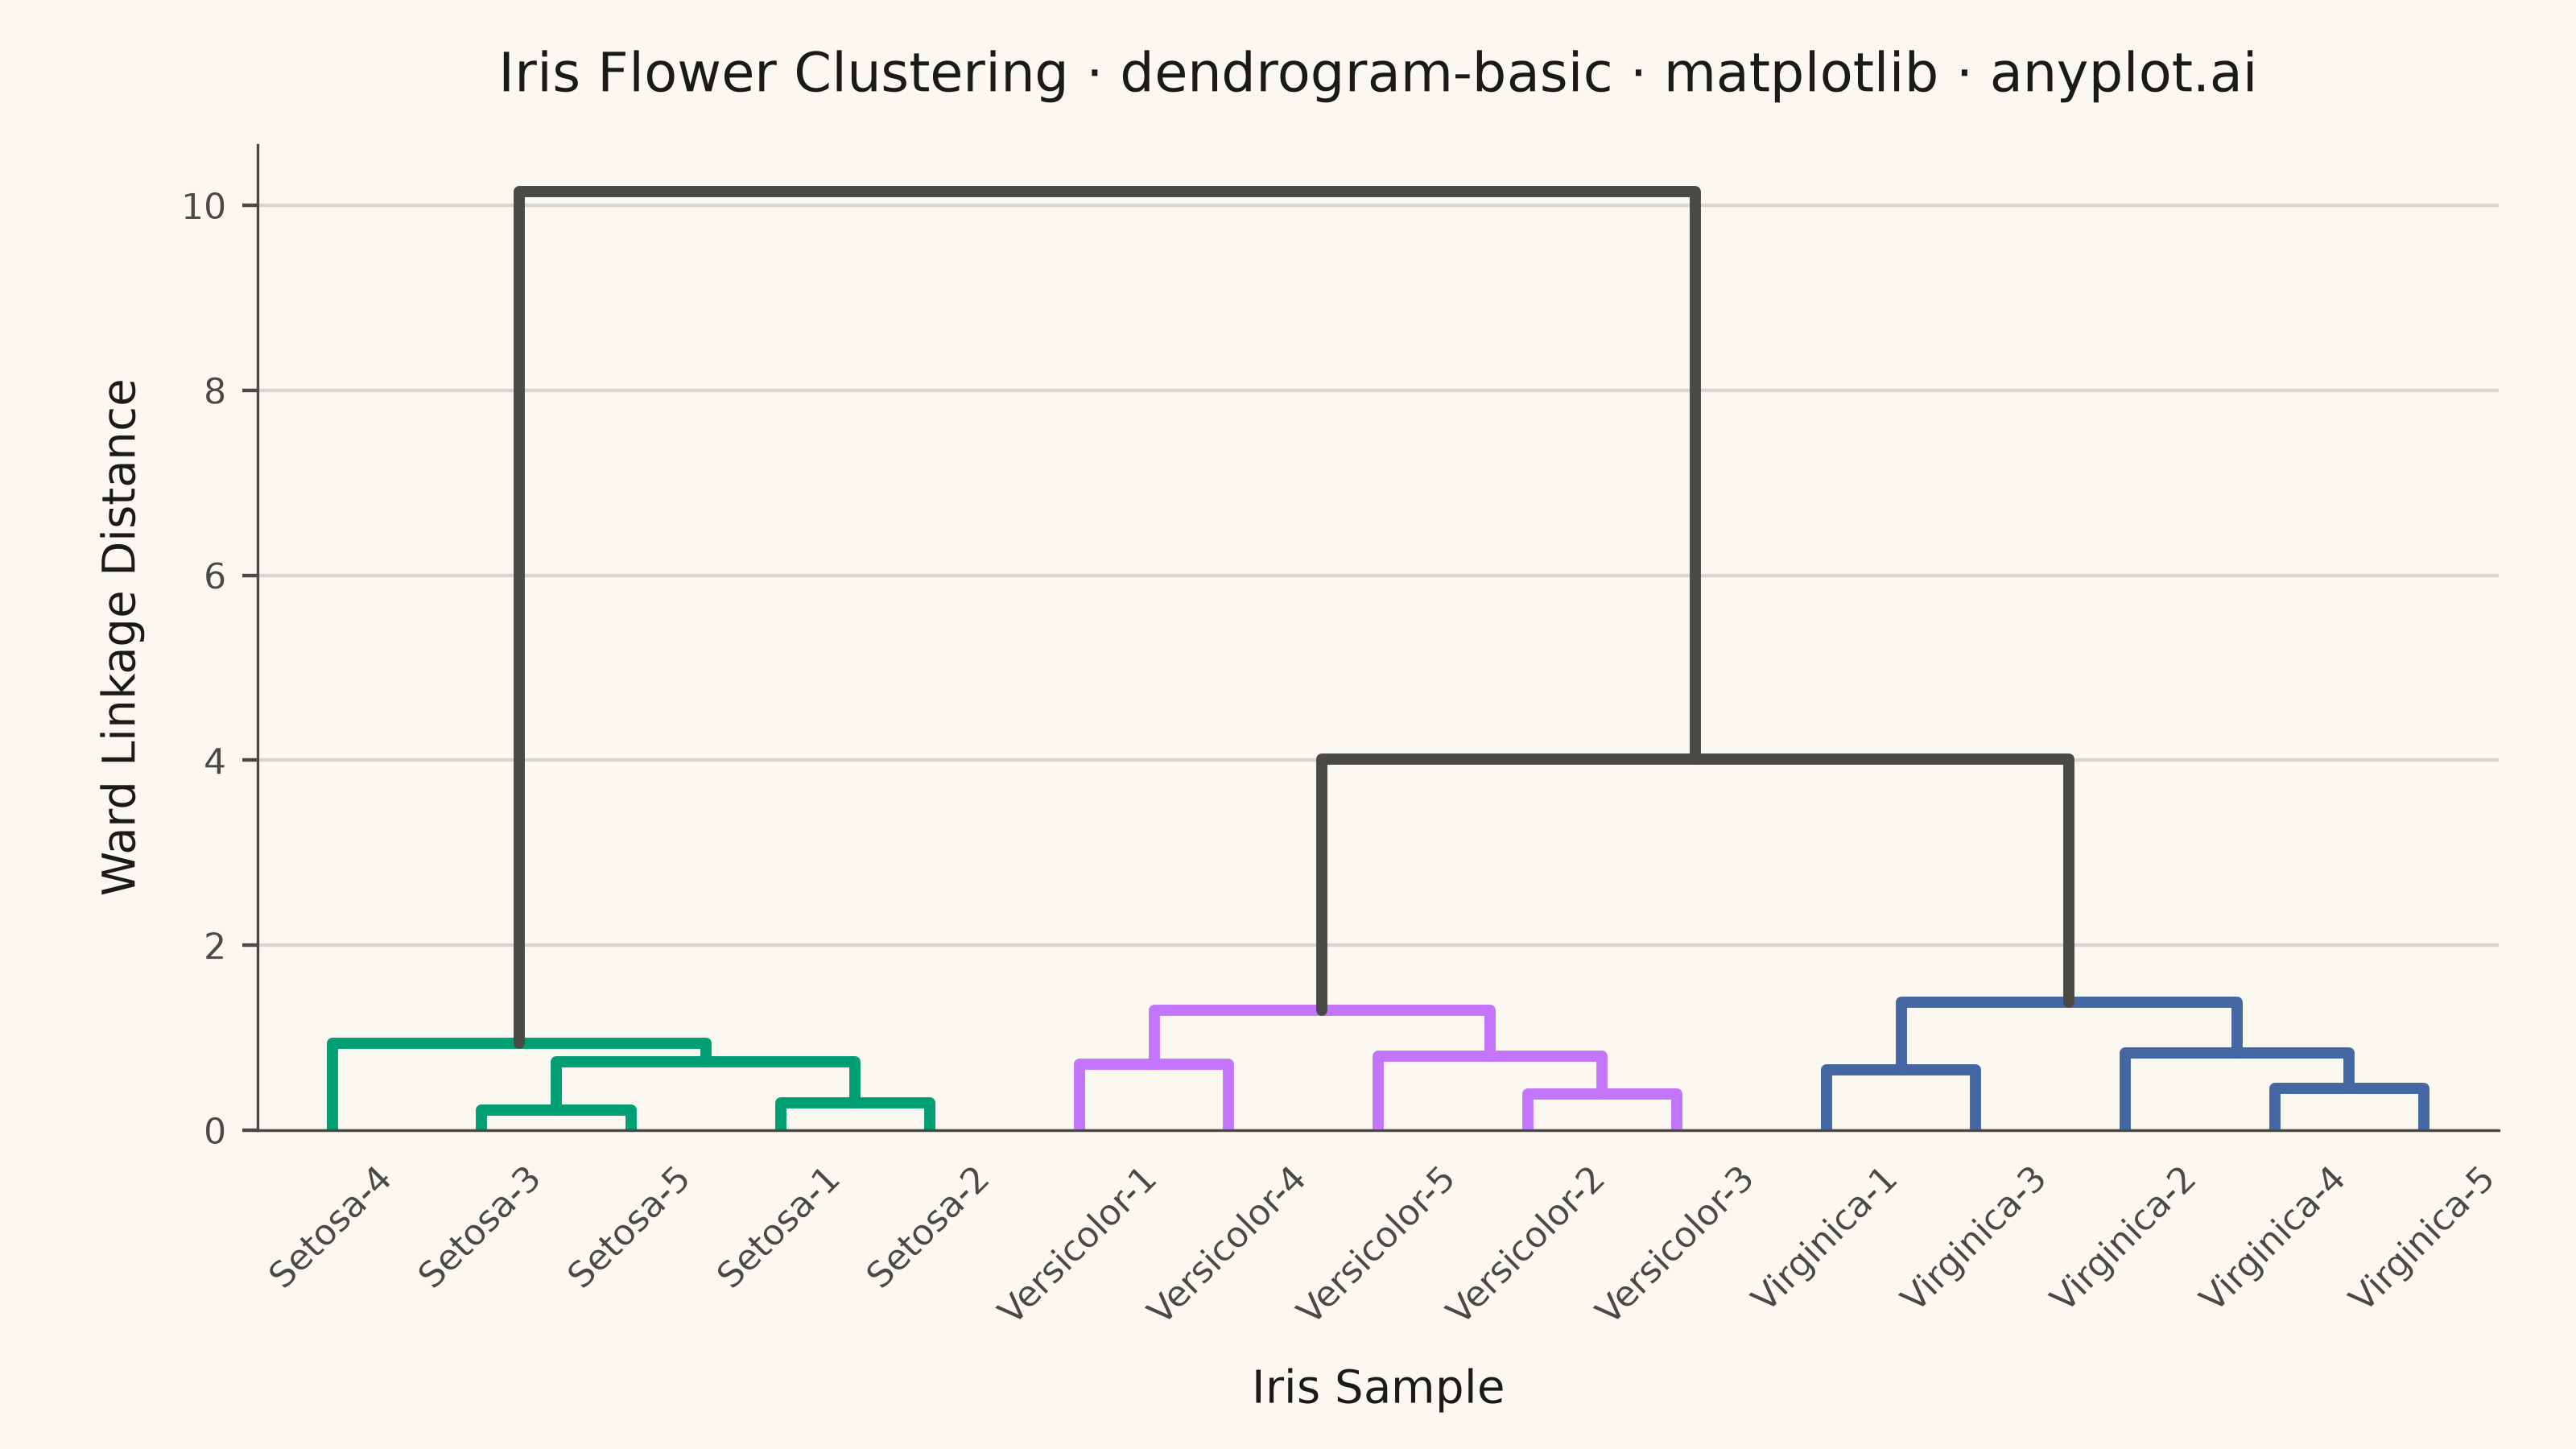
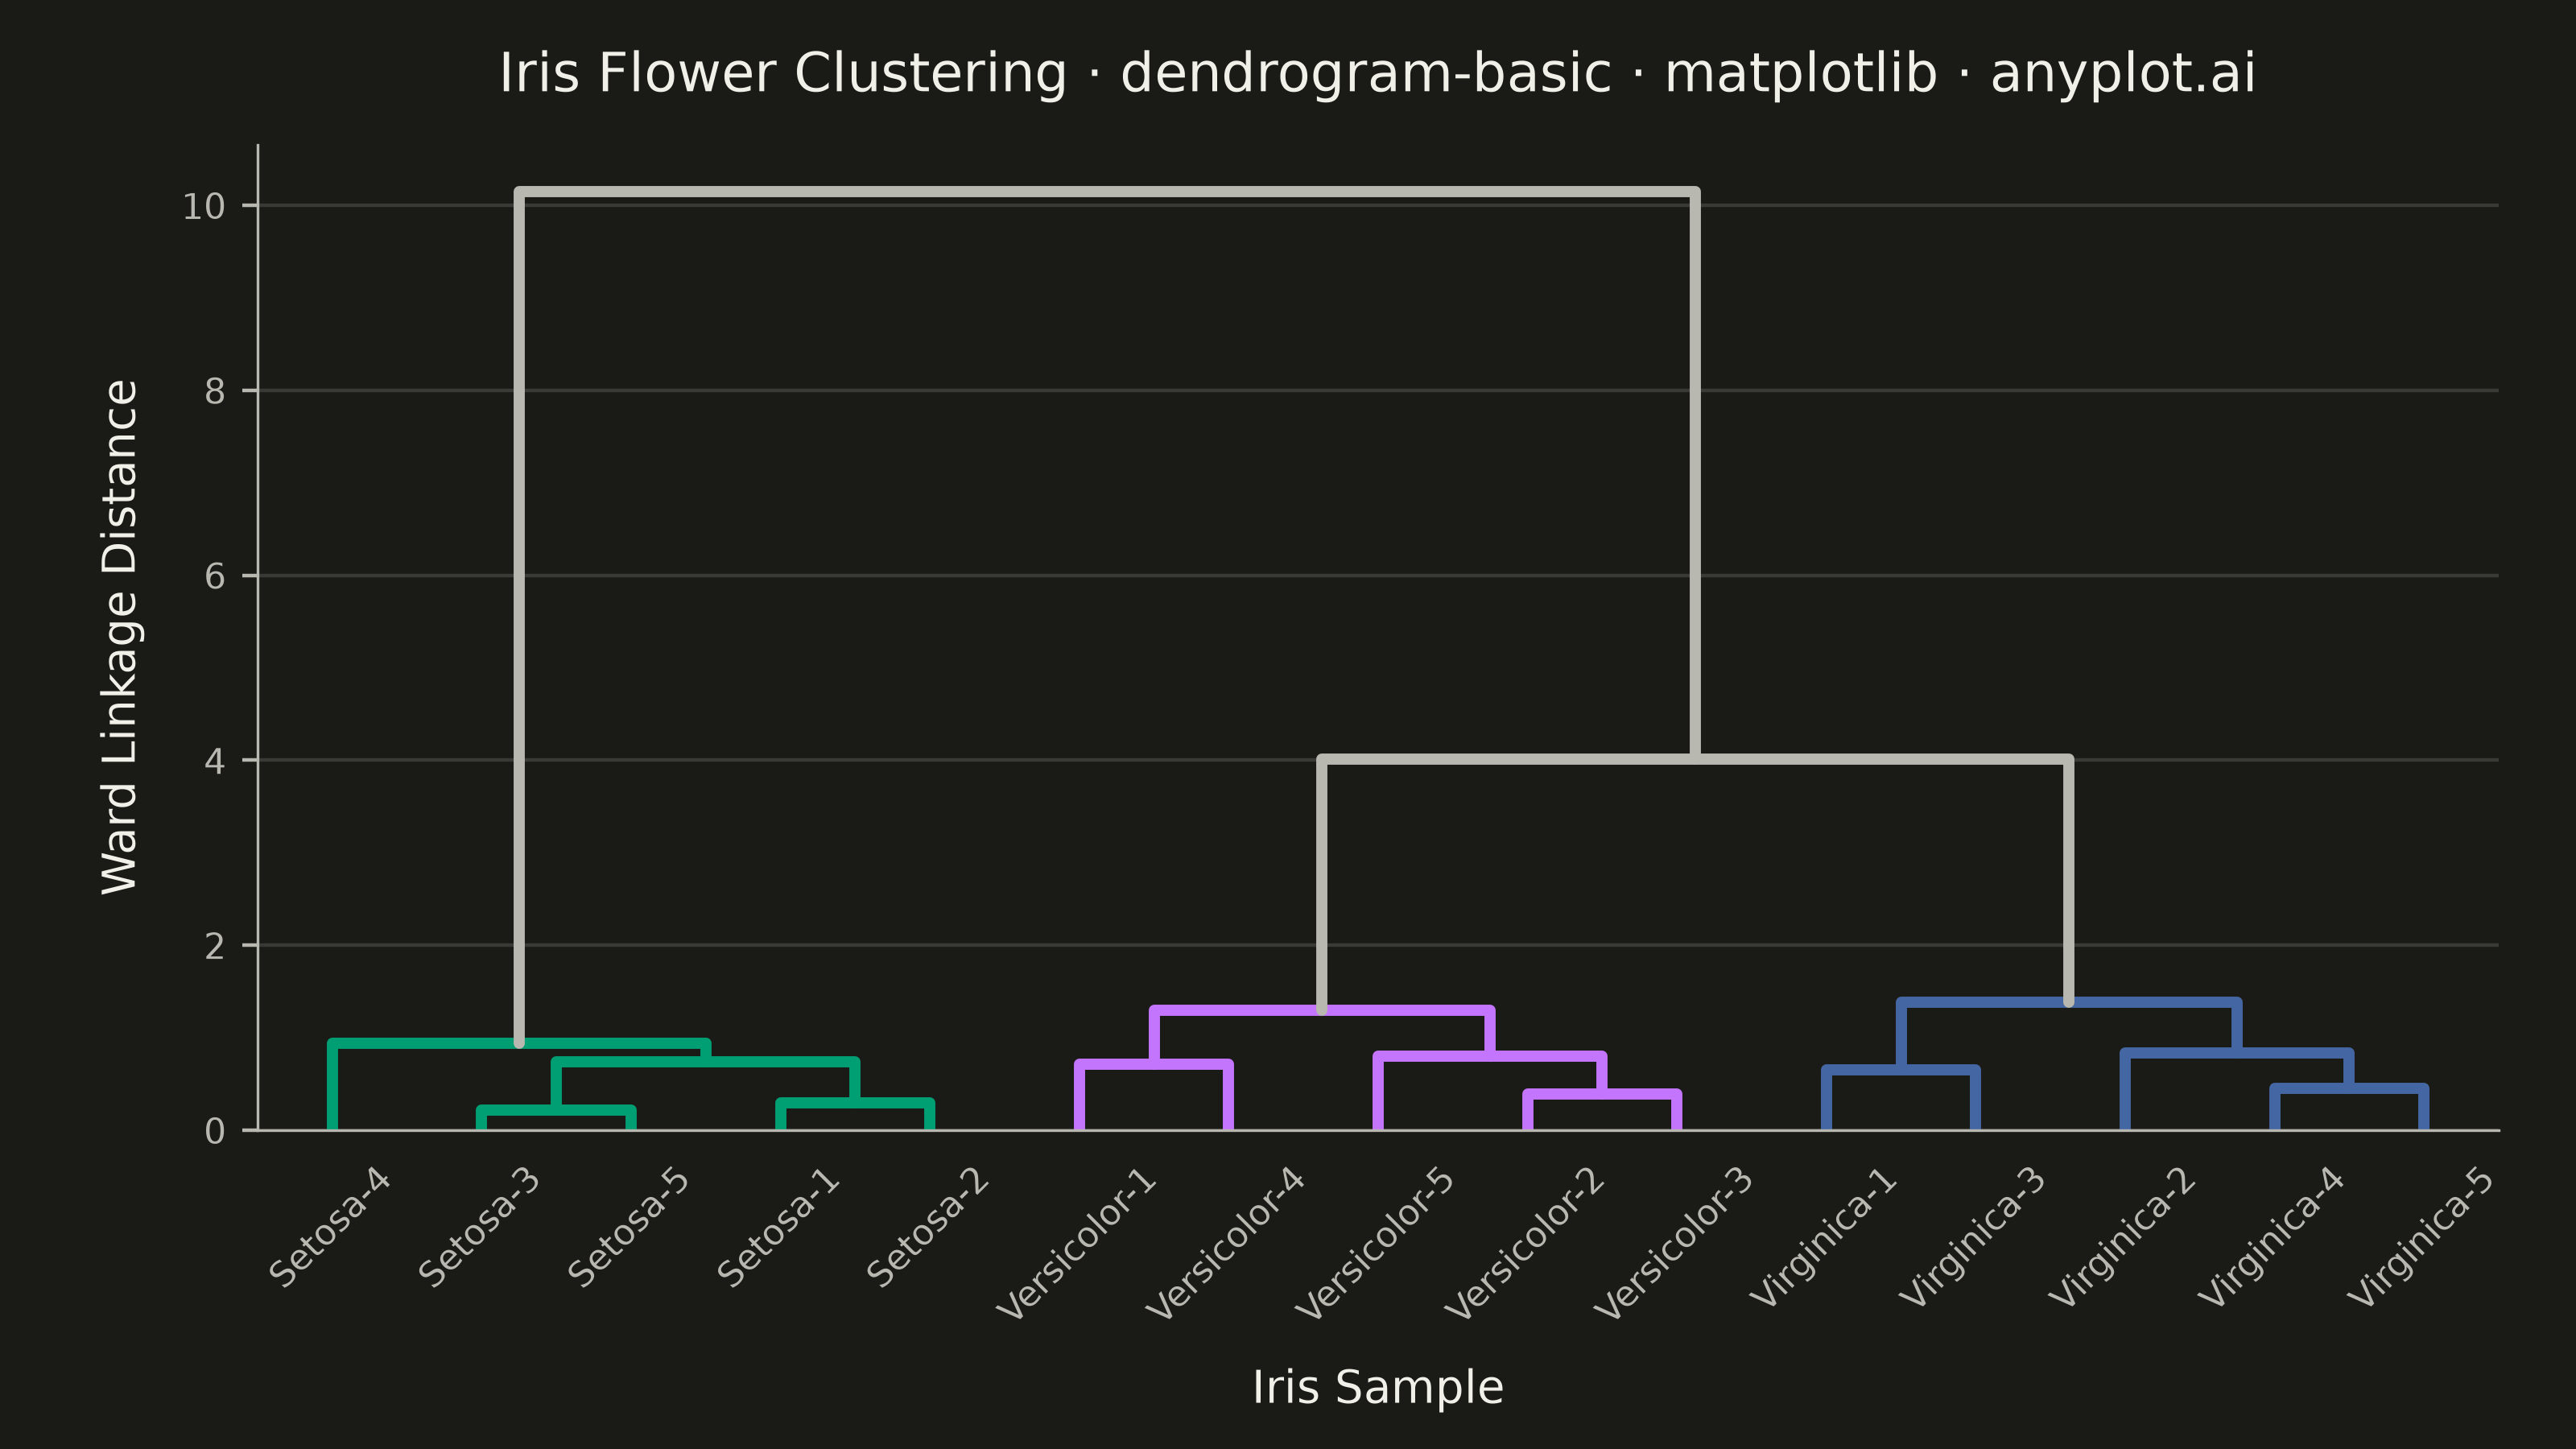
A dendrogram visualizes hierarchical clustering by showing how data points or clusters merge at different distance levels. The tree-like structure reveals relationships and similarity between items, with branch heights indicating the distance at which clusters merge. This visualization is essential for understanding the hierarchical structure in data and identifying natural groupings.
""" anyplot.ai
dendrogram-basic: Basic Dendrogram
Library: matplotlib 3.11.0 | Python 3.13.14
Quality: 91/100 | Updated: 2026-06-18
"""

import os
import sys


# Prevent this file (matplotlib.py) from shadowing the installed matplotlib package
_here = os.path.dirname(os.path.realpath(__file__))
sys.path = [p for p in sys.path if os.path.realpath(p) != _here]
os.chdir(_here)

import matplotlib.pyplot as plt
import numpy as np
from matplotlib.collections import LineCollection
from scipy.cluster.hierarchy import dendrogram, linkage, set_link_color_palette


# Theme-adaptive chrome
THEME = os.getenv("ANYPLOT_THEME", "light")
PAGE_BG = "#FAF8F1" if THEME == "light" else "#1A1A17"
INK = "#1A1A17" if THEME == "light" else "#F0EFE8"
INK_SOFT = "#4A4A44" if THEME == "light" else "#B8B7B0"

# Imprint palette — categorical, first series always #009E73
IMPRINT_PALETTE = ["#009E73", "#C475FD", "#4467A3", "#BD8233", "#AE3030", "#2ABCCD", "#954477", "#99B314"]

# Data — Iris flower measurements (4 features for 15 samples)
np.random.seed(42)

samples_per_species = 5
labels = []
data = []

for i in range(samples_per_species):
    labels.append(f"Setosa-{i + 1}")
    data.append(
        [
            5.0 + np.random.randn() * 0.3,
            3.4 + np.random.randn() * 0.3,
            1.5 + np.random.randn() * 0.2,
            0.3 + np.random.randn() * 0.1,
        ]
    )

for i in range(samples_per_species):
    labels.append(f"Versicolor-{i + 1}")
    data.append(
        [
            5.9 + np.random.randn() * 0.4,
            2.8 + np.random.randn() * 0.3,
            4.3 + np.random.randn() * 0.4,
            1.3 + np.random.randn() * 0.2,
        ]
    )

for i in range(samples_per_species):
    labels.append(f"Virginica-{i + 1}")
    data.append(
        [
            6.6 + np.random.randn() * 0.5,
            3.0 + np.random.randn() * 0.3,
            5.5 + np.random.randn() * 0.5,
            2.0 + np.random.randn() * 0.3,
        ]
    )

data = np.array(data)
linkage_matrix = linkage(data, method="ward")

# Canvas — landscape 3200×1800 (figsize=(8, 4.5) × dpi=400)
fig, ax = plt.subplots(figsize=(8, 4.5), dpi=400, facecolor=PAGE_BG)
ax.set_facecolor(PAGE_BG)

# Imprint palette cluster colors for 3 species clusters
set_link_color_palette(IMPRINT_PALETTE[:3])

# Color threshold splits the tree into 3 clusters
sorted_distances = sorted(linkage_matrix[:, 2])
color_threshold = (sorted_distances[-2] + sorted_distances[-3]) / 2

dendrogram(
    linkage_matrix,
    labels=labels,
    ax=ax,
    leaf_rotation=45,
    leaf_font_size=8,
    above_threshold_color=INK_SOFT,
    color_threshold=color_threshold,
)

# Thicker lines for readability at high resolution
for child in ax.get_children():
    if isinstance(child, LineCollection):
        child.set_linewidths(2.5)
        child.set_capstyle("round")
        child.set_joinstyle("round")

# Title — 67 chars → fontsize 12
title = "Iris Flower Clustering · dendrogram-basic · matplotlib · anyplot.ai"
ax.set_title(title, fontsize=12, fontweight="medium", pad=12, color=INK)

ax.set_xlabel("Iris Sample", fontsize=10, labelpad=8, color=INK)
ax.set_ylabel("Ward Linkage Distance", fontsize=10, labelpad=8, color=INK)
ax.tick_params(axis="both", labelsize=8, colors=INK_SOFT, labelcolor=INK_SOFT)

ax.spines["top"].set_visible(False)
ax.spines["right"].set_visible(False)
ax.spines["left"].set_linewidth(0.6)
ax.spines["left"].set_color(INK_SOFT)
ax.spines["bottom"].set_linewidth(0.6)
ax.spines["bottom"].set_color(INK_SOFT)

ax.yaxis.grid(True, alpha=0.15, linewidth=0.8, color=INK)
ax.set_axisbelow(True)

fig.subplots_adjust(left=0.10, right=0.97, top=0.90, bottom=0.22)
plt.savefig(f"plot-{THEME}.png", dpi=400, facecolor=PAGE_BG)
Runnable source as JSON, for any HTTP client: https://api.anyplot.ai/specs/dendrogram-basic/matplotlib/code. Any spec id and library id listed in llms-full.txt fit the same URL shape; every URL below is complete and callable.
{
  "spec_id": "dendrogram-basic",
  "language": "python",
  "library": "matplotlib",
  "page": "https://anyplot.ai/dendrogram-basic/python/matplotlib",
  "hub": "https://anyplot.ai/dendrogram-basic",
  "code_json": "https://api.anyplot.ai/specs/dendrogram-basic/matplotlib/code",
  "spec_json": "https://api.anyplot.ai/specs/dendrogram-basic",
  "render_light_png": "https://storage.googleapis.com/anyplot-images/plots/dendrogram-basic/python/matplotlib/plot-light.png",
  "render_dark_png": "https://storage.googleapis.com/anyplot-images/plots/dendrogram-basic/python/matplotlib/plot-dark.png",
  "quality_score": 91.0,
  "license": "MIT",
  "guide": "https://anyplot.ai/llms.txt"
}
Part of Basic Dendrogram on anyplot.ai.