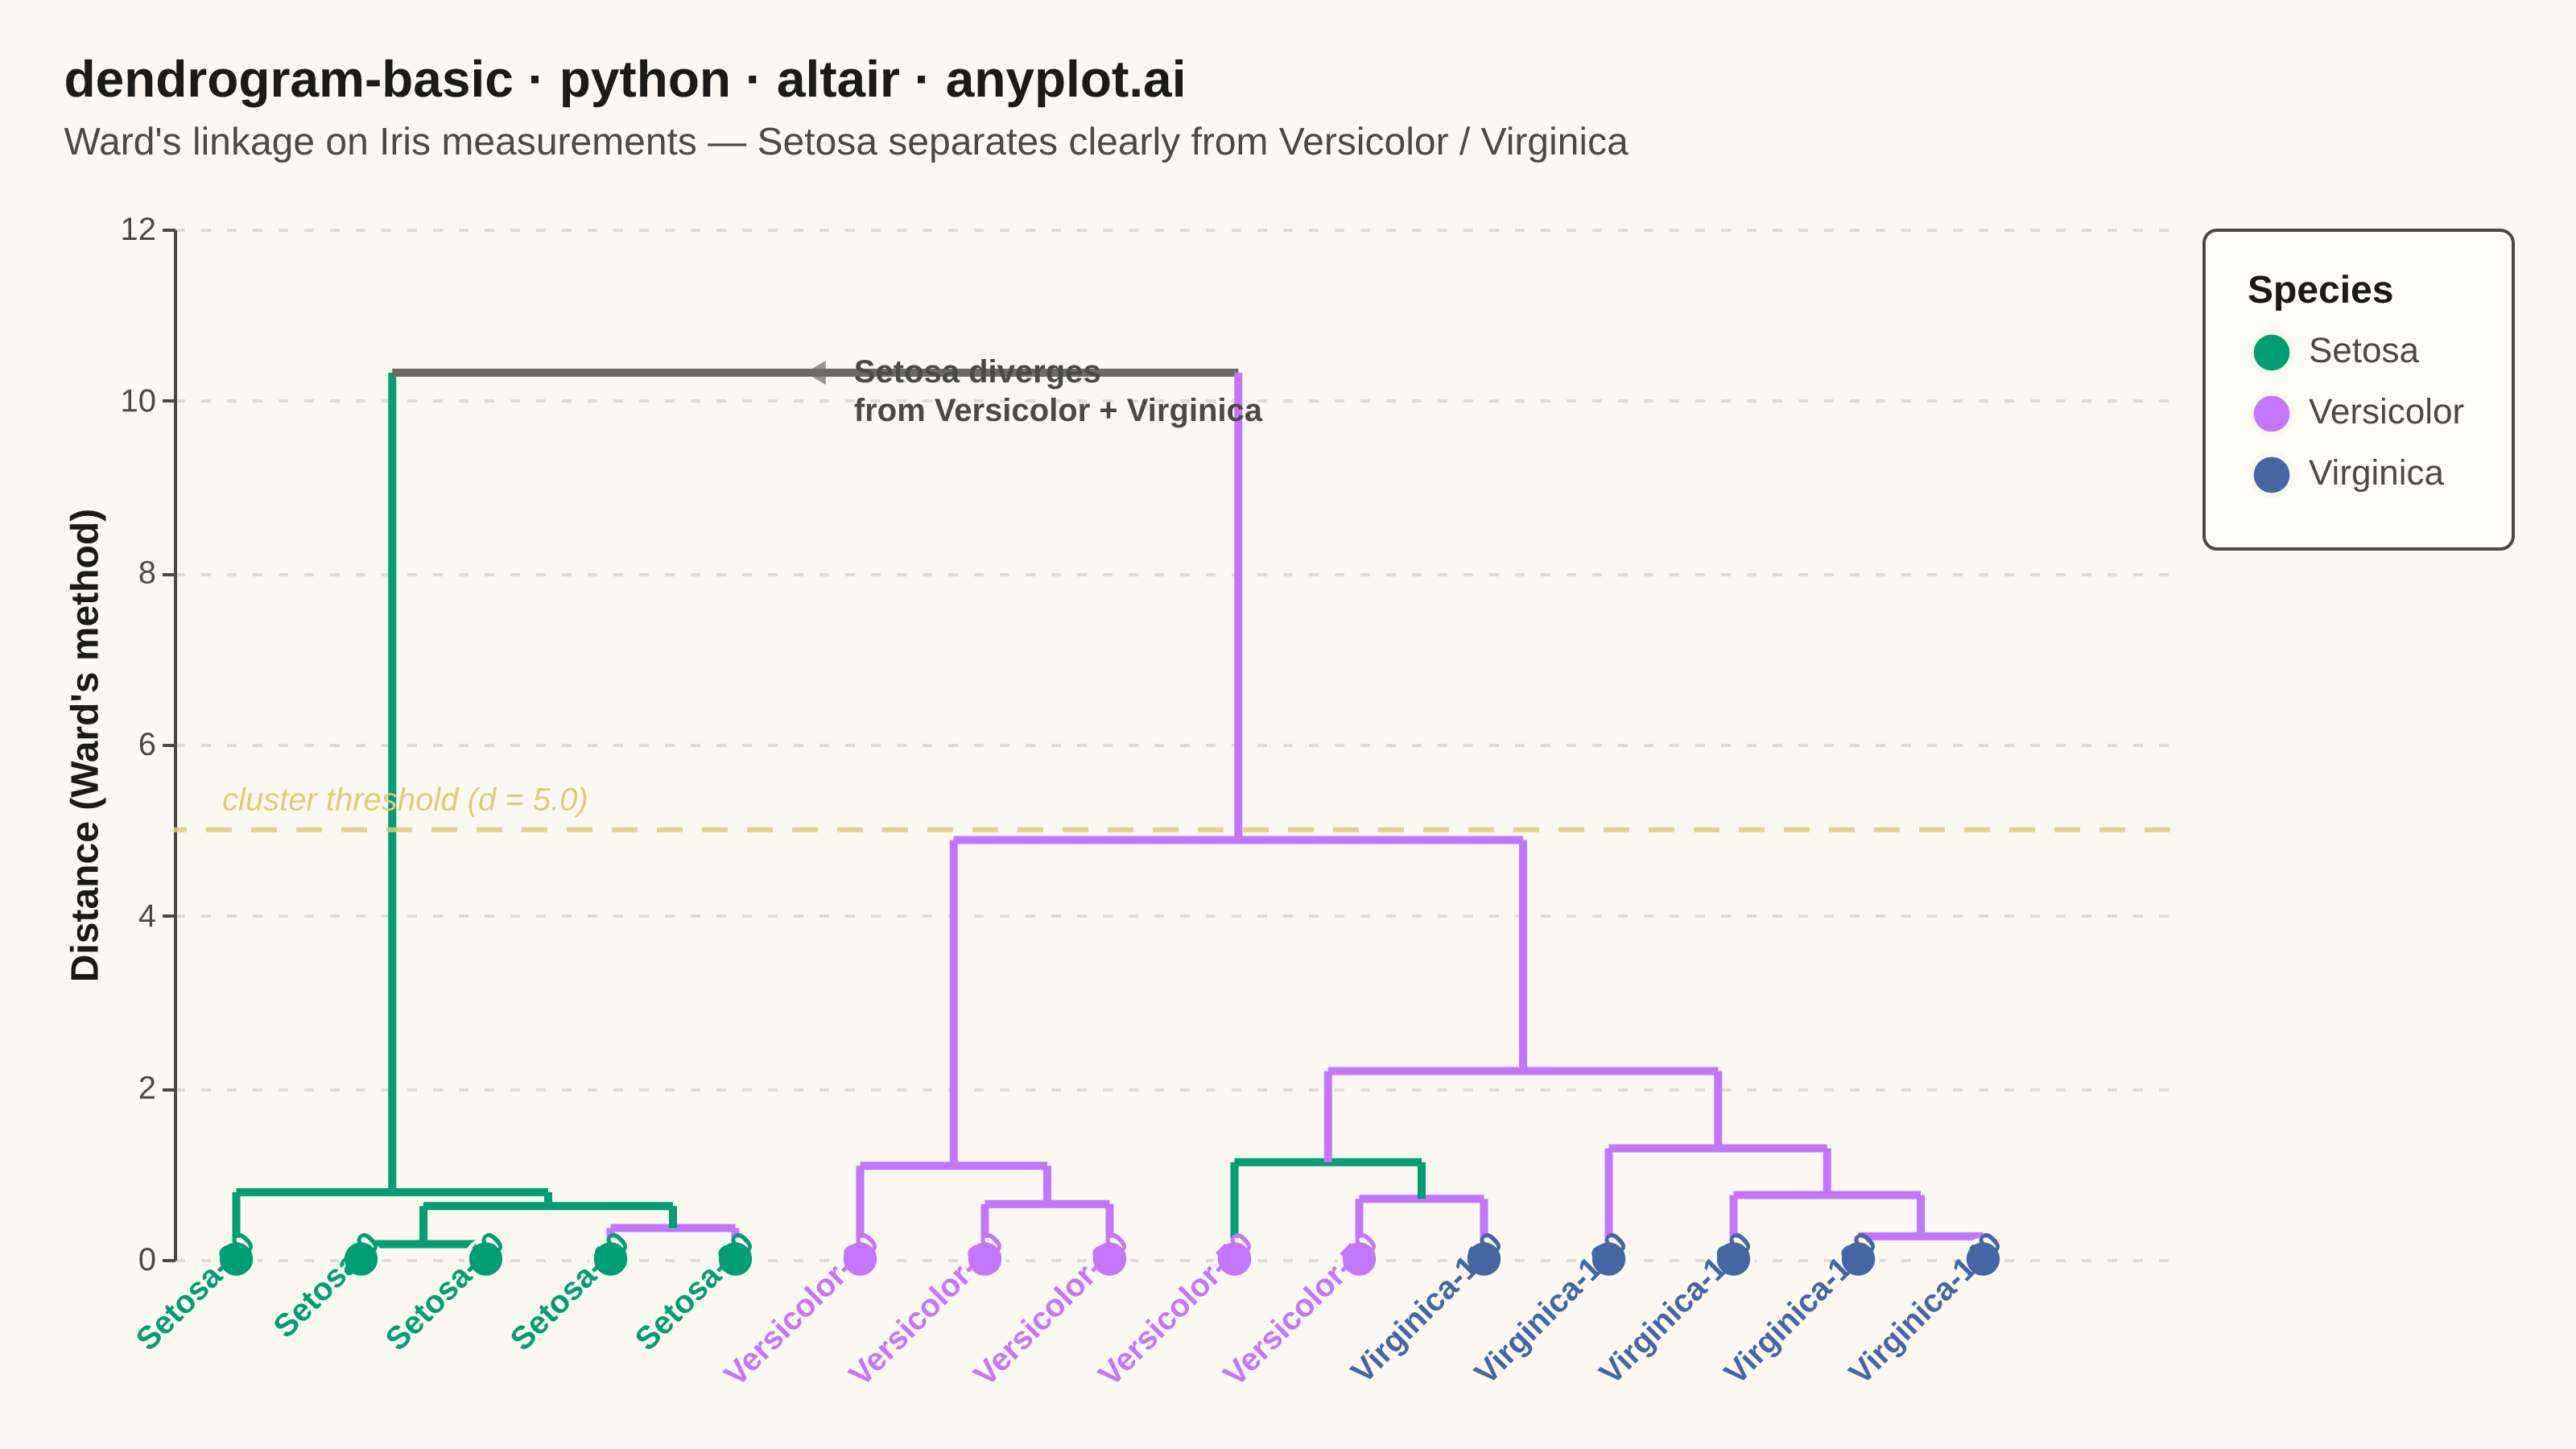
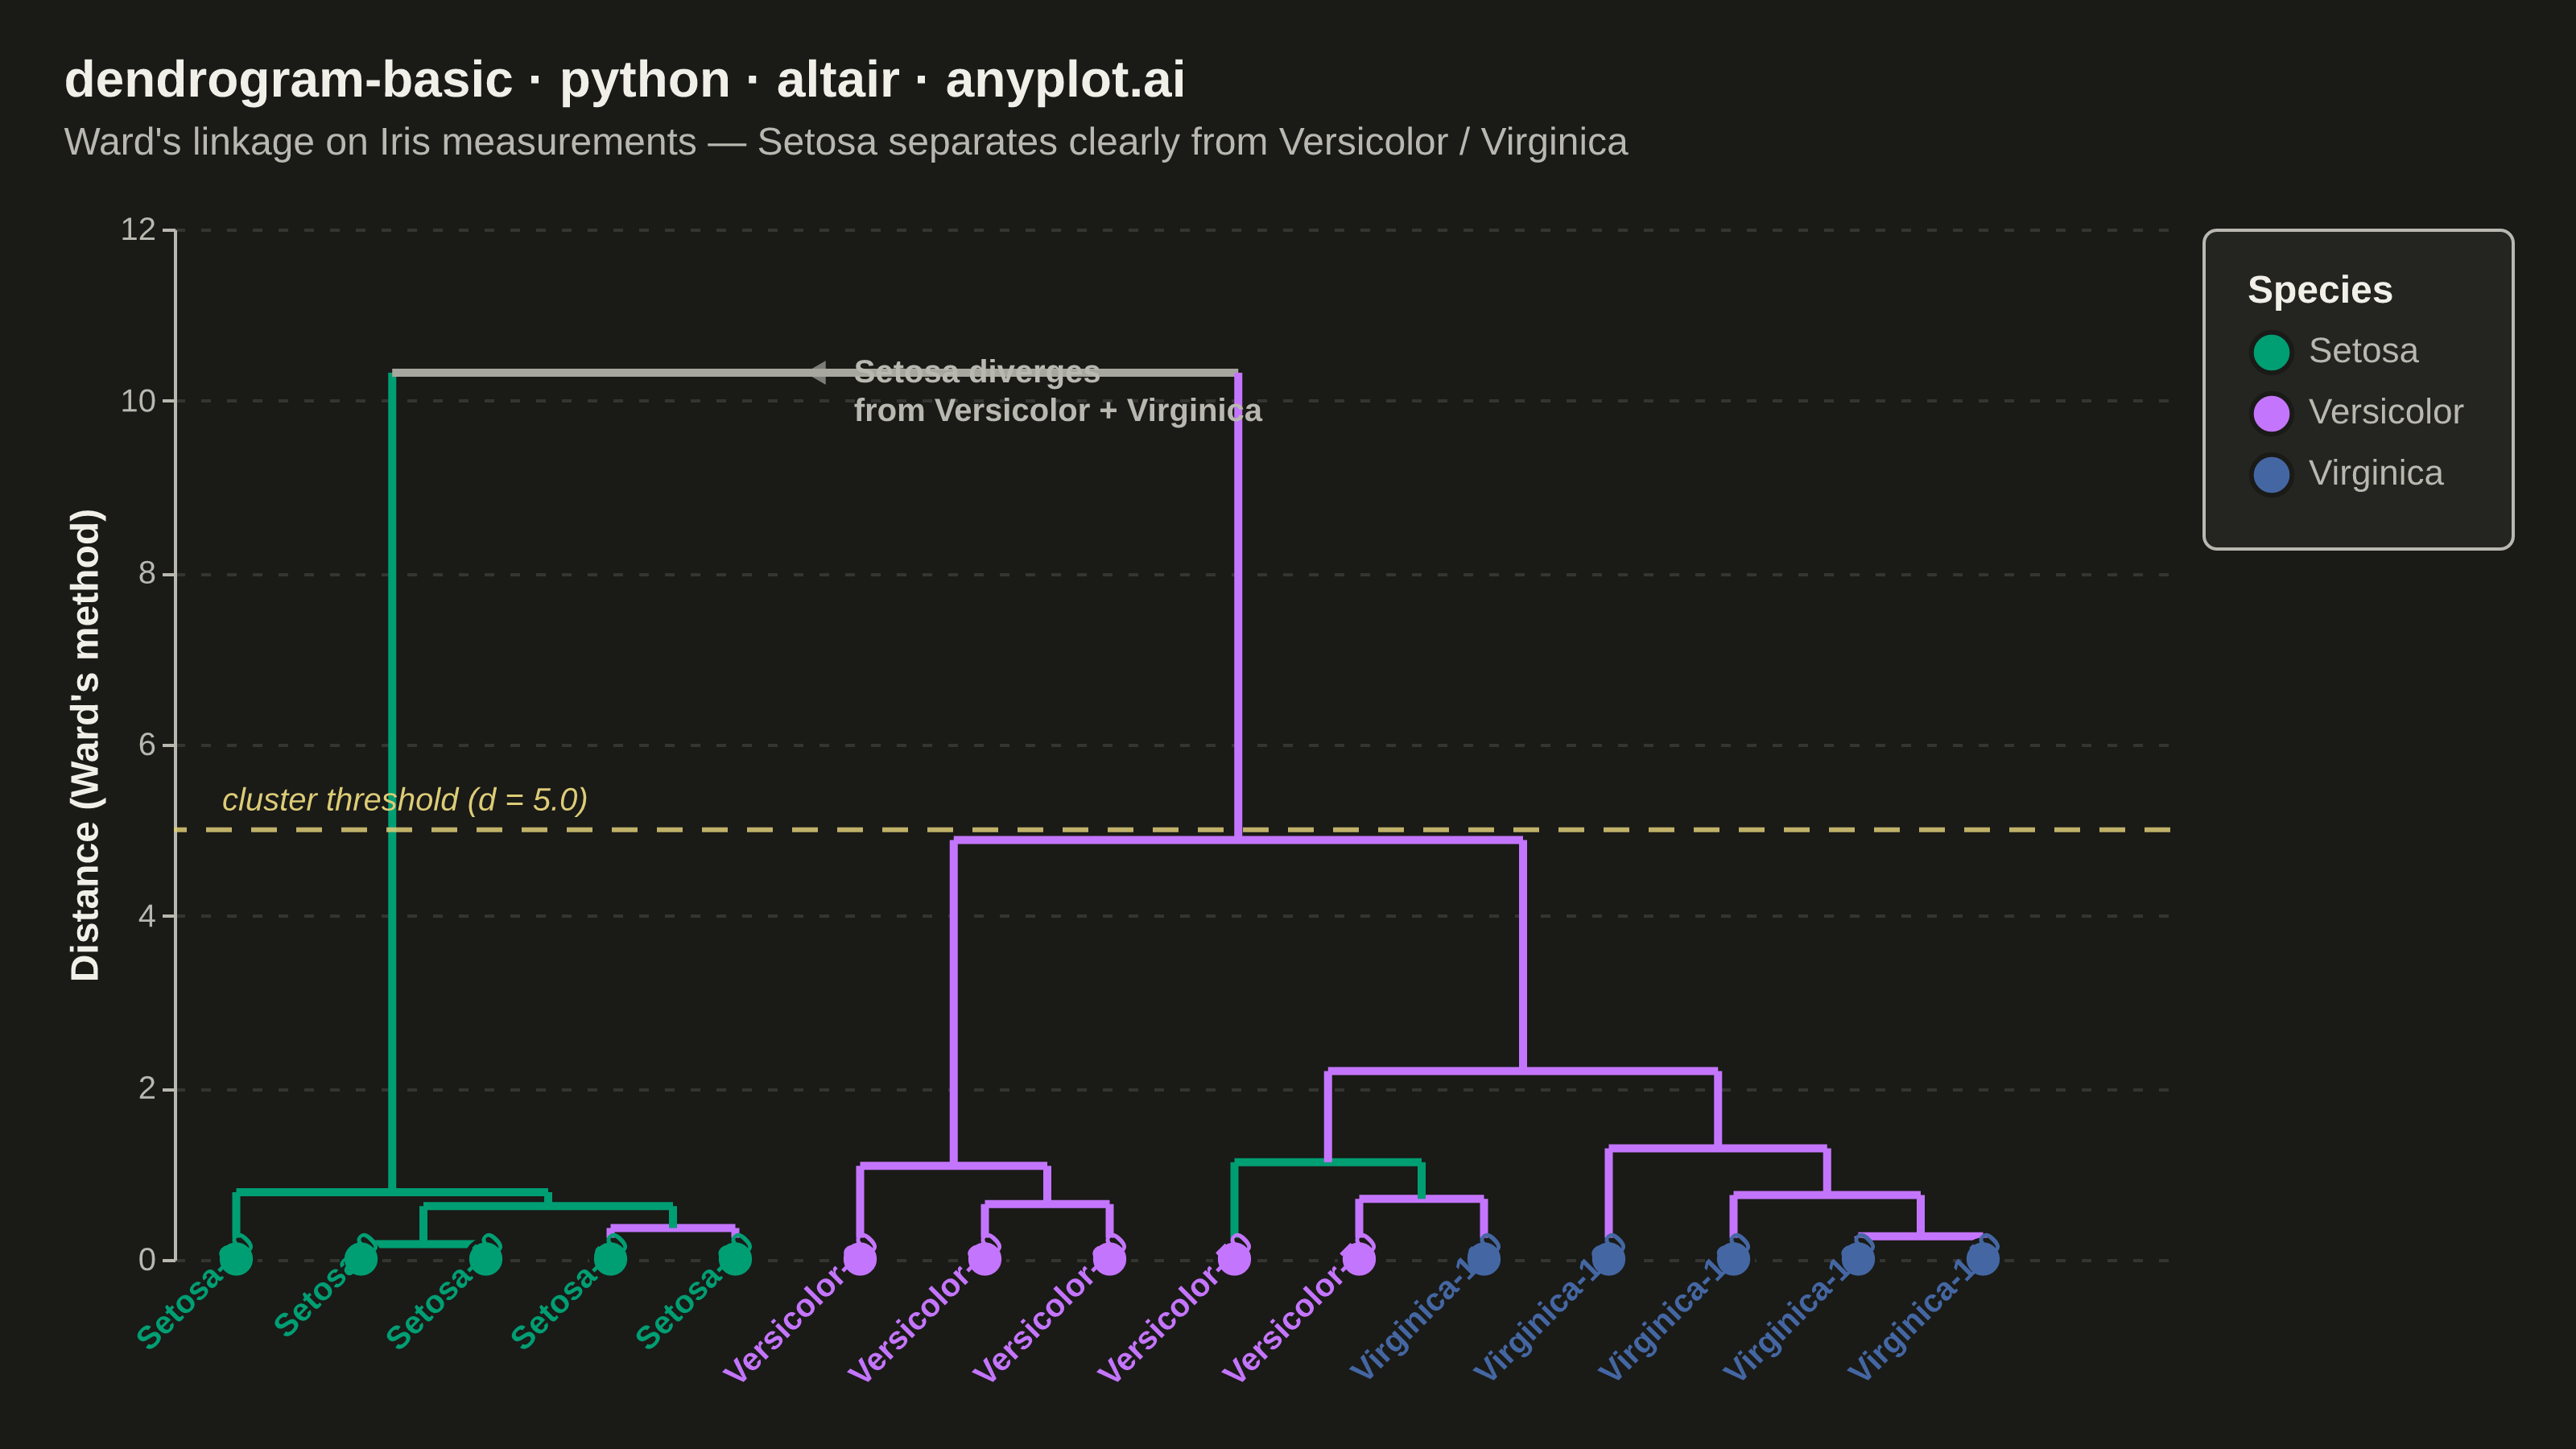
A dendrogram visualizes hierarchical clustering by showing how data points or clusters merge at different distance levels. The tree-like structure reveals relationships and similarity between items, with branch heights indicating the distance at which clusters merge. This visualization is essential for understanding the hierarchical structure in data and identifying natural groupings.
""" anyplot.ai
dendrogram-basic: Basic Dendrogram
Library: altair 6.2.1 | Python 3.13.13
Quality: 90/100 | Updated: 2026-06-18
"""

import os
import sys


# Remove the script directory from sys.path to avoid shadowing the altair package
# (this file is named altair.py — same as the library being imported)
sys.path = [p for p in sys.path if p != sys.path[0]] if len(sys.path) > 1 else sys.path

import altair as alt
import pandas as pd
from PIL import Image
from scipy.cluster.hierarchy import dendrogram, fcluster, linkage
from sklearn.datasets import load_iris


# Theme tokens — Imprint palette, theme-adaptive chrome
THEME = os.getenv("ANYPLOT_THEME", "light")
PAGE_BG = "#FAF8F1" if THEME == "light" else "#1A1A17"
ELEVATED_BG = "#FFFDF6" if THEME == "light" else "#242420"
INK = "#1A1A17" if THEME == "light" else "#F0EFE8"
INK_SOFT = "#4A4A44" if THEME == "light" else "#B8B7B0"
INK_MUTED = "#6B6A63" if THEME == "light" else "#A8A79F"

# Imprint palette positions 1-3 for the three species
SPECIES_COLORS = {
    "Setosa": "#009E73",  # brand green
    "Versicolor": "#C475FD",  # lavender
    "Virginica": "#4467A3",  # blue
}
CLUSTER_COLORS = {1: "#009E73", 2: "#C475FD", 3: "#4467A3"}
ANYPLOT_AMBER = "#DDCC77"  # threshold / warning

# Data — Iris flower measurements (15 samples, 5 per species)
iris = load_iris()
indices = [0, 10, 20, 30, 40, 50, 60, 70, 80, 90, 100, 110, 120, 130, 140]
features = iris.data[indices]
species_names = ["Setosa", "Versicolor", "Virginica"]
labels = [f"{species_names[iris.target[i]]}-{i}" for i in indices]

# Hierarchical clustering with Ward's method
Z = linkage(features, method="ward")
dendro = dendrogram(Z, labels=labels, no_plot=True)

# Cluster membership at distance threshold
distance_threshold = 5.0
cluster_ids = fcluster(Z, t=distance_threshold, criterion="distance")

# Map leaf indices to Imprint colors, propagate through merge nodes
n_leaves = len(labels)
node_colors = {}
for idx in dendro["leaves"]:
    node_colors[idx] = CLUSTER_COLORS.get(cluster_ids[idx], INK_MUTED)

for i, row in enumerate(Z):
    left, right = int(row[0]), int(row[1])
    left_c = node_colors.get(left, INK_MUTED)
    right_c = node_colors.get(right, INK_MUTED)
    node_colors[n_leaves + i] = left_c if left_c == right_c else INK_MUTED

# Extract line segments with per-cluster coloring
segments = []
for merge_idx, (xpts, ypts) in enumerate(zip(dendro["icoord"], dendro["dcoord"], strict=True)):
    merge_height = max(ypts)
    left_node = int(Z[merge_idx, 0])
    right_node = int(Z[merge_idx, 1])
    left_c = node_colors.get(left_node, INK_MUTED)
    right_c = node_colors.get(right_node, INK_MUTED)
    merge_c = left_c if left_c == right_c else INK_MUTED

    segments.append(
        {"x": xpts[0], "y": ypts[0], "x2": xpts[1], "y2": ypts[1], "color": left_c, "distance": round(merge_height, 2)}
    )
    segments.append(
        {"x": xpts[1], "y": ypts[1], "x2": xpts[2], "y2": ypts[2], "color": merge_c, "distance": round(merge_height, 2)}
    )
    segments.append(
        {"x": xpts[2], "y": ypts[2], "x2": xpts[3], "y2": ypts[3], "color": right_c, "distance": round(merge_height, 2)}
    )

segments_df = pd.DataFrame(segments)

# Leaf positions and species assignments
leaf_labels = dendro["ivl"]
leaf_df = pd.DataFrame(
    {
        "x": [5 + 10 * i for i in range(len(leaf_labels))],
        "y_base": [0.0] * len(leaf_labels),
        "label": leaf_labels,
        "species": [lbl.rsplit("-", 1)[0] for lbl in leaf_labels],
    }
)

# Axis domain — tight bounds to reduce empty side space
x_min = min(min(s["x"], s["x2"]) for s in segments) - 3
x_max = max(max(s["x"], s["x2"]) for s in segments) + 3
y_max = Z[:, 2].max() * 1.15

# Annotation at the final (top) merge
top_merge_y = Z[-1, 2]
top_merge_x = (dendro["icoord"][-1][1] + dendro["icoord"][-1][2]) / 2
annotation_df = pd.DataFrame(
    {"x": [top_merge_x], "y": [top_merge_y], "text": ["Setosa diverges\nfrom Versicolor + Virginica"]}
)

# Interactive legend selection
species_selection = alt.selection_point(fields=["species"], bind="legend")

# Dendrogram branches — cluster-colored with merge-distance tooltips
branches = (
    alt.Chart(segments_df)
    .mark_rule(strokeWidth=2.5)
    .encode(
        x=alt.X("x:Q", scale=alt.Scale(domain=[x_min, x_max]), axis=None),
        x2="x2:Q",
        y=alt.Y("y:Q", title="Distance (Ward's method)", scale=alt.Scale(domain=[0, y_max])),
        y2="y2:Q",
        color=alt.Color("color:N", scale=None),
        tooltip=[alt.Tooltip("distance:Q", title="Merge Distance", format=".2f")],
    )
)

# Leaf dots colored by species with interactive opacity
leaf_dots = (
    alt.Chart(leaf_df)
    .mark_point(size=140, filled=True, strokeWidth=1.5, stroke=PAGE_BG)
    .encode(
        x=alt.X("x:Q", scale=alt.Scale(domain=[x_min, x_max]), axis=None),
        y=alt.Y("y_base:Q", scale=alt.Scale(domain=[0, y_max])),
        color=alt.Color(
            "species:N",
            scale=alt.Scale(domain=list(SPECIES_COLORS.keys()), range=list(SPECIES_COLORS.values())),
            legend=alt.Legend(
                title="Species",
                titleFontSize=12,
                titleFontWeight="bold",
                labelFontSize=11,
                symbolSize=160,
                orient="right",
                offset=10,
                titleColor=INK,
                labelColor=INK_SOFT,
            ),
        ),
        tooltip=[alt.Tooltip("label:N", title="Sample"), alt.Tooltip("species:N", title="Species")],
        opacity=alt.condition(species_selection, alt.value(1.0), alt.value(0.15)),
    )
    .add_params(species_selection)
)

# Leaf labels — rotated 315°, sized for the 620×320 inner view (y=305 ≈ bottom of 320px view)
leaf_text = (
    alt.Chart(leaf_df)
    .mark_text(angle=315, align="right", baseline="top", fontSize=10, fontWeight="bold", dx=-3, dy=4)
    .encode(
        x=alt.X("x:Q", scale=alt.Scale(domain=[x_min, x_max]), axis=None),
        y=alt.value(305),
        text="label:N",
        color=alt.Color(
            "species:N",
            scale=alt.Scale(domain=list(SPECIES_COLORS.keys()), range=list(SPECIES_COLORS.values())),
            legend=None,
        ),
        opacity=alt.condition(species_selection, alt.value(1.0), alt.value(0.15)),
    )
)

# Cluster threshold reference line (amber = caution/warning semantic)
threshold_df = pd.DataFrame({"y": [distance_threshold]})
threshold_line = (
    alt.Chart(threshold_df)
    .mark_rule(strokeDash=[8, 6], strokeWidth=1.5, color=ANYPLOT_AMBER, opacity=0.85)
    .encode(y="y:Q")
)
threshold_label = (
    alt.Chart(threshold_df)
    .mark_text(align="left", baseline="bottom", fontSize=10, color=ANYPLOT_AMBER, fontStyle="italic", dx=5, dy=-4)
    .encode(x=alt.value(10), y="y:Q", text=alt.value("cluster threshold (d = 5.0)"))
)

# Annotation at top merge
top_annotation = (
    alt.Chart(annotation_df)
    .mark_text(align="left", baseline="middle", fontSize=10, fontWeight="bold", color=INK_SOFT, lineBreak="\n", dx=12)
    .encode(x="x:Q", y="y:Q", text="text:N")
)
top_arrow = (
    alt.Chart(annotation_df)
    .mark_point(shape="triangle-left", size=55, filled=True, color=INK_MUTED)
    .encode(x="x:Q", y="y:Q")
)

# Compose chart — landscape inner view 620×320, scale_factor=4 → ~3200×1800 after PIL pad
chart = (
    alt.layer(branches, threshold_line, threshold_label, leaf_dots, leaf_text, top_arrow, top_annotation)
    .properties(
        width=620,
        height=320,
        background=PAGE_BG,
        title=alt.Title(
            "dendrogram-basic · python · altair · anyplot.ai",
            subtitle="Ward's linkage on Iris measurements — Setosa separates clearly from Versicolor / Virginica",
            fontSize=16,
            subtitleFontSize=12,
            subtitleColor=INK_SOFT,
            color=INK,
            anchor="start",
            offset=16,
        ),
    )
    .configure_view(fill=PAGE_BG, strokeWidth=0)
    .configure_axis(
        labelFontSize=10,
        titleFontSize=12,
        titleColor=INK,
        labelColor=INK_SOFT,
        gridOpacity=0.12,
        gridDash=[3, 5],
        gridColor=INK,
        domainColor=INK_SOFT,
        domainWidth=1.0,
        tickColor=INK_SOFT,
        tickSize=4,
    )
    .configure_legend(
        padding=14, cornerRadius=4, strokeColor=INK_SOFT, fillColor=ELEVATED_BG, labelColor=INK_SOFT, titleColor=INK
    )
    .configure_title(subtitlePadding=6)
)

# Save — scale_factor=4.0, then PIL-pad to exact 3200×1800
TW, TH = 3200, 1800
chart.save(f"plot-{THEME}.png", scale_factor=4.0)
_img = Image.open(f"plot-{THEME}.png").convert("RGB")
_w, _h = _img.size
if _w > TW or _h > TH:
    raise SystemExit(
        f"altair vl-convert produced {_w}×{_h}, exceeds target {TW}×{TH}. "
        f"Shrink chart .properties(width=, height=) values and re-render."
    )
if _w < TW or _h < TH:
    _canvas = Image.new("RGB", (TW, TH), PAGE_BG)
    _canvas.paste(_img, ((TW - _w) // 2, (TH - _h) // 2))
    _canvas.save(f"plot-{THEME}.png")

chart.save(f"plot-{THEME}.html")
Runnable source as JSON, for any HTTP client: https://api.anyplot.ai/specs/dendrogram-basic/altair/code. Any spec id and library id listed in llms-full.txt fit the same URL shape; every URL below is complete and callable.
{
  "spec_id": "dendrogram-basic",
  "language": "python",
  "library": "altair",
  "page": "https://anyplot.ai/dendrogram-basic/python/altair",
  "hub": "https://anyplot.ai/dendrogram-basic",
  "code_json": "https://api.anyplot.ai/specs/dendrogram-basic/altair/code",
  "spec_json": "https://api.anyplot.ai/specs/dendrogram-basic",
  "render_light_png": "https://storage.googleapis.com/anyplot-images/plots/dendrogram-basic/python/altair/plot-light.png",
  "render_dark_png": "https://storage.googleapis.com/anyplot-images/plots/dendrogram-basic/python/altair/plot-dark.png",
  "interactive_light_html": "https://storage.googleapis.com/anyplot-images/plots/dendrogram-basic/python/altair/plot-light.html",
  "interactive_dark_html": "https://storage.googleapis.com/anyplot-images/plots/dendrogram-basic/python/altair/plot-dark.html",
  "quality_score": 90.0,
  "license": "MIT",
  "guide": "https://anyplot.ai/llms.txt"
}
Part of Basic Dendrogram on anyplot.ai.