The same plot in 14 other libraries — JavaScript: Chart.js, D3.js, Apache ECharts, MUI X Charts; Python: Altair, Bokeh, lets-plot, Matplotlib, Plotly, plotnine, Pygal, Seaborn; R: ggplot2; Julia: Makie.jl. Compare all 15 side by side: Regression Diagnostic Panel (Four-Plot Display) in Python, R, Julia and JavaScript.
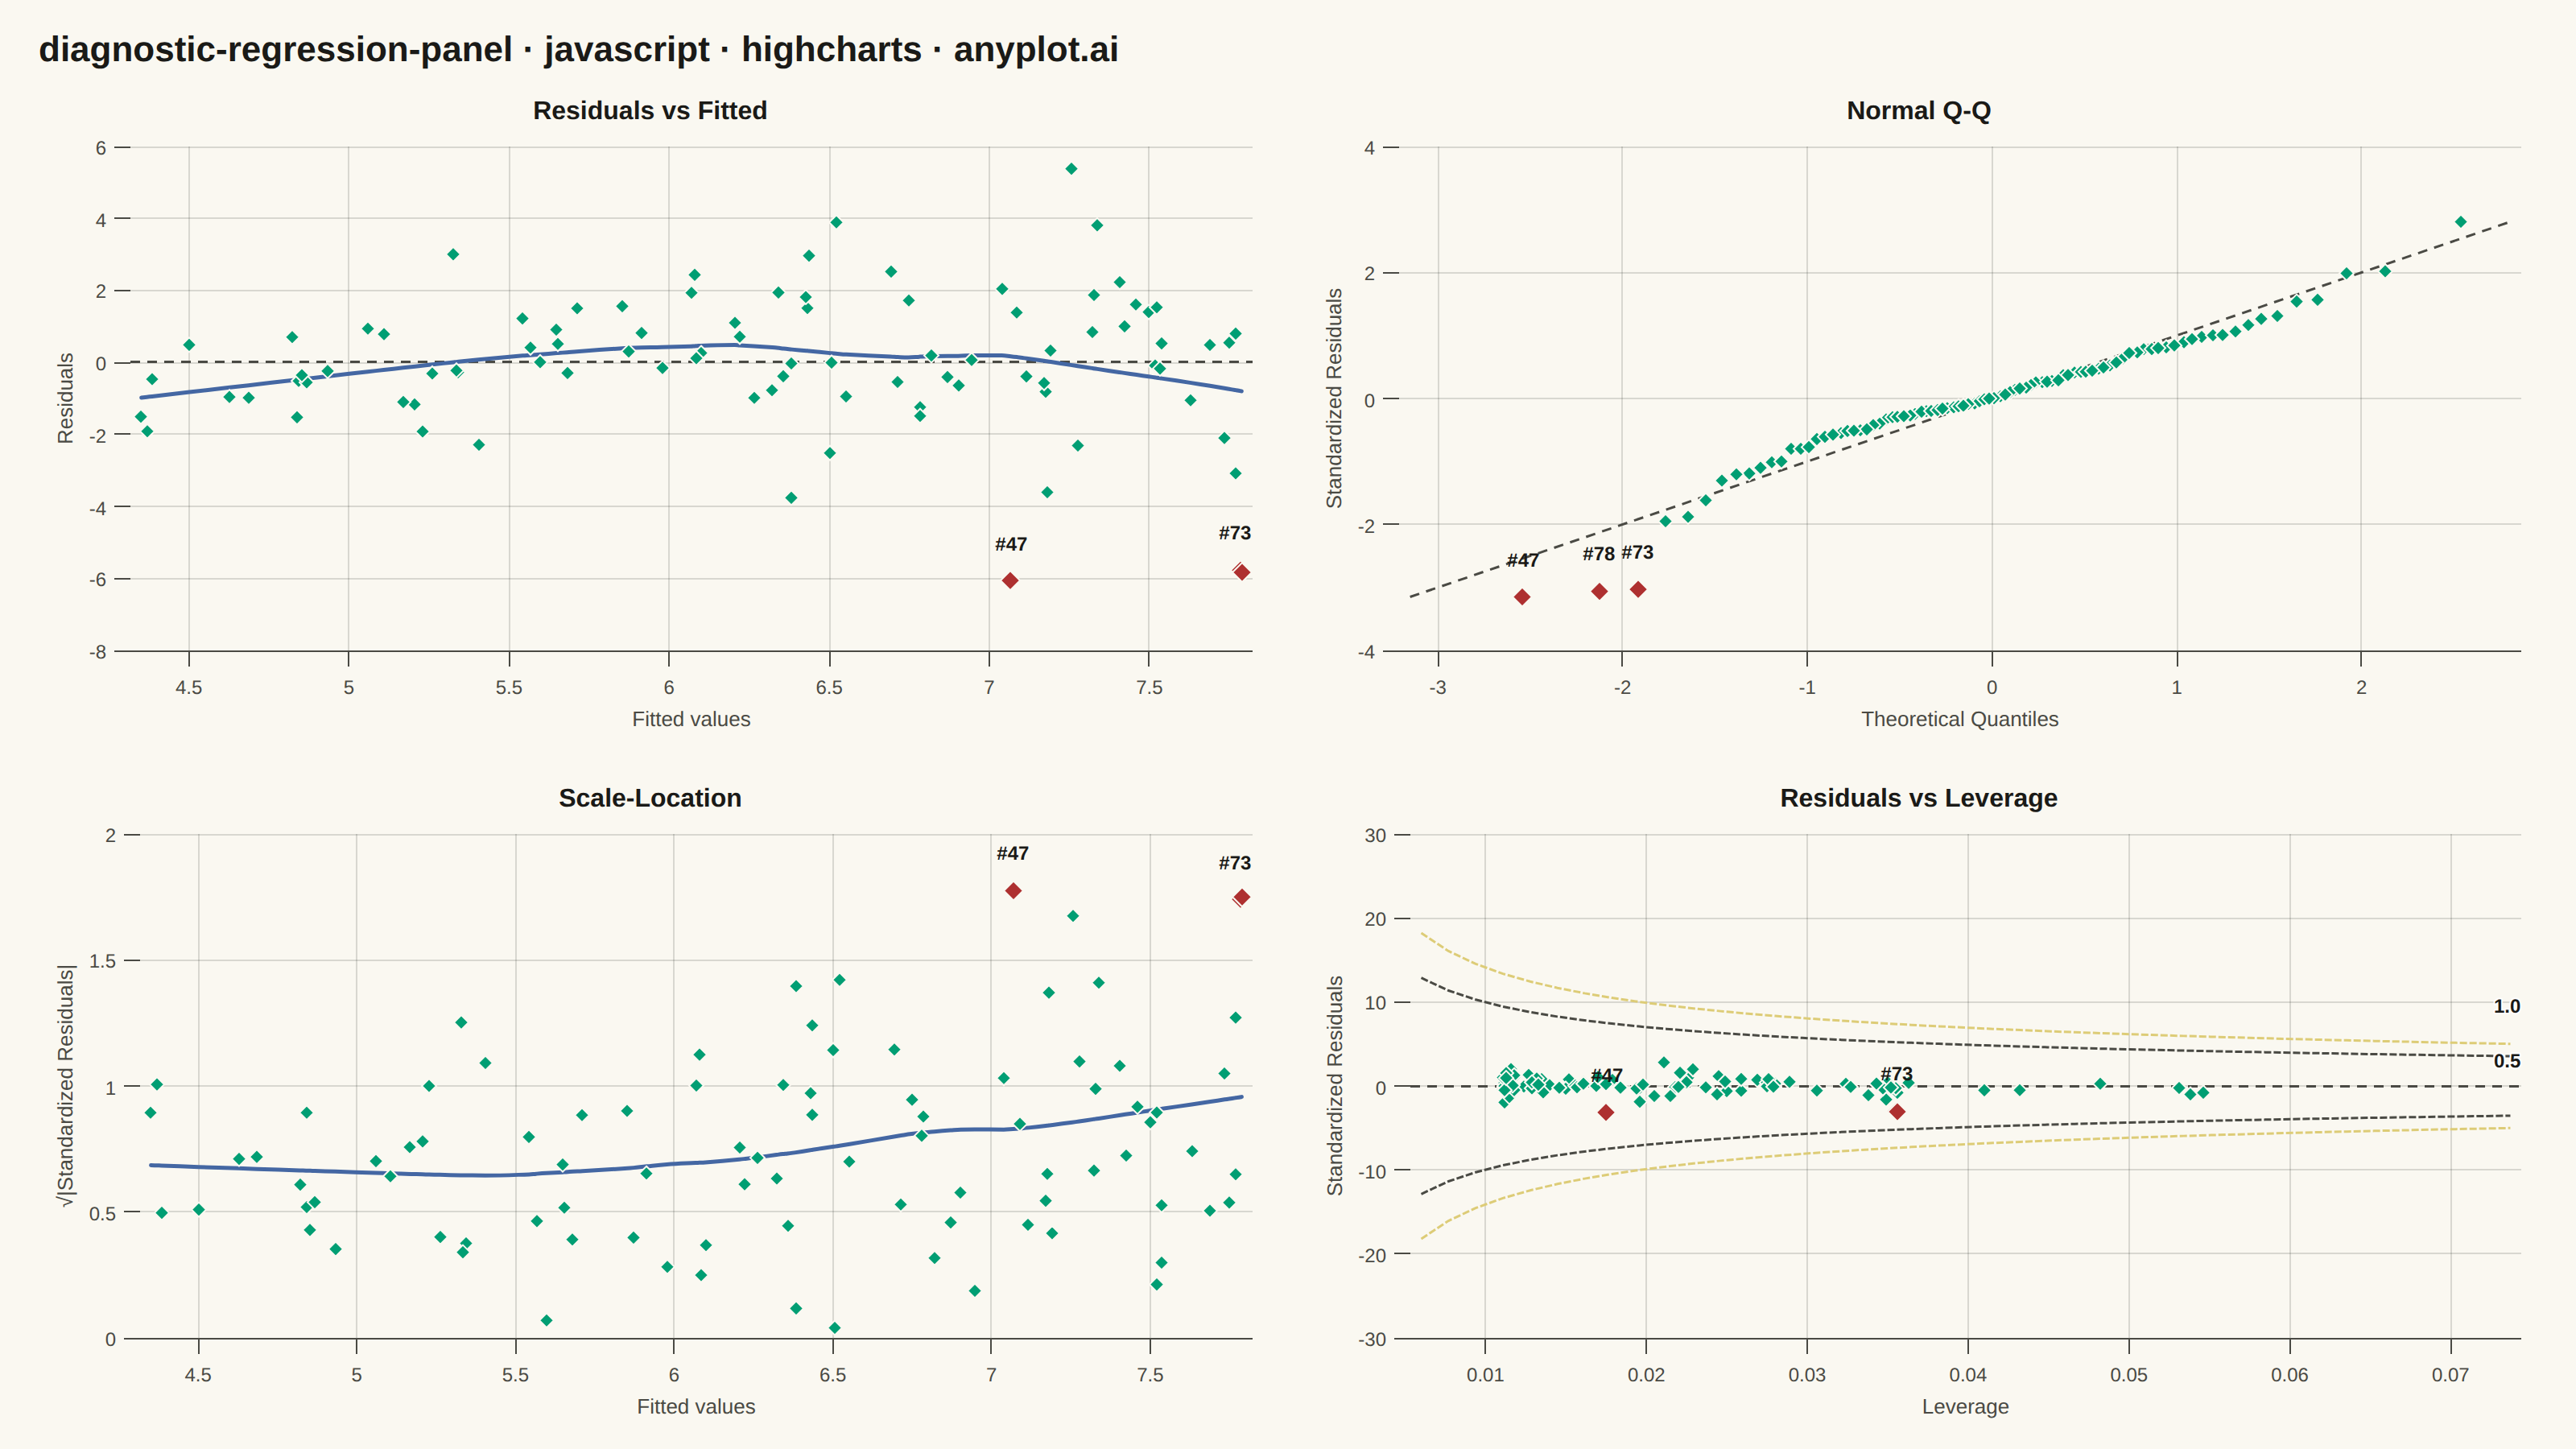
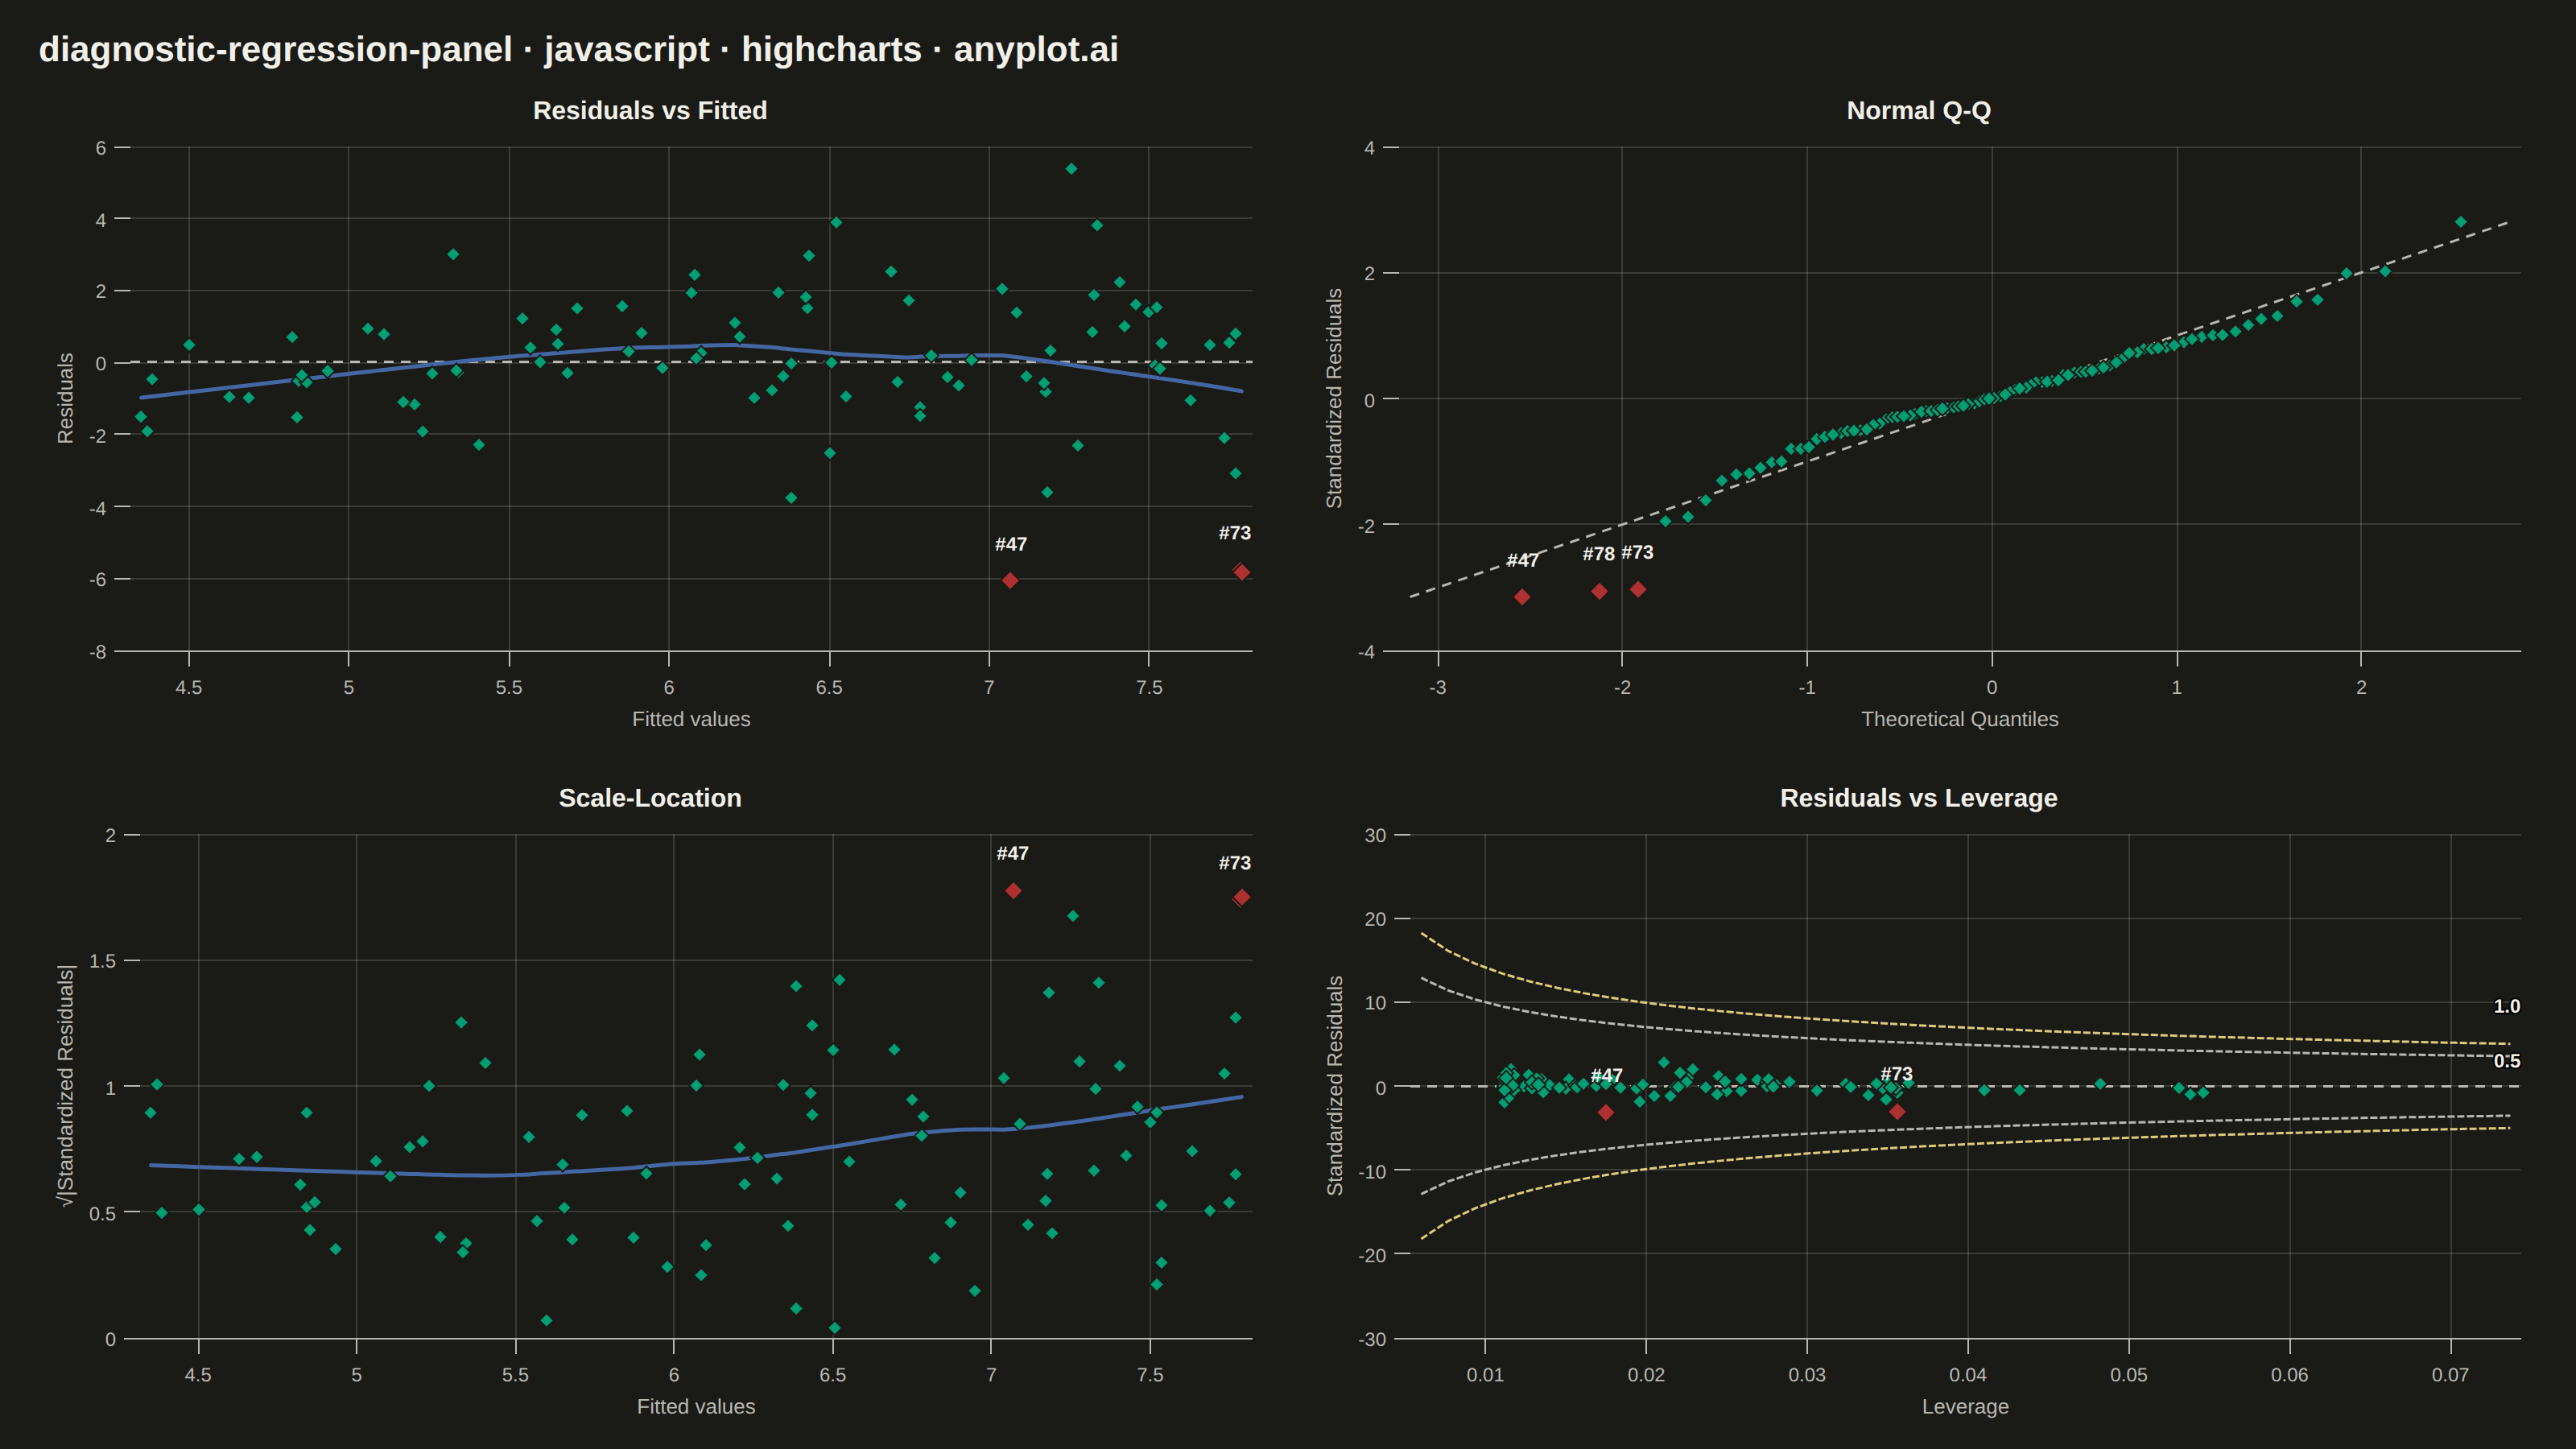
A 2x2 panel of diagnostic plots for evaluating linear regression model assumptions, replicating the classic output of R's `plot(lm)`. The four subplots are: (1) Residuals vs Fitted values to detect non-linearity and heteroscedasticity, (2) Normal Q-Q plot of standardized residuals to assess normality, (3) Scale-Location plot (square root of standardized residuals vs fitted values) to check homoscedasticity, and (4) Residuals vs Leverage with Cook's distance contours to identify influential observations. This composite display is the standard first step in regression model validation across statistics, academia, and regulated industries.
// anyplot.ai
// diagnostic-regression-panel: Regression Diagnostic Panel (Four-Plot Display)
// Library: highcharts 12.6.0 | JavaScript 22.23.2
// Quality: 86/100 | Created: 2026-09-05

const t = window.ANYPLOT_TOKENS;

// --- Data: fit a simple linear model that omits real curvature + heteroscedasticity,
//     so the diagnostics below have something genuine to reveal (fixed-seed LCG,
//     Box-Muller normal — no seeded RNG in the browser) -----------------------------
function lcg(seed) {
  let s = seed;
  return () => {
    s = (s * 1664525 + 1013904223) % 4294967296;
    return s / 4294967296;
  };
}
const rand = lcg(20260905);
function randNormal() {
  const u1 = Math.max(rand(), 1e-12);
  const u2 = rand();
  return Math.sqrt(-2 * Math.log(u1)) * Math.cos(2 * Math.PI * u2);
}

const n = 90;
const fertilizerKgHa = [];
const yieldTonnesHa = [];
for (let i = 0; i < n; i++) {
  const x = 10 + 190 * rand();
  const noiseSd = 0.4 + 0.012 * x;
  const trueYield = 2.5 + 0.055 * x - 0.00016 * x * x; // diminishing returns
  fertilizerKgHa.push(x);
  yieldTonnesHa.push(trueYield + randNormal() * noiseSd);
}

// --- Linear regression yield ~ fertilizer, plus diagnostic quantities --------------
const meanX = fertilizerKgHa.reduce((a, b) => a + b, 0) / n;
const meanY = yieldTonnesHa.reduce((a, b) => a + b, 0) / n;
let sxy = 0;
let sxx = 0;
for (let i = 0; i < n; i++) {
  sxy += (fertilizerKgHa[i] - meanX) * (yieldTonnesHa[i] - meanY);
  sxx += (fertilizerKgHa[i] - meanX) ** 2;
}
const slope = sxy / sxx;
const intercept = meanY - slope * meanX;
const p = 2; // fitted parameters: intercept + slope

const fitted = fertilizerKgHa.map((x) => intercept + slope * x);
const residuals = yieldTonnesHa.map((y, i) => y - fitted[i]);
const leverage = fertilizerKgHa.map((x) => 1 / n + (x - meanX) ** 2 / sxx);
const sse = residuals.reduce((sum, r) => sum + r * r, 0);
const s = Math.sqrt(sse / (n - p));
const stdResiduals = residuals.map((r, i) => r / (s * Math.sqrt(1 - leverage[i])));
const cooksD = stdResiduals.map((e, i) => (e * e * leverage[i]) / (p * (1 - leverage[i])));
const sqrtAbsStdResiduals = stdResiduals.map((e) => Math.sqrt(Math.abs(e)));

const influential = new Set(
  [...cooksD.keys()].sort((a, b) => cooksD[b] - cooksD[a]).slice(0, 3)
);

// Normal Q-Q: theoretical quantiles aligned back to each observation's own index,
// so the same 3 influential observations can be labeled consistently in every panel.
const rankOf = [...stdResiduals.keys()].sort((a, b) => stdResiduals[a] - stdResiduals[b]);
const theoreticalQ = new Array(n);
rankOf.forEach((obsIdx, rank) => {
  theoreticalQ[obsIdx] = normInv((rank + 0.5) / n);
});
function normInv(prob) {
  // Acklam's rational approximation of the inverse standard normal CDF.
  const a = [-3.969683028665376e1, 2.209460984245205e2, -2.759285104469687e2, 1.383577518672690e2, -3.066479806614716e1, 2.506628277459239e0];
  const b = [-5.447609879822406e1, 1.615858368580409e2, -1.556989798598866e2, 6.680131188771972e1, -1.328068155288572e1];
  const c = [-7.784894002430293e-3, -3.223964580411365e-1, -2.400758277161838e0, -2.549732539343734e0, 4.374664141464968e0, 2.938163982698783e0];
  const d = [7.784695709041462e-3, 3.224671290700398e-1, 2.445134137142996e0, 3.754408661907416e0];
  const pLow = 0.02425;
  if (prob < pLow) {
    const q = Math.sqrt(-2 * Math.log(prob));
    return (((((c[0] * q + c[1]) * q + c[2]) * q + c[3]) * q + c[4]) * q + c[5]) /
      ((((d[0] * q + d[1]) * q + d[2]) * q + d[3]) * q + 1);
  }
  if (prob <= 1 - pLow) {
    const q = prob - 0.5;
    const r = q * q;
    return (((((a[0] * r + a[1]) * r + a[2]) * r + a[3]) * r + a[4]) * r + a[5]) * q /
      (((((b[0] * r + b[1]) * r + b[2]) * r + b[3]) * r + b[4]) * r + 1);
  }
  const q = Math.sqrt(-2 * Math.log(1 - prob));
  return -(((((c[0] * q + c[1]) * q + c[2]) * q + c[3]) * q + c[4]) * q + c[5]) /
    ((((d[0] * q + d[1]) * q + d[2]) * q + d[3]) * q + 1);
}

// Cleveland LOWESS (degree-1, tricube weights, no robustness iterations) -----------
function lowess(xs, ys, frac) {
  const bandwidth = Math.max(3, Math.round(frac * xs.length));
  return xs.map((x0) => {
    const dist = xs.map((x) => Math.abs(x - x0));
    const h = [...dist].sort((a, b) => a - b)[bandwidth - 1] || 1;
    let sw = 0;
    let swx = 0;
    let swy = 0;
    let swxx = 0;
    let swxy = 0;
    for (let i = 0; i < xs.length; i++) {
      const u = Math.min(dist[i] / h, 1);
      const w = (1 - u ** 3) ** 3;
      sw += w;
      swx += w * xs[i];
      swy += w * ys[i];
      swxx += w * xs[i] * xs[i];
      swxy += w * xs[i] * ys[i];
    }
    const denom = sw * swxx - swx * swx;
    const localSlope = denom !== 0 ? (sw * swxy - swx * swy) / denom : 0;
    const localIntercept = (swy - localSlope * swx) / sw;
    return localIntercept + localSlope * x0;
  });
}
function smoothCurve(xs, ys) {
  const smoothed = lowess(xs, ys, 0.6);
  return xs
    .map((x, i) => [x, smoothed[i]])
    .sort((a, b) => a[0] - b[0]);
}

function cookContour(cooksLevel, hMax) {
  const steps = 40;
  const hMin = 0.006;
  const pos = [];
  for (let k = 0; k <= steps; k++) {
    const h = hMin + ((hMax - hMin) * k) / steps;
    const e = Math.sqrt((cooksLevel * p * (1 - h)) / h);
    pos.push([h, e]);
  }
  const neg = pos.map(([h, e]) => [h, -e]);
  return { pos, neg };
}

// --- Shared point styling across all four subplots --------------------------------
const MARKER_RADIUS = 4.5;
function scatterPoints(xs, ys) {
  return xs.map((x, i) => {
    const point = { x, y: ys[i] };
    if (influential.has(i)) {
      point.marker = { symbol: "diamond", radius: MARKER_RADIUS + 1.5, fillColor: t.palette[4], lineColor: t.pageBg, lineWidth: 1 };
      point.dataLabels = {
        enabled: true,
        format: `#${i}`,
        y: -12,
        style: { color: t.ink, fontSize: "12px", fontWeight: "600", textOutline: "none" },
      };
    }
    return point;
  });
}
const BASE_MARKER = { symbol: "diamond", radius: MARKER_RADIUS, fillColor: t.palette[0], lineColor: t.pageBg, lineWidth: 1 };

// --- Shared chart chrome ------------------------------------------------------------
function baseOptions(panelTitle, xTitle, yTitle) {
  return {
    chart: { type: "scatter", backgroundColor: "transparent", animation: false,
             spacing: [10, 14, 10, 10], style: { fontFamily: "inherit" } },
    credits: { enabled: false },
    title: { text: panelTitle, style: { color: t.ink, fontSize: "16px", fontWeight: "600" }, margin: 12 },
    xAxis: { title: { text: xTitle, style: { color: t.inkSoft, fontSize: "13px" } },
             lineColor: t.inkSoft, tickColor: t.inkSoft, gridLineColor: t.grid, gridLineWidth: 1,
             labels: { style: { color: t.inkSoft, fontSize: "12px" } } },
    yAxis: { title: { text: yTitle, style: { color: t.inkSoft, fontSize: "13px" } },
             gridLineColor: t.grid, lineColor: t.inkSoft, tickColor: t.inkSoft, tickWidth: 1,
             labels: { style: { color: t.inkSoft, fontSize: "12px" } } },
    legend: { enabled: false },
    plotOptions: { series: { animation: false } },
    tooltip: {
      enabled: true,
      formatter: function () {
        return `${xTitle}: ${this.x.toFixed(2)}<br/>${yTitle}: ${this.y.toFixed(2)}`;
      },
    },
  };
}

// Panel 1 — Residuals vs Fitted: reveals non-linearity + heteroscedasticity ---------
const panel1 = baseOptions("Residuals vs Fitted", "Fitted values", "Residuals");
panel1.yAxis.plotLines = [{ value: 0, color: t.inkSoft, dashStyle: "Dash", width: 1.5, zIndex: 2 }];
panel1.series = [
  { name: "LOWESS", type: "spline", data: smoothCurve(fitted, residuals),
    color: t.palette[2], lineWidth: 2.5, marker: { enabled: false }, enableMouseTracking: false },
  { name: "Residuals", data: scatterPoints(fitted, residuals), marker: BASE_MARKER },
];

// Panel 2 — Normal Q-Q: standardized residuals vs theoretical normal quantiles -----
const panel2 = baseOptions("Normal Q-Q", "Theoretical Quantiles", "Standardized Residuals");
const qMin = Math.min(...theoreticalQ, ...stdResiduals);
const qMax = Math.max(...theoreticalQ, ...stdResiduals);
panel2.series = [
  { name: "45° reference", type: "line", data: [[qMin, qMin], [qMax, qMax]],
    color: t.inkSoft, dashStyle: "Dash", lineWidth: 1.5, marker: { enabled: false }, enableMouseTracking: false },
  { name: "Std. Residuals", data: scatterPoints(theoreticalQ, stdResiduals), marker: BASE_MARKER },
];

// Panel 3 — Scale-Location: spread of residuals across the fitted range -------------
const panel3 = baseOptions("Scale-Location", "Fitted values", "√|Standardized Residuals|");
panel3.series = [
  { name: "LOWESS", type: "spline", data: smoothCurve(fitted, sqrtAbsStdResiduals),
    color: t.palette[2], lineWidth: 2.5, marker: { enabled: false }, enableMouseTracking: false },
  { name: "√|Std. Resid.|", data: scatterPoints(fitted, sqrtAbsStdResiduals), marker: BASE_MARKER },
];

// Panel 4 — Residuals vs Leverage: Cook's distance contours flag influence ----------
const panel4 = baseOptions("Residuals vs Leverage", "Leverage", "Standardized Residuals");
const hMax = Math.min(0.96, Math.max(...leverage) * 1.35);
const cook05 = cookContour(0.5, hMax);
const cook10 = cookContour(1.0, hMax);
// Label text always renders in the high-contrast ink color (never the line's own
// accent hue — amber-on-cream fails legibility) with a page-bg halo, and each
// label gets a forced y-offset so the two contour labels never crowd each other
// even where the D=0.5 and D=1.0 curves converge near the right edge.
function labelLast(curve, text, yOffset) {
  const points = curve.map(([h, e]) => [h, e]);
  const last = points.length - 1;
  points[last] = {
    x: points[last][0],
    y: points[last][1],
    dataLabels: { enabled: true, format: text, align: "left", x: 6, y: yOffset,
                  style: { color: t.ink, fontSize: "12px", fontWeight: "700" },
                  textOutline: `3px ${t.pageBg}` },
  };
  return points;
}
panel4.yAxis.plotLines = [{ value: 0, color: t.inkSoft, dashStyle: "Dash", width: 1.5, zIndex: 2 }];
panel4.series = [
  { name: "Cook's D = 0.5", type: "line", data: labelLast(cook05.pos, "0.5", 14),
    color: t.inkSoft, dashStyle: "ShortDash", lineWidth: 1.5, marker: { enabled: false }, enableMouseTracking: false },
  { name: "Cook's D = 0.5 (neg)", type: "line", data: cook05.neg,
    color: t.inkSoft, dashStyle: "ShortDash", lineWidth: 1.5, marker: { enabled: false }, enableMouseTracking: false },
  { name: "Cook's D = 1.0", type: "line", data: labelLast(cook10.pos, "1.0", -12),
    color: t.amber, dashStyle: "ShortDash", lineWidth: 1.5, marker: { enabled: false }, enableMouseTracking: false },
  { name: "Cook's D = 1.0 (neg)", type: "line", data: cook10.neg,
    color: t.amber, dashStyle: "ShortDash", lineWidth: 1.5, marker: { enabled: false }, enableMouseTracking: false },
  { name: "Residuals", data: scatterPoints(leverage, stdResiduals), marker: BASE_MARKER },
];

// --- Layout: shared header + 2x2 grid of independently-mounted Highcharts panels ---
const root = document.getElementById("container");

const header = document.createElement("div");
header.style.cssText = `padding:18px 24px 4px; font-size:22px; font-weight:600; color:${t.ink}; font-family:inherit;`;
header.textContent = "diagnostic-regression-panel · javascript · highcharts · anyplot.ai";
root.appendChild(header);

const grid = document.createElement("div");
grid.style.cssText =
  "display:grid; grid-template-columns:1fr 1fr; grid-template-rows:1fr 1fr; " +
  "gap:16px; margin:4px 20px 20px; height:calc(100% - 62px);";
root.appendChild(grid);

const panelIds = ["panel-resid-fitted", "panel-qq", "panel-scale-location", "panel-resid-leverage"];
panelIds.forEach((id) => {
  const cell = document.createElement("div");
  cell.id = id;
  grid.appendChild(cell);
});

Highcharts.chart("panel-resid-fitted", panel1);
Highcharts.chart("panel-qq", panel2);
Highcharts.chart("panel-scale-location", panel3);
Highcharts.chart("panel-resid-leverage", panel4);
Runnable source as JSON, for any HTTP client: https://api.anyplot.ai/specs/diagnostic-regression-panel/highcharts/code. Any spec id and library id listed in llms-full.txt fit the same URL shape; every URL below is complete and callable.
{
  "spec_id": "diagnostic-regression-panel",
  "language": "javascript",
  "library": "highcharts",
  "page": "https://anyplot.ai/diagnostic-regression-panel/javascript/highcharts",
  "hub": "https://anyplot.ai/diagnostic-regression-panel",
  "code_json": "https://api.anyplot.ai/specs/diagnostic-regression-panel/highcharts/code",
  "spec_json": "https://api.anyplot.ai/specs/diagnostic-regression-panel",
  "render_light_png": "https://storage.googleapis.com/anyplot-images/plots/diagnostic-regression-panel/javascript/highcharts/plot-light.png",
  "render_dark_png": "https://storage.googleapis.com/anyplot-images/plots/diagnostic-regression-panel/javascript/highcharts/plot-dark.png",
  "interactive_light_html": "https://storage.googleapis.com/anyplot-images/plots/diagnostic-regression-panel/javascript/highcharts/plot-light.html",
  "interactive_dark_html": "https://storage.googleapis.com/anyplot-images/plots/diagnostic-regression-panel/javascript/highcharts/plot-dark.html",
  "quality_score": 86.0,
  "license": "MIT",
  "guide": "https://anyplot.ai/llms.txt"
}
Part of Regression Diagnostic Panel (Four-Plot Display) on anyplot.ai.