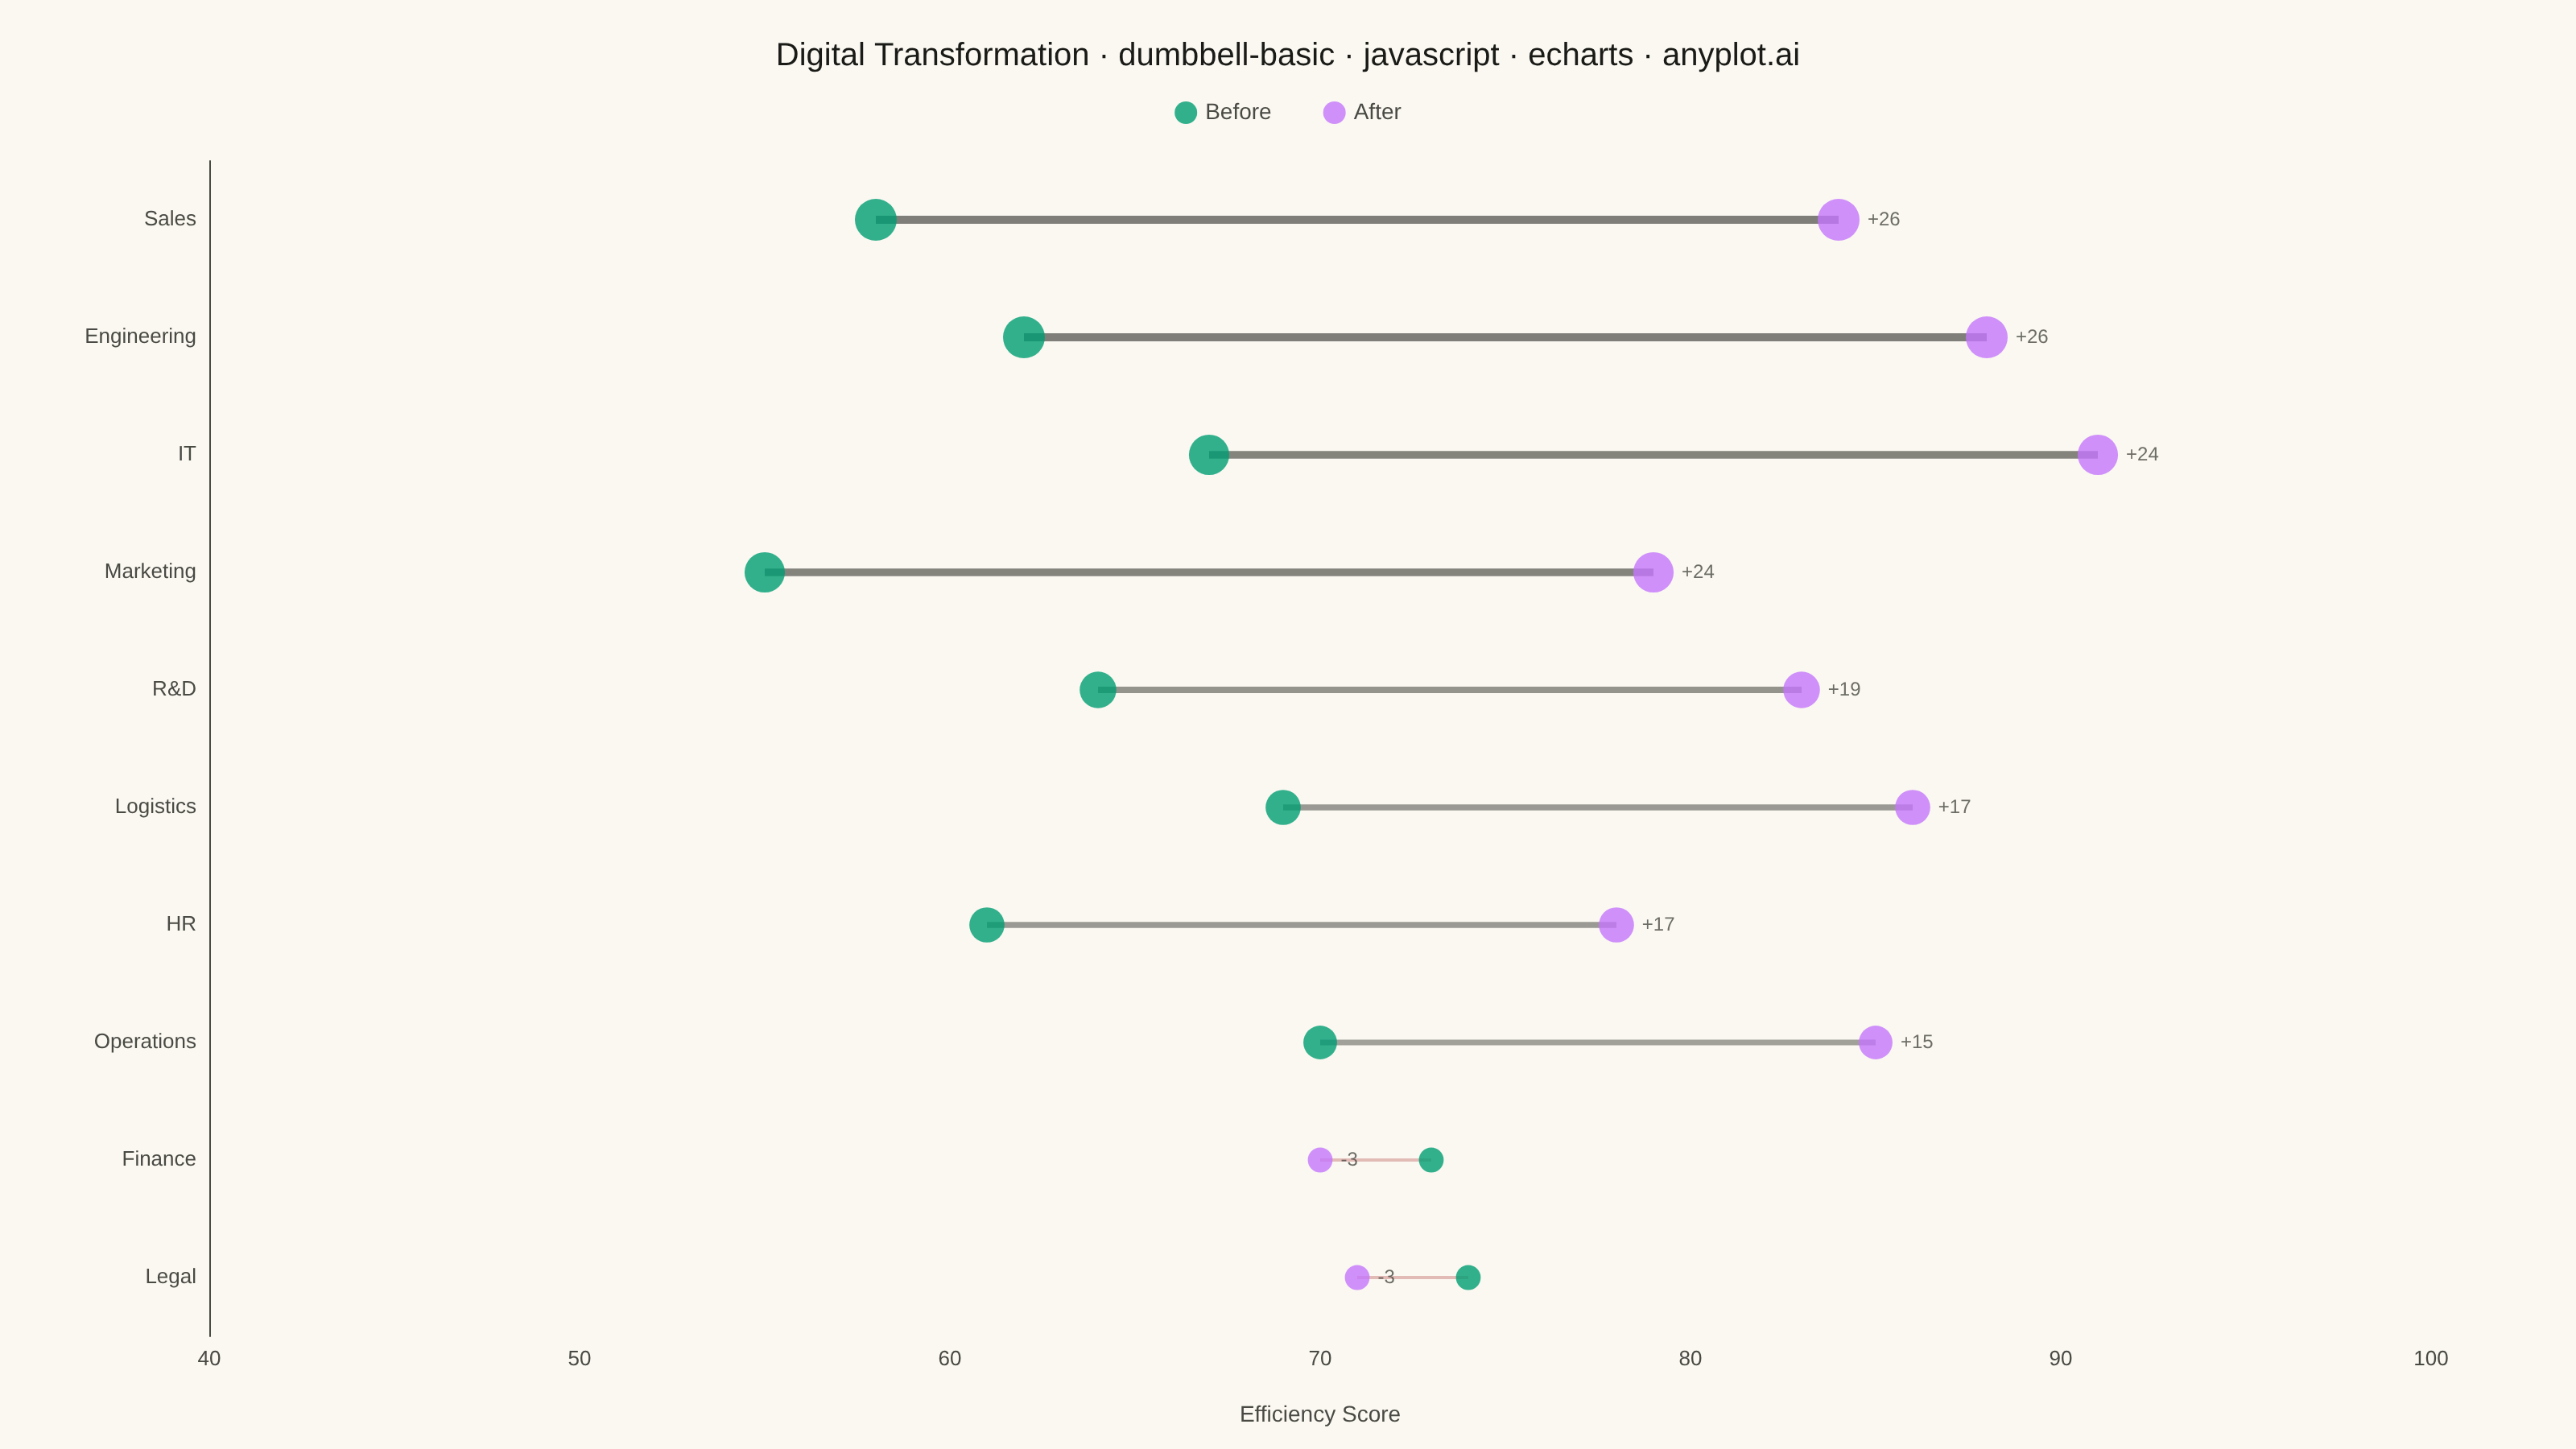
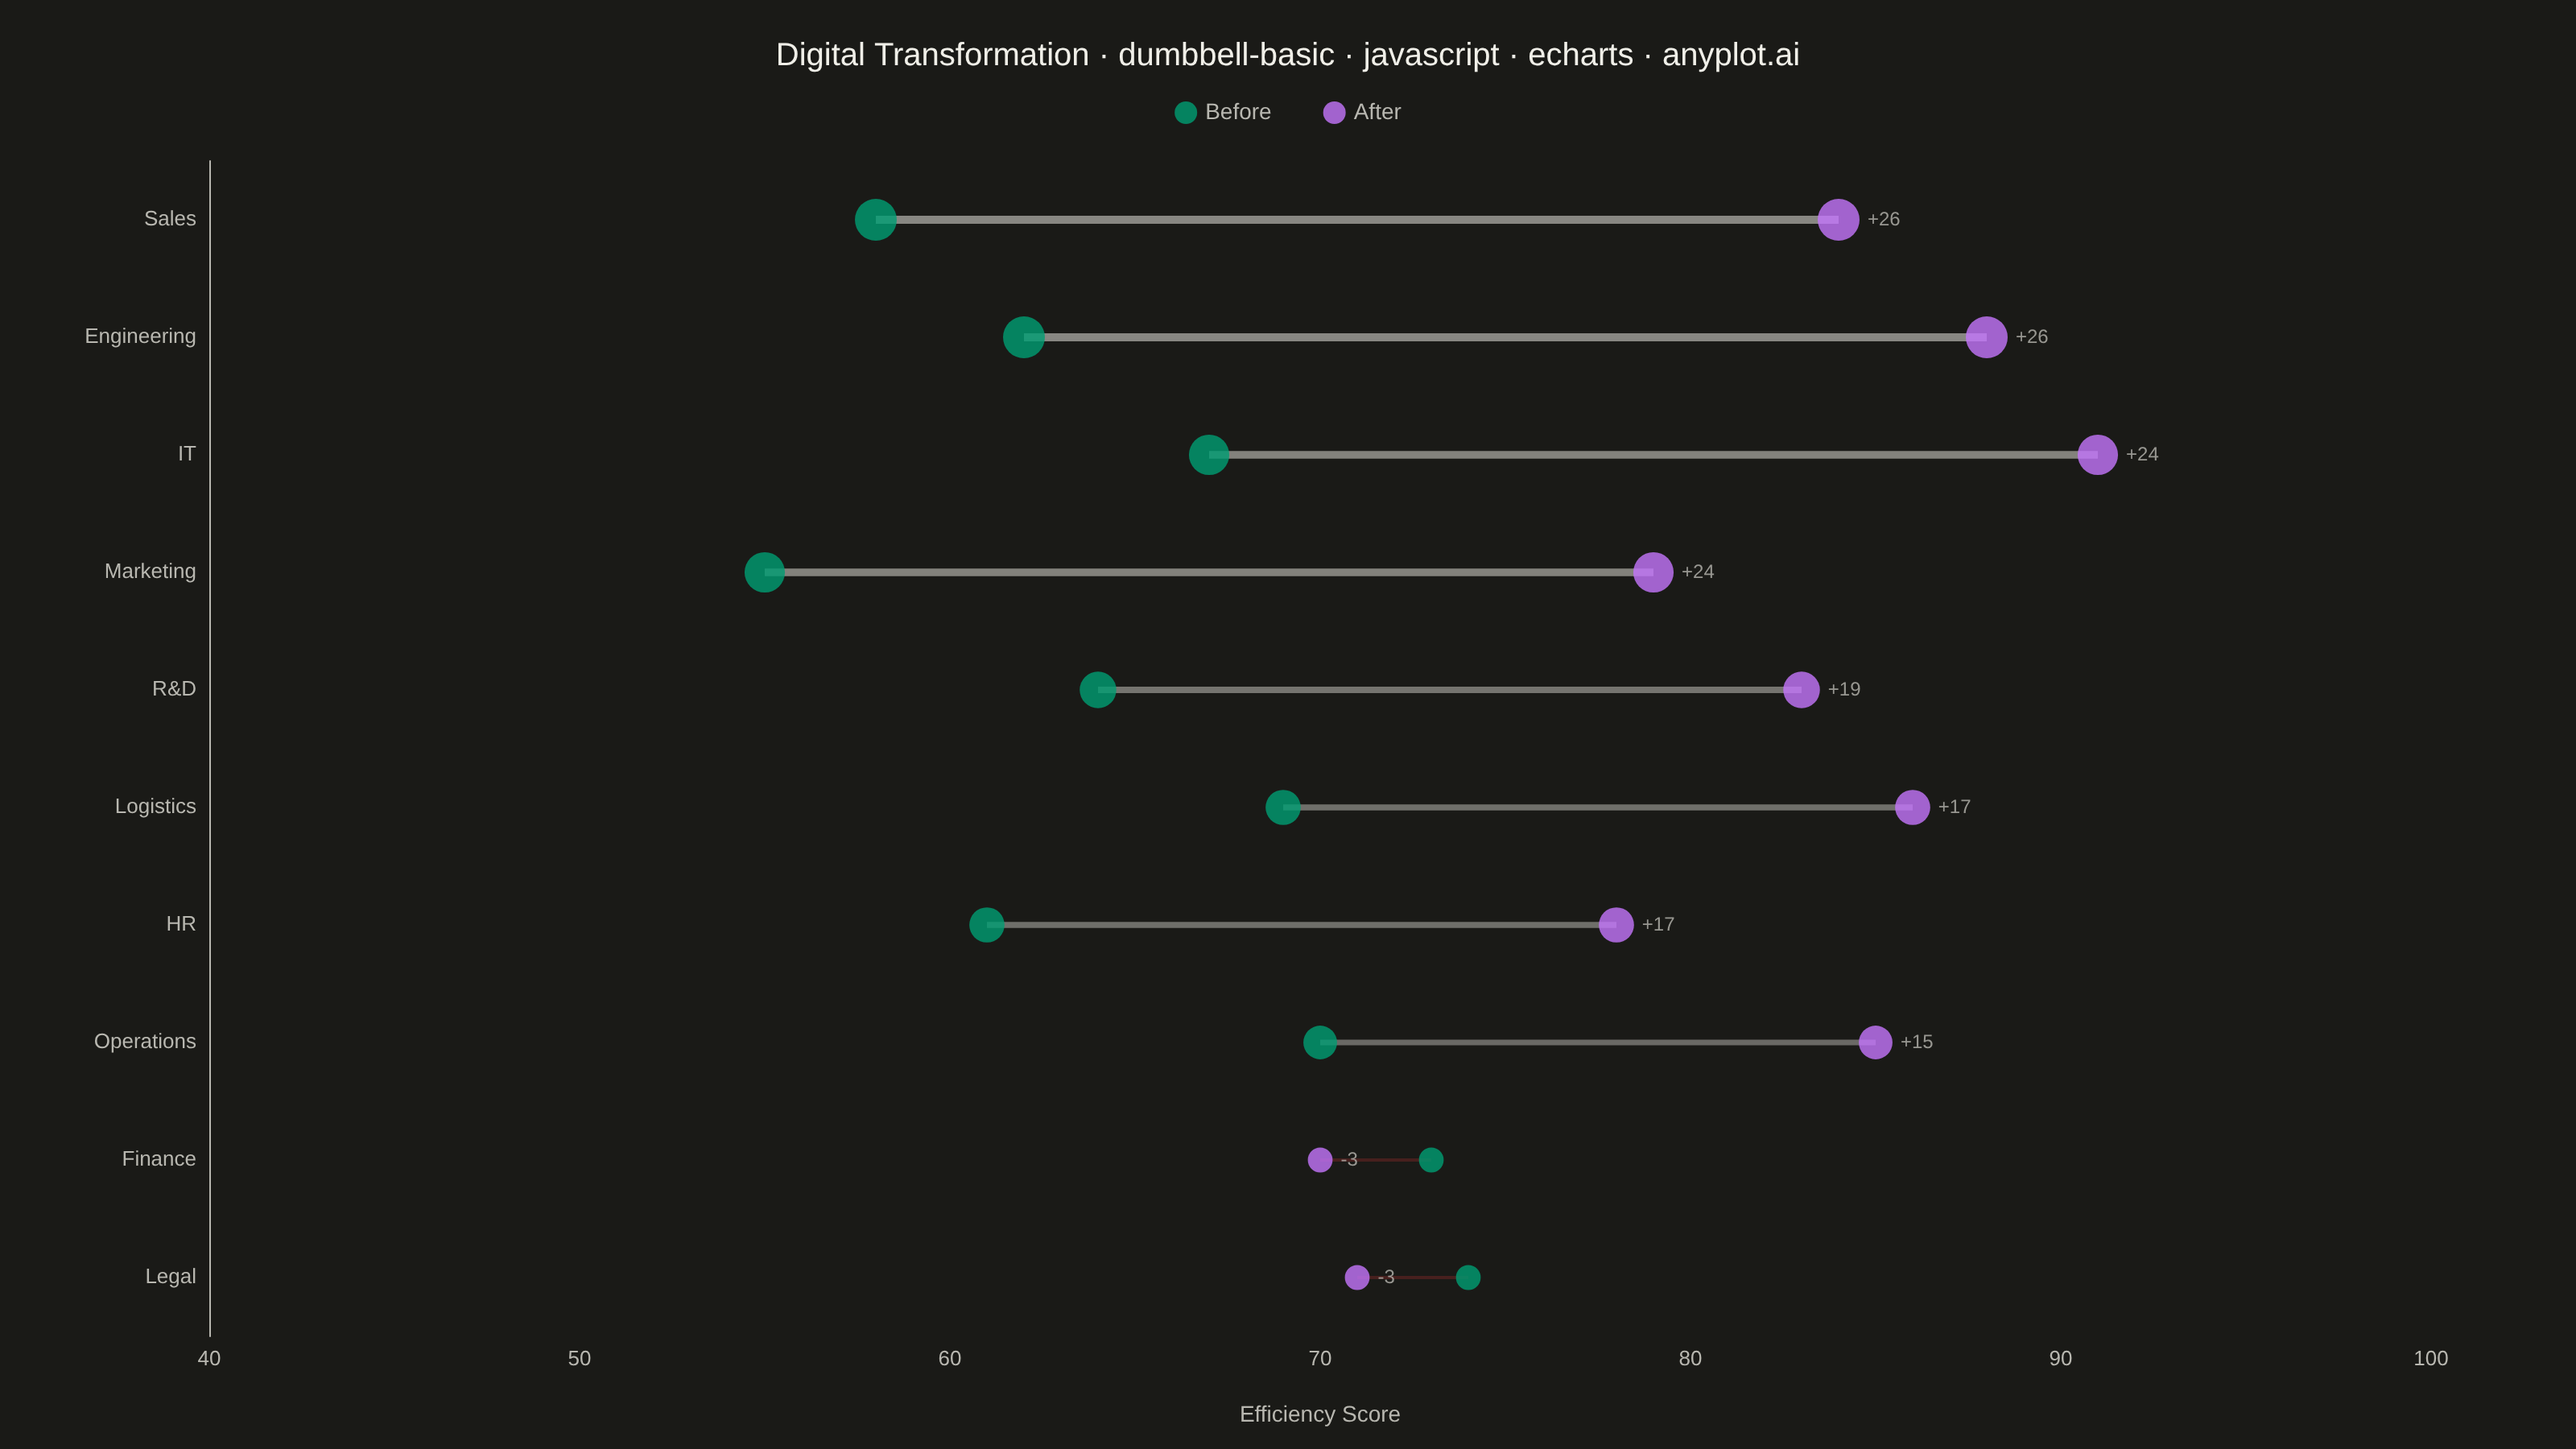
A dumbbell chart (also called a connected dot plot or Cleveland dot plot) compares two values for each category by displaying two dots connected by a line. It effectively visualizes differences, changes, or ranges between two data points such as before/after comparisons, gaps, or min/max values. The connected dots make it easy to see both the magnitude and direction of change.
Preview render from the Apache ECharts implementation.