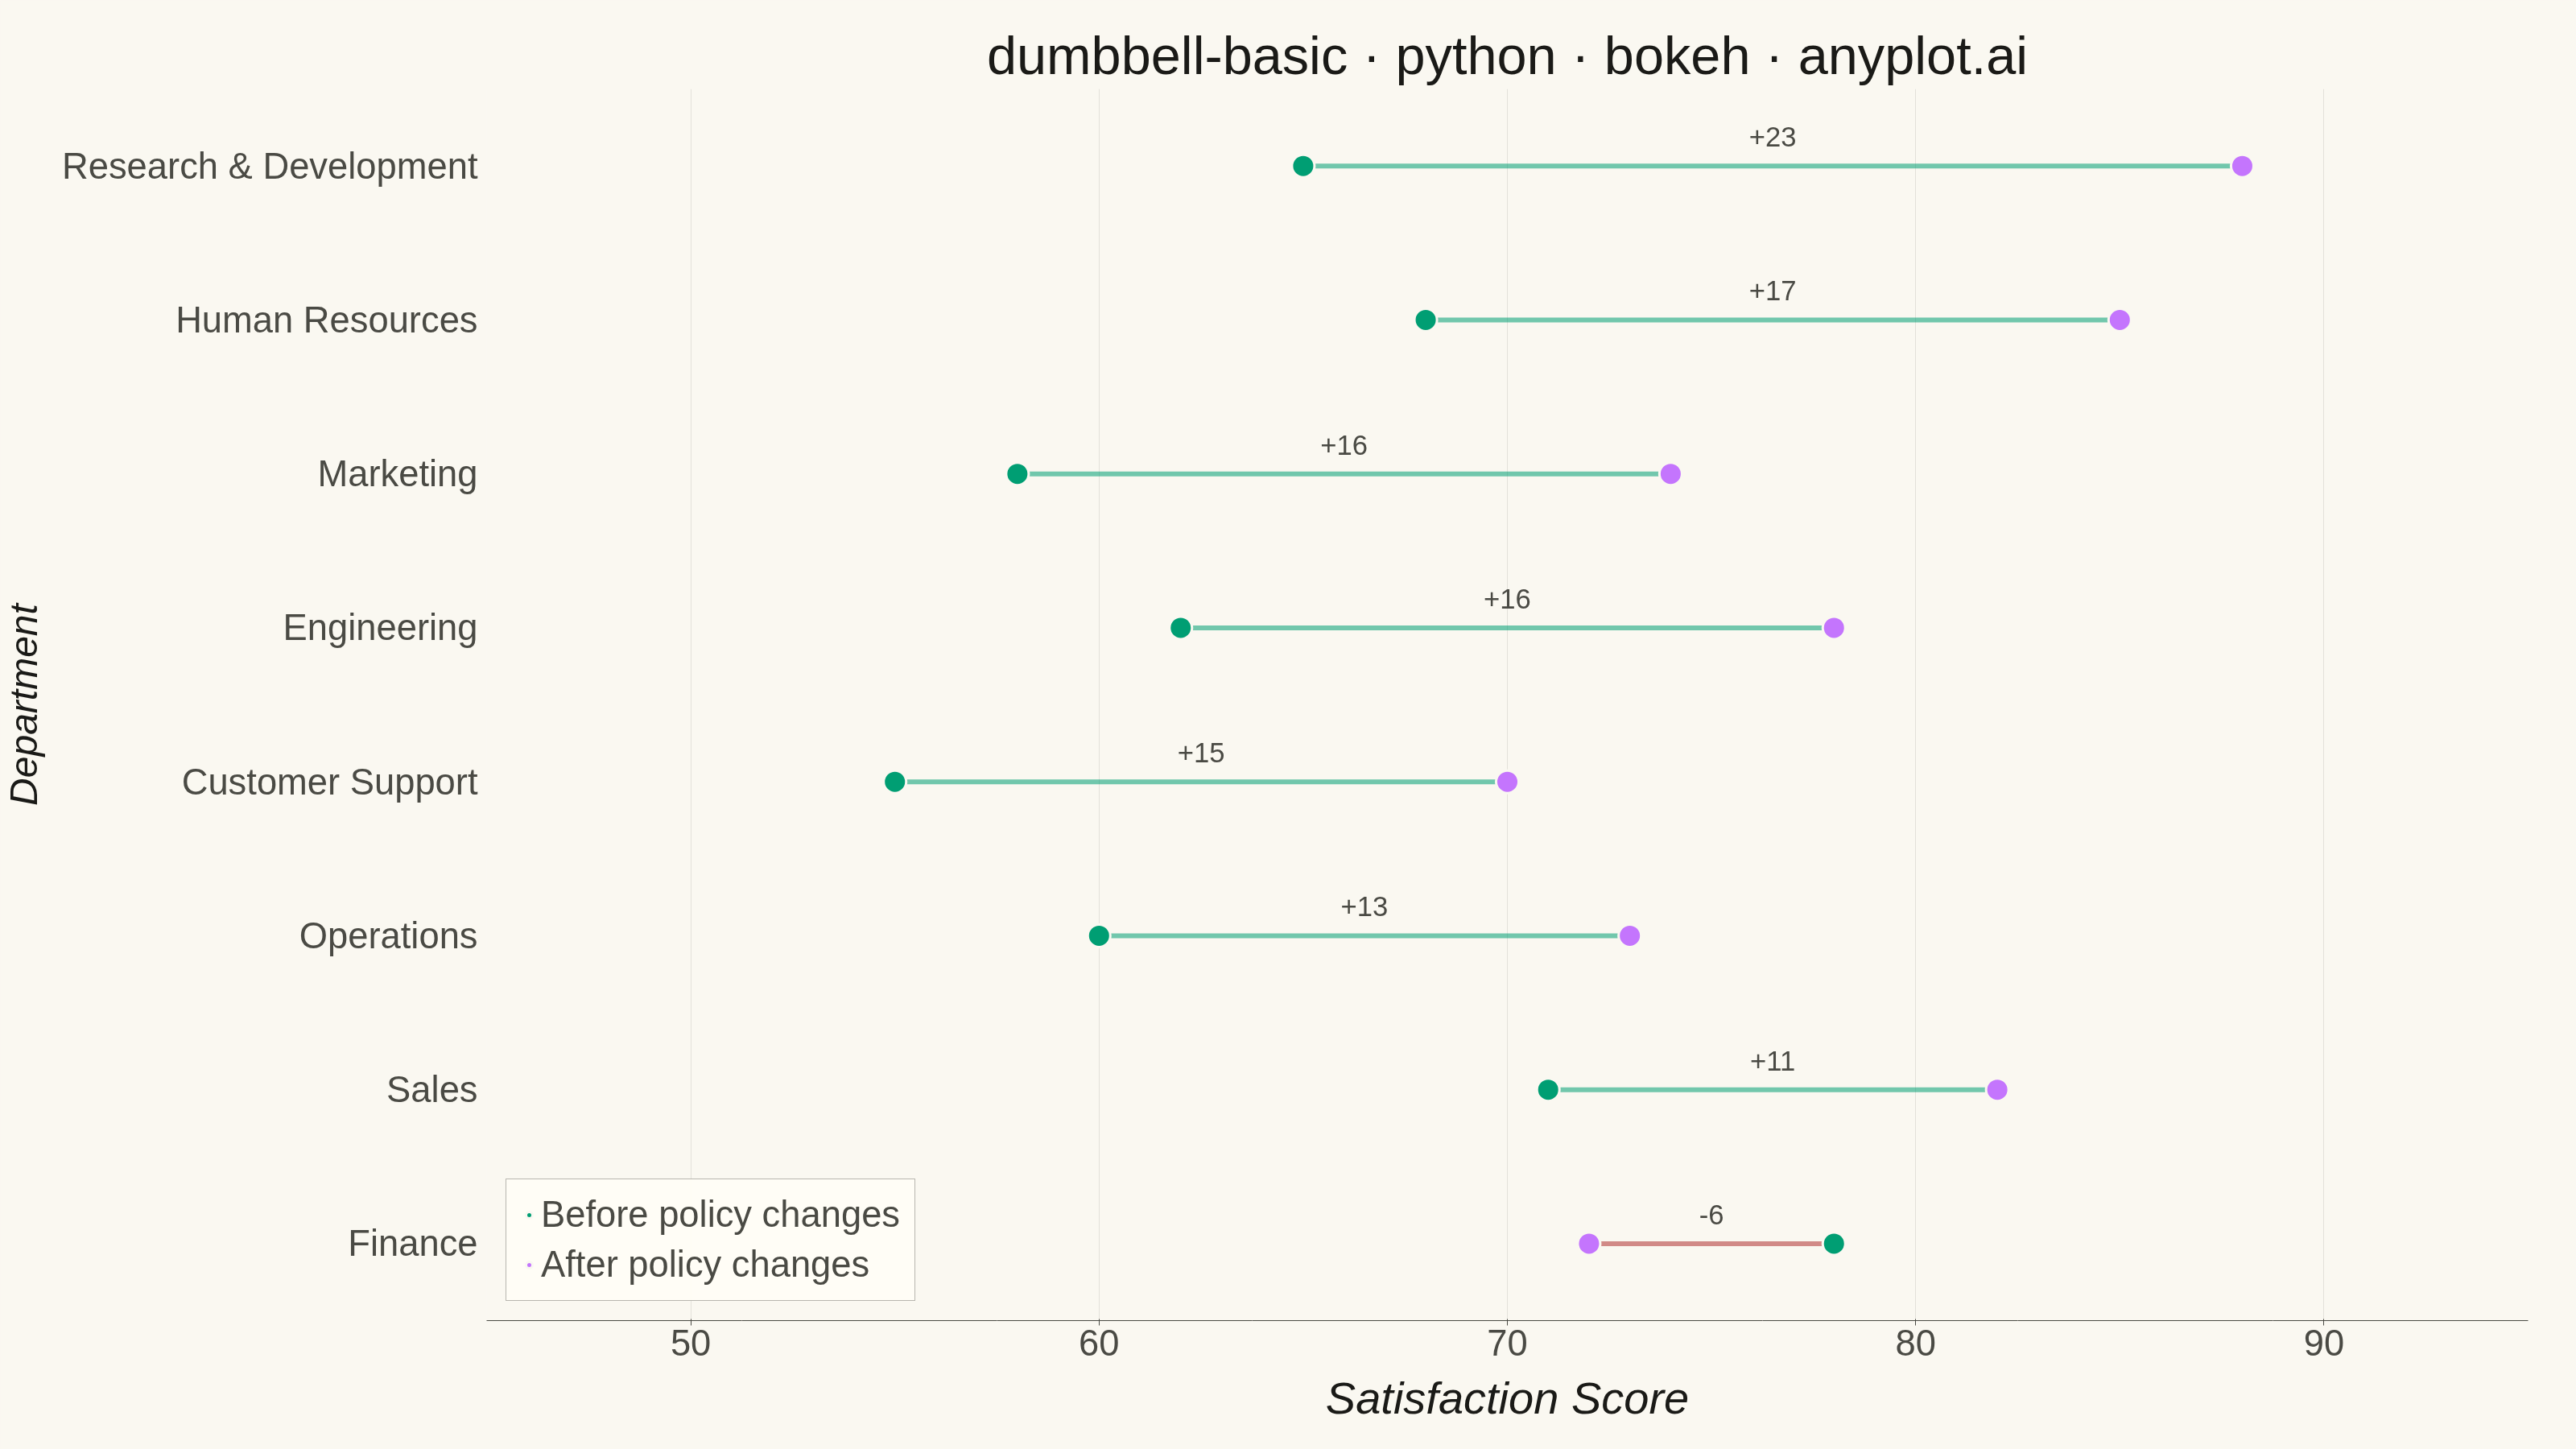
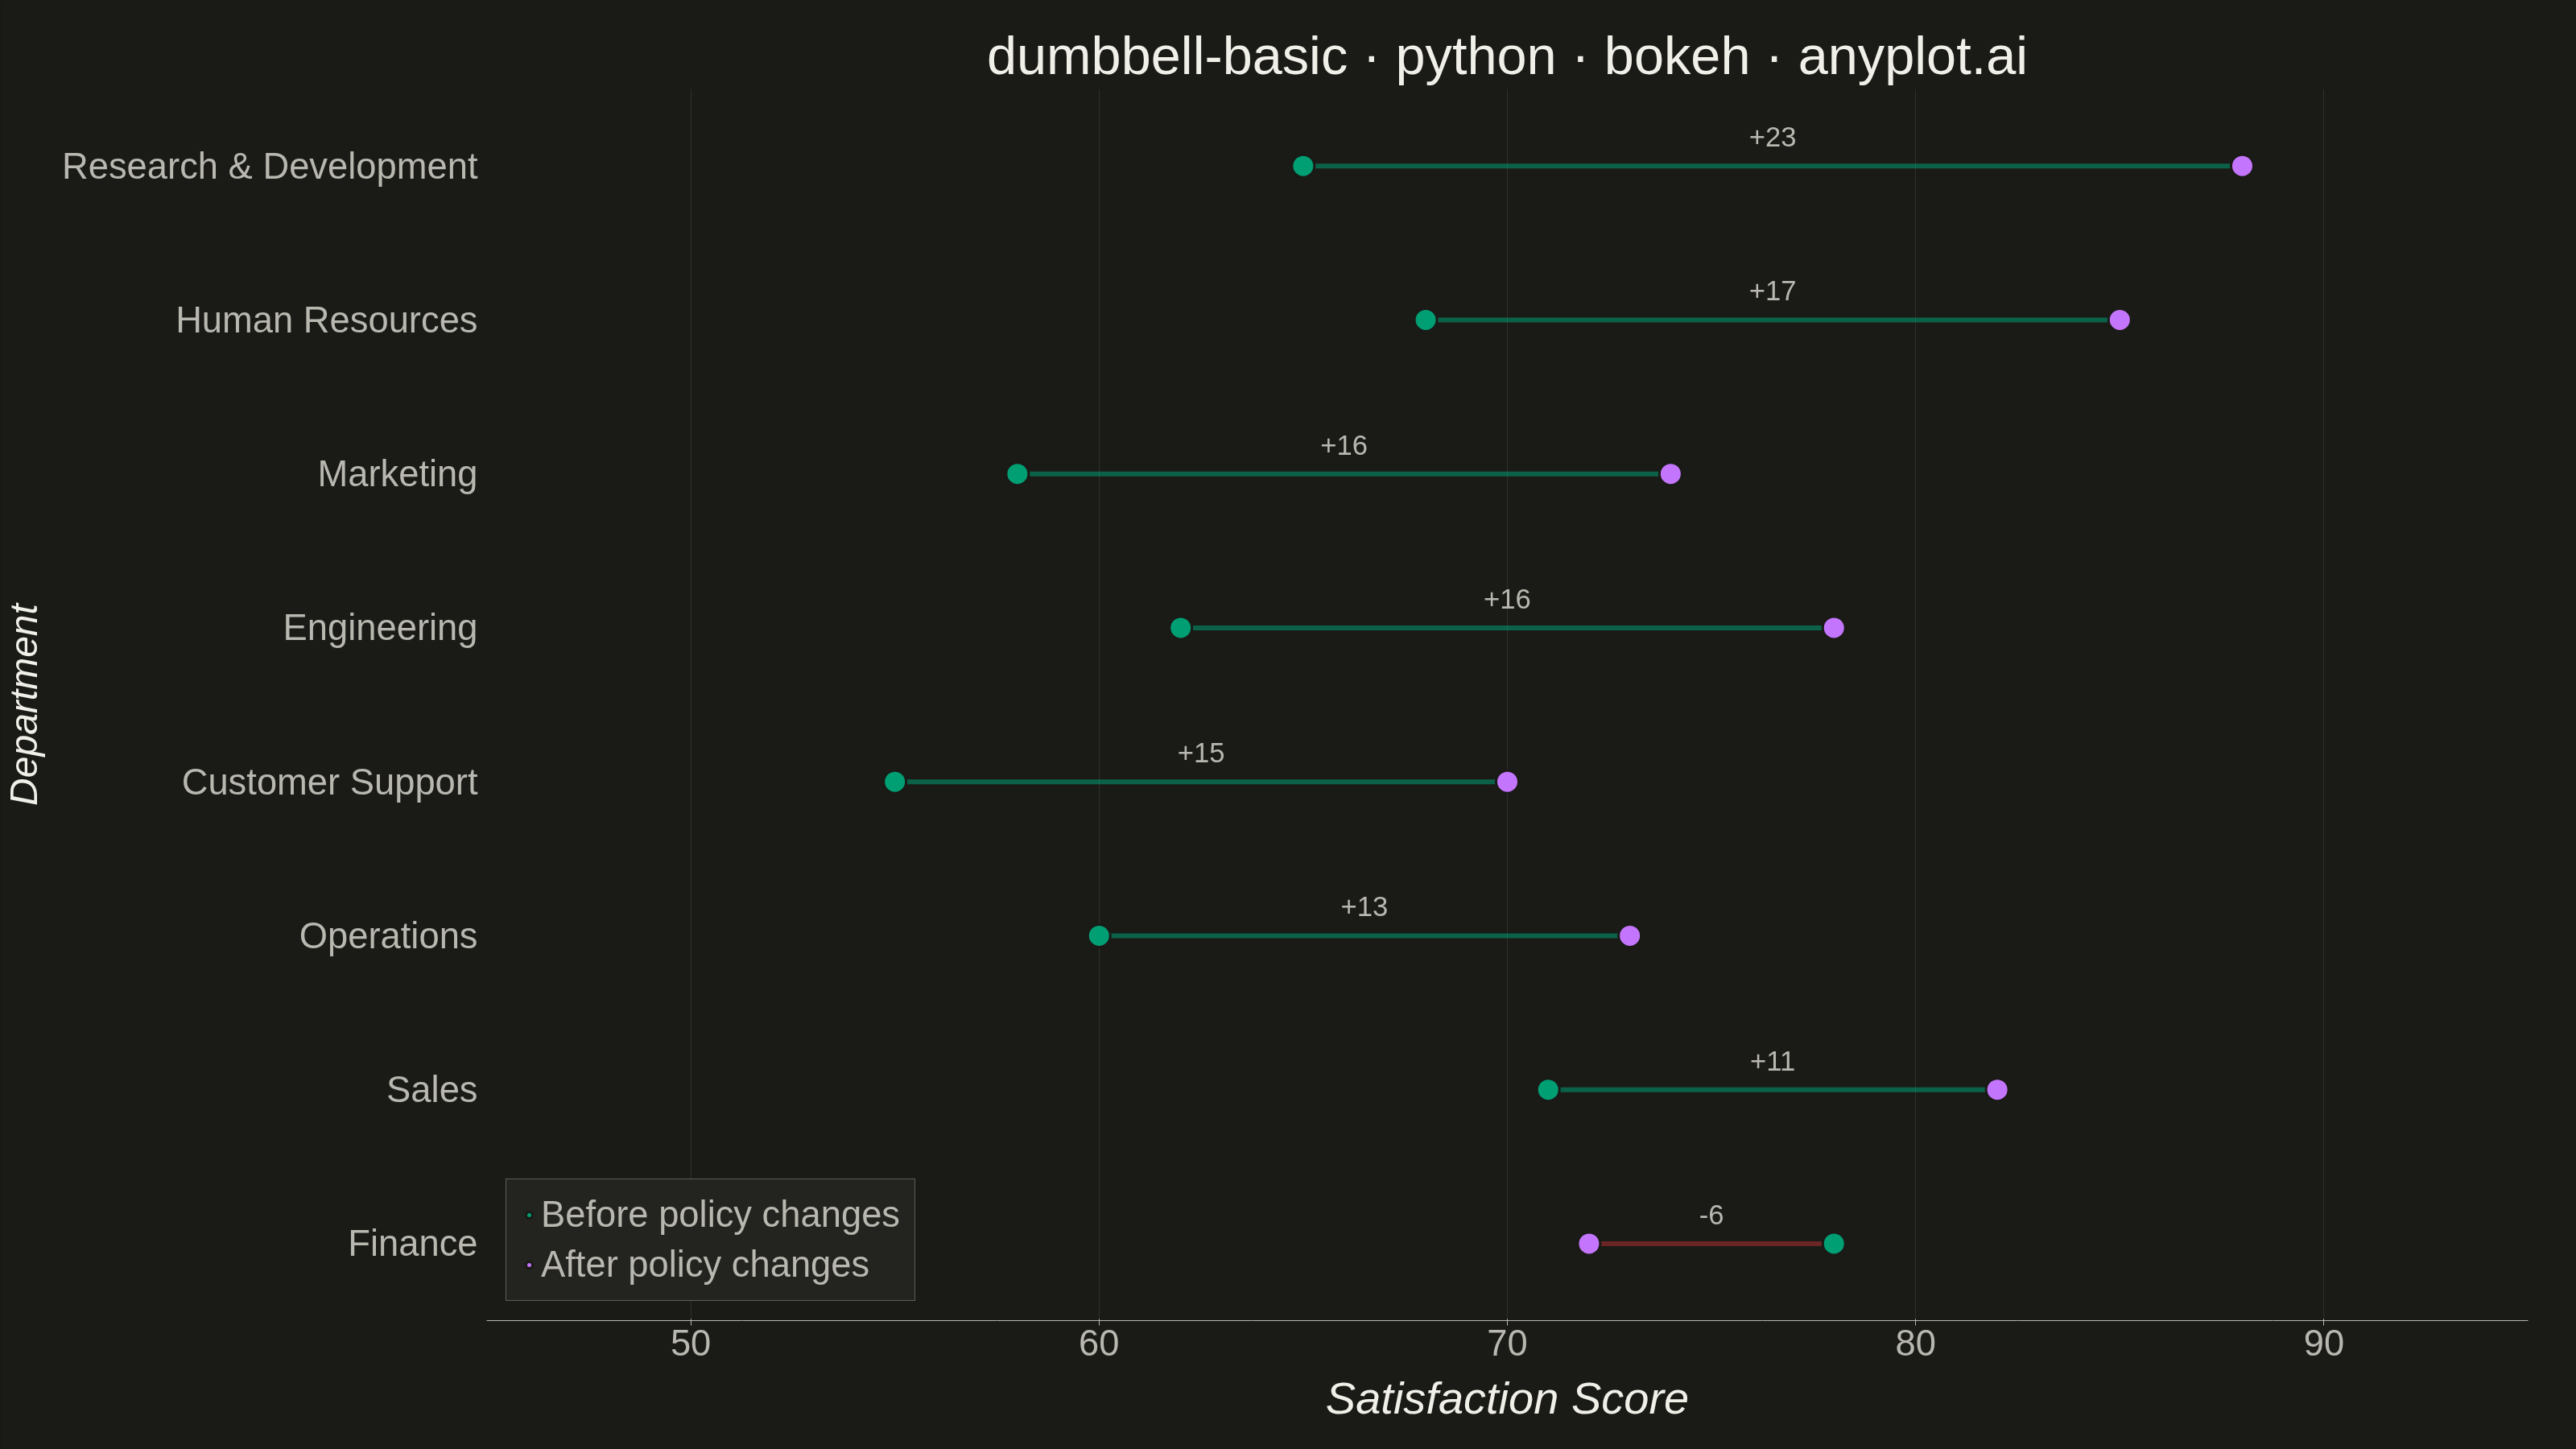
A dumbbell chart (also called a connected dot plot or Cleveland dot plot) compares two values for each category by displaying two dots connected by a line. It effectively visualizes differences, changes, or ranges between two data points such as before/after comparisons, gaps, or min/max values. The connected dots make it easy to see both the magnitude and direction of change.
""" anyplot.ai
dumbbell-basic: Basic Dumbbell Chart
Library: bokeh 3.9.1 | Python 3.13.14
Quality: 88/100 | Updated: 2026-06-30
"""

import os
import sys
import time
from pathlib import Path


# Remove script's own directory from sys.path to prevent self-shadowing
# (this file is named bokeh.py; without this, `import bokeh` would find itself)
_here = os.path.dirname(os.path.abspath(__file__))
sys.path = [p for p in sys.path if os.path.abspath(p or ".") != _here]

from bokeh.io import output_file, save
from bokeh.models import ColumnDataSource, HoverTool, LabelSet
from bokeh.plotting import figure
from selenium import webdriver
from selenium.webdriver.chrome.options import Options


# Theme tokens
THEME = os.getenv("ANYPLOT_THEME", "light")
PAGE_BG = "#FAF8F1" if THEME == "light" else "#1A1A17"
ELEVATED_BG = "#FFFDF6" if THEME == "light" else "#242420"
INK = "#1A1A17" if THEME == "light" else "#F0EFE8"
INK_SOFT = "#4A4A44" if THEME == "light" else "#B8B7B0"
BRAND = "#009E73"  # Imprint palette position 1 — "Before" dots
ACCENT = "#C475FD"  # Imprint palette position 2 — "After" dots

# Data — Employee satisfaction scores before and after policy changes
categories = [
    "Engineering",
    "Marketing",
    "Sales",
    "Customer Support",
    "Human Resources",
    "Finance",
    "Operations",
    "Research & Development",
]
start_values = [62, 58, 71, 55, 68, 78, 60, 65]
end_values = [78, 74, 82, 70, 85, 72, 73, 88]

# Sort ascending by change so the largest improvements sit at the top
deltas = [e - s for s, e in zip(start_values, end_values, strict=True)]
ordered = sorted(zip(categories, start_values, end_values, deltas, strict=True), key=lambda d: d[3])
categories = [d[0] for d in ordered]
start_values = [d[1] for d in ordered]
end_values = [d[2] for d in ordered]
deltas = [d[3] for d in ordered]

# Plot
TITLE = "dumbbell-basic · python · bokeh · anyplot.ai"
p = figure(
    width=3200,
    height=1800,
    y_range=categories,
    x_range=(45, 95),
    title=TITLE,
    x_axis_label="Satisfaction Score",
    y_axis_label="Department",
    background_fill_color=PAGE_BG,
    border_fill_color=PAGE_BG,
    toolbar_location=None,
    min_border_bottom=160,
    min_border_left=280,
    min_border_top=110,
    min_border_right=60,
)

# Connecting segments — color-coded by direction: green = improvement, red = regression
seg_source = ColumnDataSource(
    data={
        "y": categories,
        "x_start": start_values,
        "x_end": end_values,
        "delta": [f"{d:+d}" for d in deltas],
        "seg_color": [BRAND if d > 0 else "#AE3030" for d in deltas],
    }
)
p.segment(
    x0="x_start", x1="x_end", y0="y", y1="y", source=seg_source, line_color="seg_color", line_alpha=0.55, line_width=6
)

# Delta labels on connecting segments — makes improvement/regression story explicit
label_source = ColumnDataSource(
    data={
        "x": [(s + e) / 2 for s, e in zip(start_values, end_values, strict=True)],
        "y": categories,
        "text": [f"{d:+d}" for d in deltas],
    }
)
p.add_layout(
    LabelSet(
        x="x",
        y="y",
        text="text",
        source=label_source,
        text_align="center",
        text_baseline="bottom",
        text_font_size="26pt",
        text_color=INK_SOFT,
        y_offset=24,
    )
)

# "Before" dots — Imprint palette position 1 (brand green)
before_source = ColumnDataSource(
    data={
        "x": start_values,
        "y": categories,
        "phase": ["Before"] * len(categories),
        "after": end_values,
        "delta": [f"{d:+d} pts" for d in deltas],
    }
)
before_glyph = p.scatter(
    x="x",
    y="y",
    source=before_source,
    size=28,
    fill_color=BRAND,
    line_color=PAGE_BG,
    line_width=3,
    legend_label="Before policy changes",
)

# "After" dots — Imprint palette position 2 (lavender)
after_source = ColumnDataSource(
    data={
        "x": end_values,
        "y": categories,
        "phase": ["After"] * len(categories),
        "before": start_values,
        "delta": [f"{d:+d} pts" for d in deltas],
    }
)
after_glyph = p.scatter(
    x="x",
    y="y",
    source=after_source,
    size=28,
    fill_color=ACCENT,
    line_color=PAGE_BG,
    line_width=3,
    legend_label="After policy changes",
)

# Hover tooltip — shows department, phase, score, and delta change together
p.add_tools(
    HoverTool(
        renderers=[before_glyph, after_glyph],
        tooltips=[("Department", "@y"), ("Phase", "@phase"), ("Score", "@x"), ("Δ Change", "@delta")],
    )
)

# Typography — canonical sizes for 3200×1800 per bokeh.md
p.title.text_font_size = "50pt"
p.title.text_color = INK
p.title.text_font_style = "normal"
p.title.align = "center"

p.xaxis.axis_label_text_font_size = "42pt"
p.yaxis.axis_label_text_font_size = "36pt"
p.xaxis.major_label_text_font_size = "34pt"
p.yaxis.major_label_text_font_size = "34pt"
p.xaxis.axis_label_text_color = INK
p.yaxis.axis_label_text_color = INK
p.xaxis.major_label_text_color = INK_SOFT
p.yaxis.major_label_text_color = INK_SOFT
p.xaxis.axis_label_standoff = 18
p.yaxis.axis_label_standoff = 18

# Spines — keep x-axis, remove y-axis for a cleaner look
p.outline_line_color = None
p.xaxis.axis_line_color = INK_SOFT
p.yaxis.axis_line_color = None
p.xaxis.major_tick_line_color = INK_SOFT
p.yaxis.major_tick_line_color = None
p.xaxis.minor_tick_line_color = None
p.yaxis.minor_tick_line_color = None

# Grid — subtle vertical guides only
p.xgrid.grid_line_color = INK
p.xgrid.grid_line_alpha = 0.10
p.ygrid.grid_line_color = None

# Legend
p.legend.location = "bottom_left"
p.legend.background_fill_color = ELEVATED_BG
p.legend.background_fill_alpha = 0.95
p.legend.border_line_color = INK_SOFT
p.legend.border_line_alpha = 0.4
p.legend.label_text_color = INK_SOFT
p.legend.label_text_font_size = "34pt"
p.legend.spacing = 10
p.legend.padding = 18
p.legend.margin = 24

# Save interactive HTML (required catalog artifact)
html_path = Path(f"plot-{THEME}.html")
output_file(str(html_path), title=TITLE)
save(p)

# Inject body background CSS to prevent thin border artifact in headless-Chrome screenshot
html_content = html_path.read_text()
body_style = f"<style>body{{margin:0;padding:0;background:{PAGE_BG};}}</style>"
html_content = html_content.replace("</head>", f"{body_style}\n</head>", 1)
html_path.write_text(html_content)

# Screenshot via headless Chrome — use CDP to set exact viewport to match figure dimensions
W, H = 3200, 1800
opts = Options()
for arg in (
    "--headless=new",
    "--no-sandbox",
    "--disable-dev-shm-usage",
    "--disable-gpu",
    f"--window-size={W},{H}",
    "--hide-scrollbars",
):
    opts.add_argument(arg)
driver = webdriver.Chrome(options=opts)
driver.execute_cdp_cmd(
    "Emulation.setDeviceMetricsOverride", {"width": W, "height": H, "deviceScaleFactor": 1, "mobile": False}
)
driver.get(f"file://{html_path.resolve()}")
time.sleep(3)
driver.save_screenshot(f"plot-{THEME}.png")
driver.quit()
Runnable source as JSON, for any HTTP client: https://api.anyplot.ai/specs/dumbbell-basic/bokeh/code. Any spec id and library id listed in llms-full.txt fit the same URL shape; every URL below is complete and callable.
{
  "spec_id": "dumbbell-basic",
  "language": "python",
  "library": "bokeh",
  "page": "https://anyplot.ai/dumbbell-basic/python/bokeh",
  "hub": "https://anyplot.ai/dumbbell-basic",
  "code_json": "https://api.anyplot.ai/specs/dumbbell-basic/bokeh/code",
  "spec_json": "https://api.anyplot.ai/specs/dumbbell-basic",
  "render_light_png": "https://storage.googleapis.com/anyplot-images/plots/dumbbell-basic/python/bokeh/plot-light.png",
  "render_dark_png": "https://storage.googleapis.com/anyplot-images/plots/dumbbell-basic/python/bokeh/plot-dark.png",
  "interactive_light_html": "https://storage.googleapis.com/anyplot-images/plots/dumbbell-basic/python/bokeh/plot-light.html",
  "interactive_dark_html": "https://storage.googleapis.com/anyplot-images/plots/dumbbell-basic/python/bokeh/plot-dark.html",
  "quality_score": 88.0,
  "license": "MIT",
  "guide": "https://anyplot.ai/llms.txt"
}
Part of Basic Dumbbell Chart on anyplot.ai.