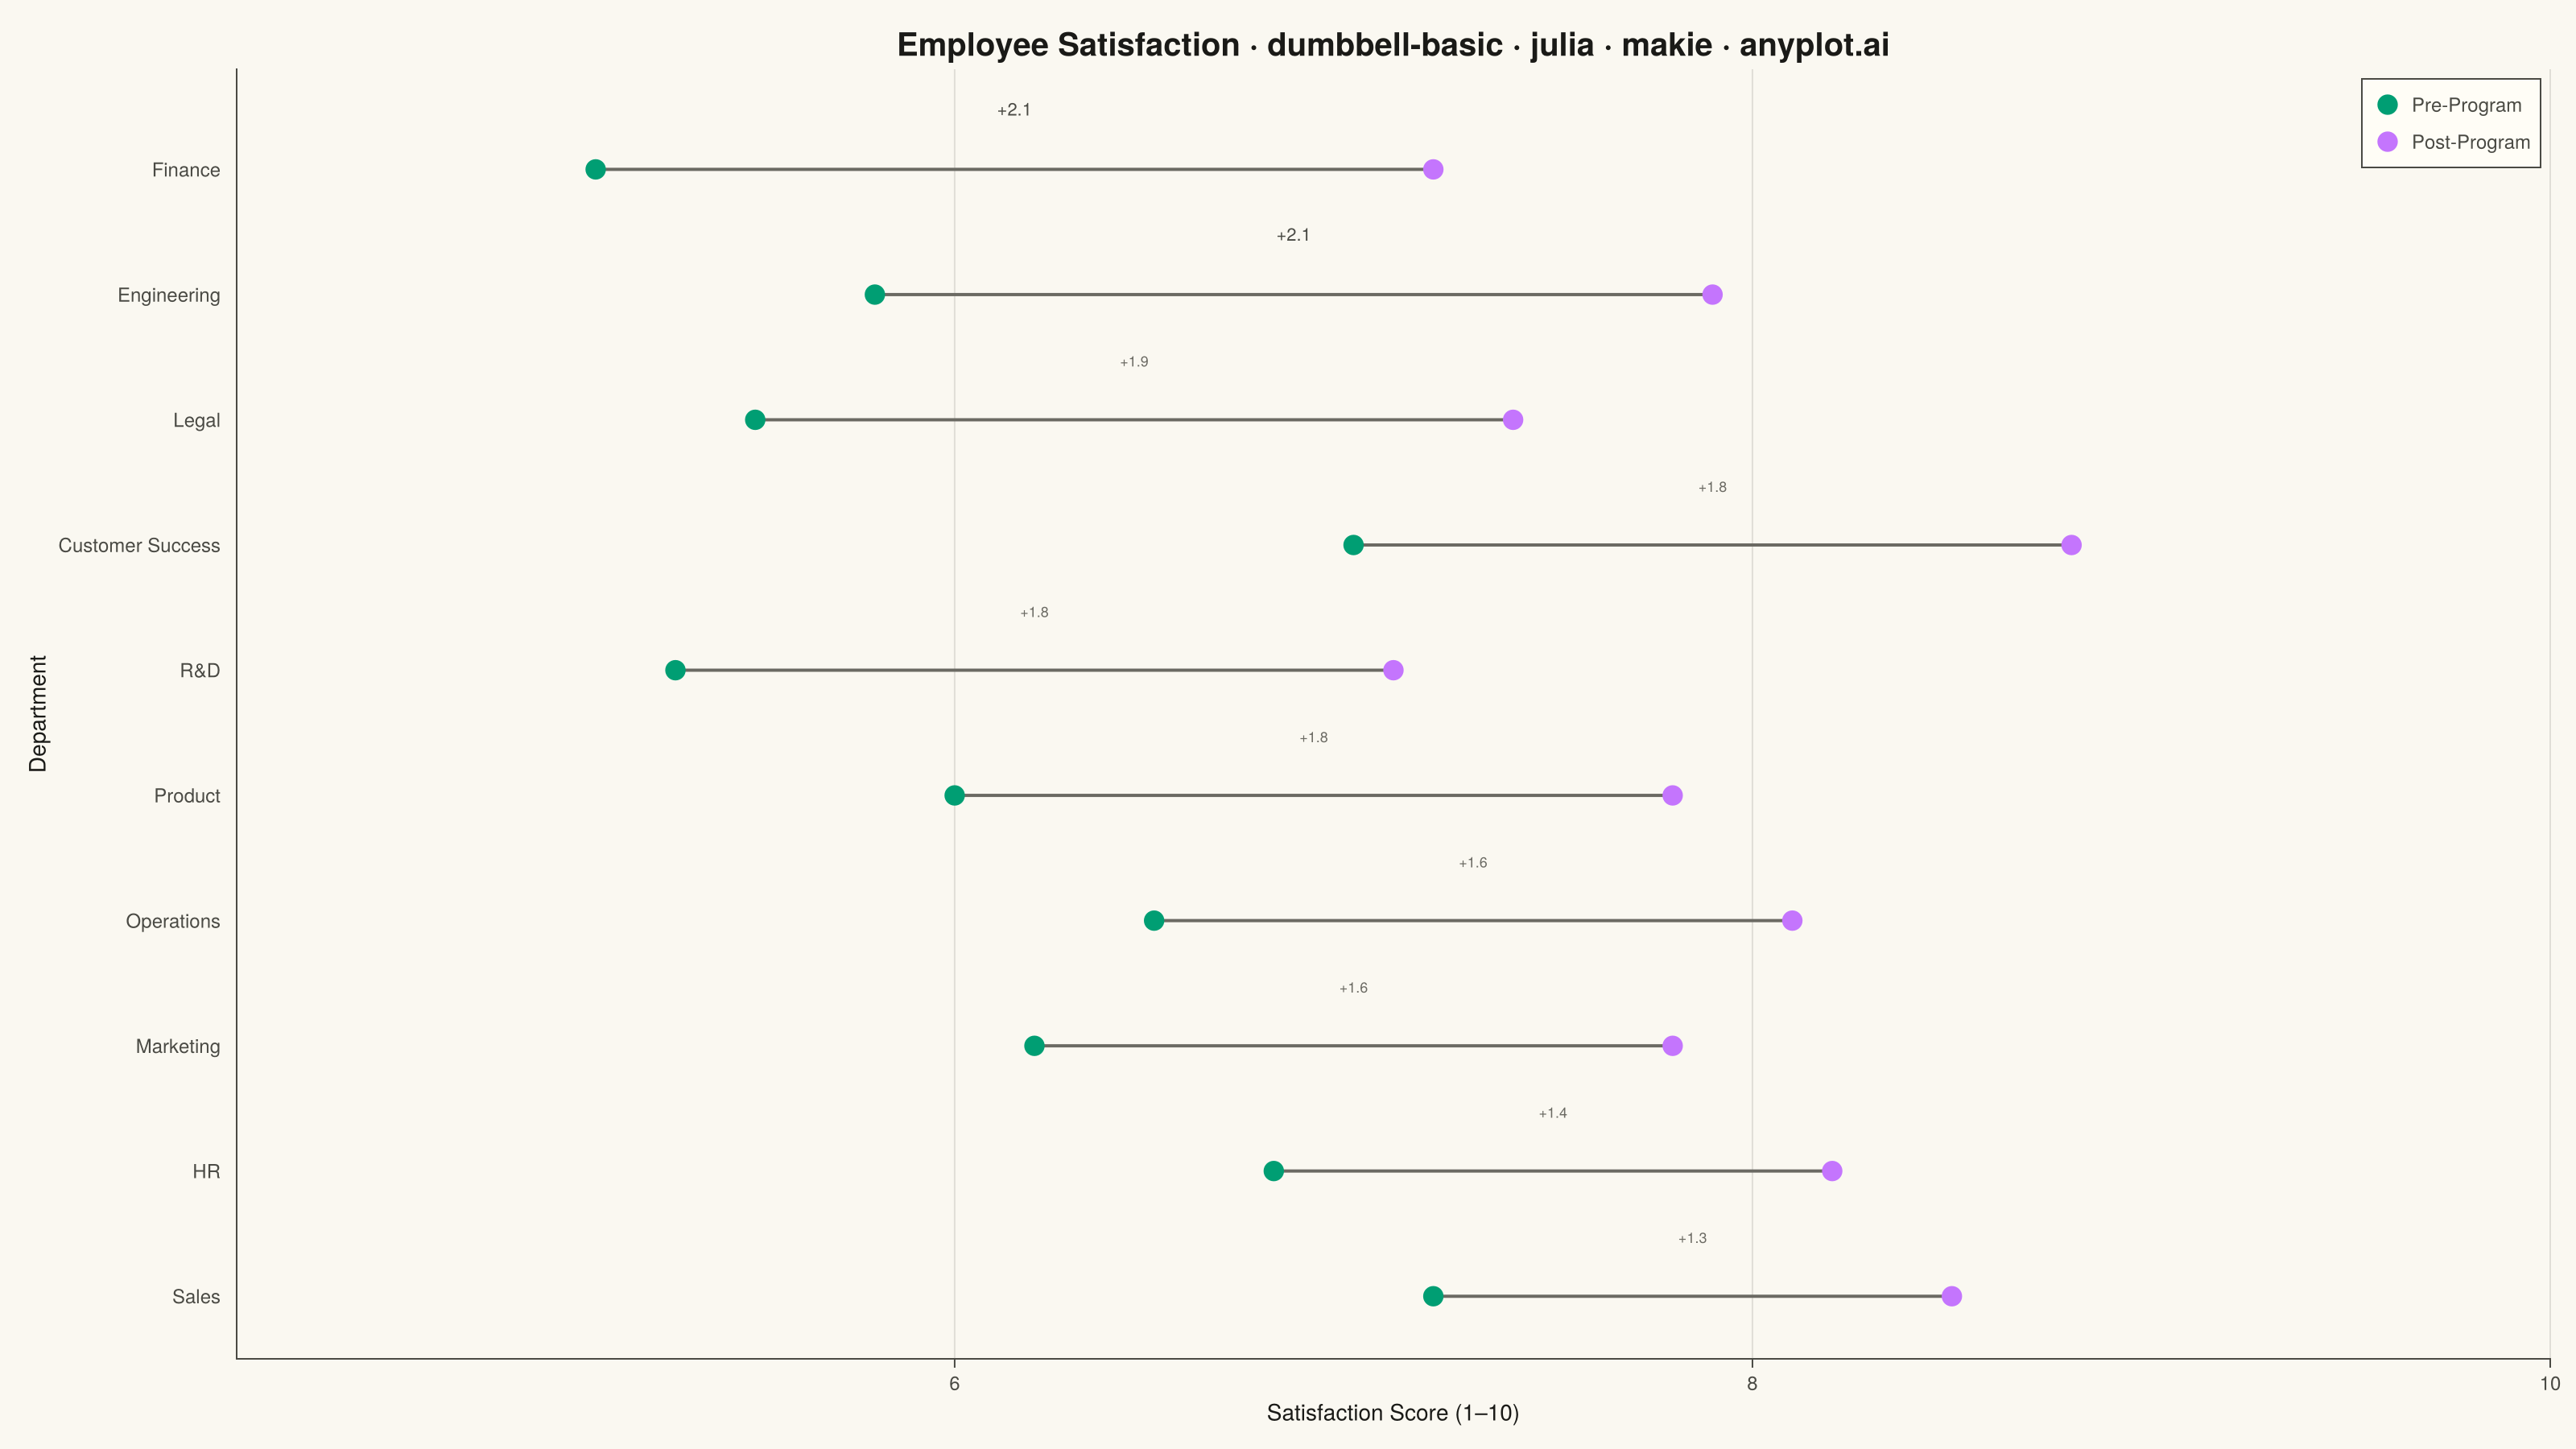
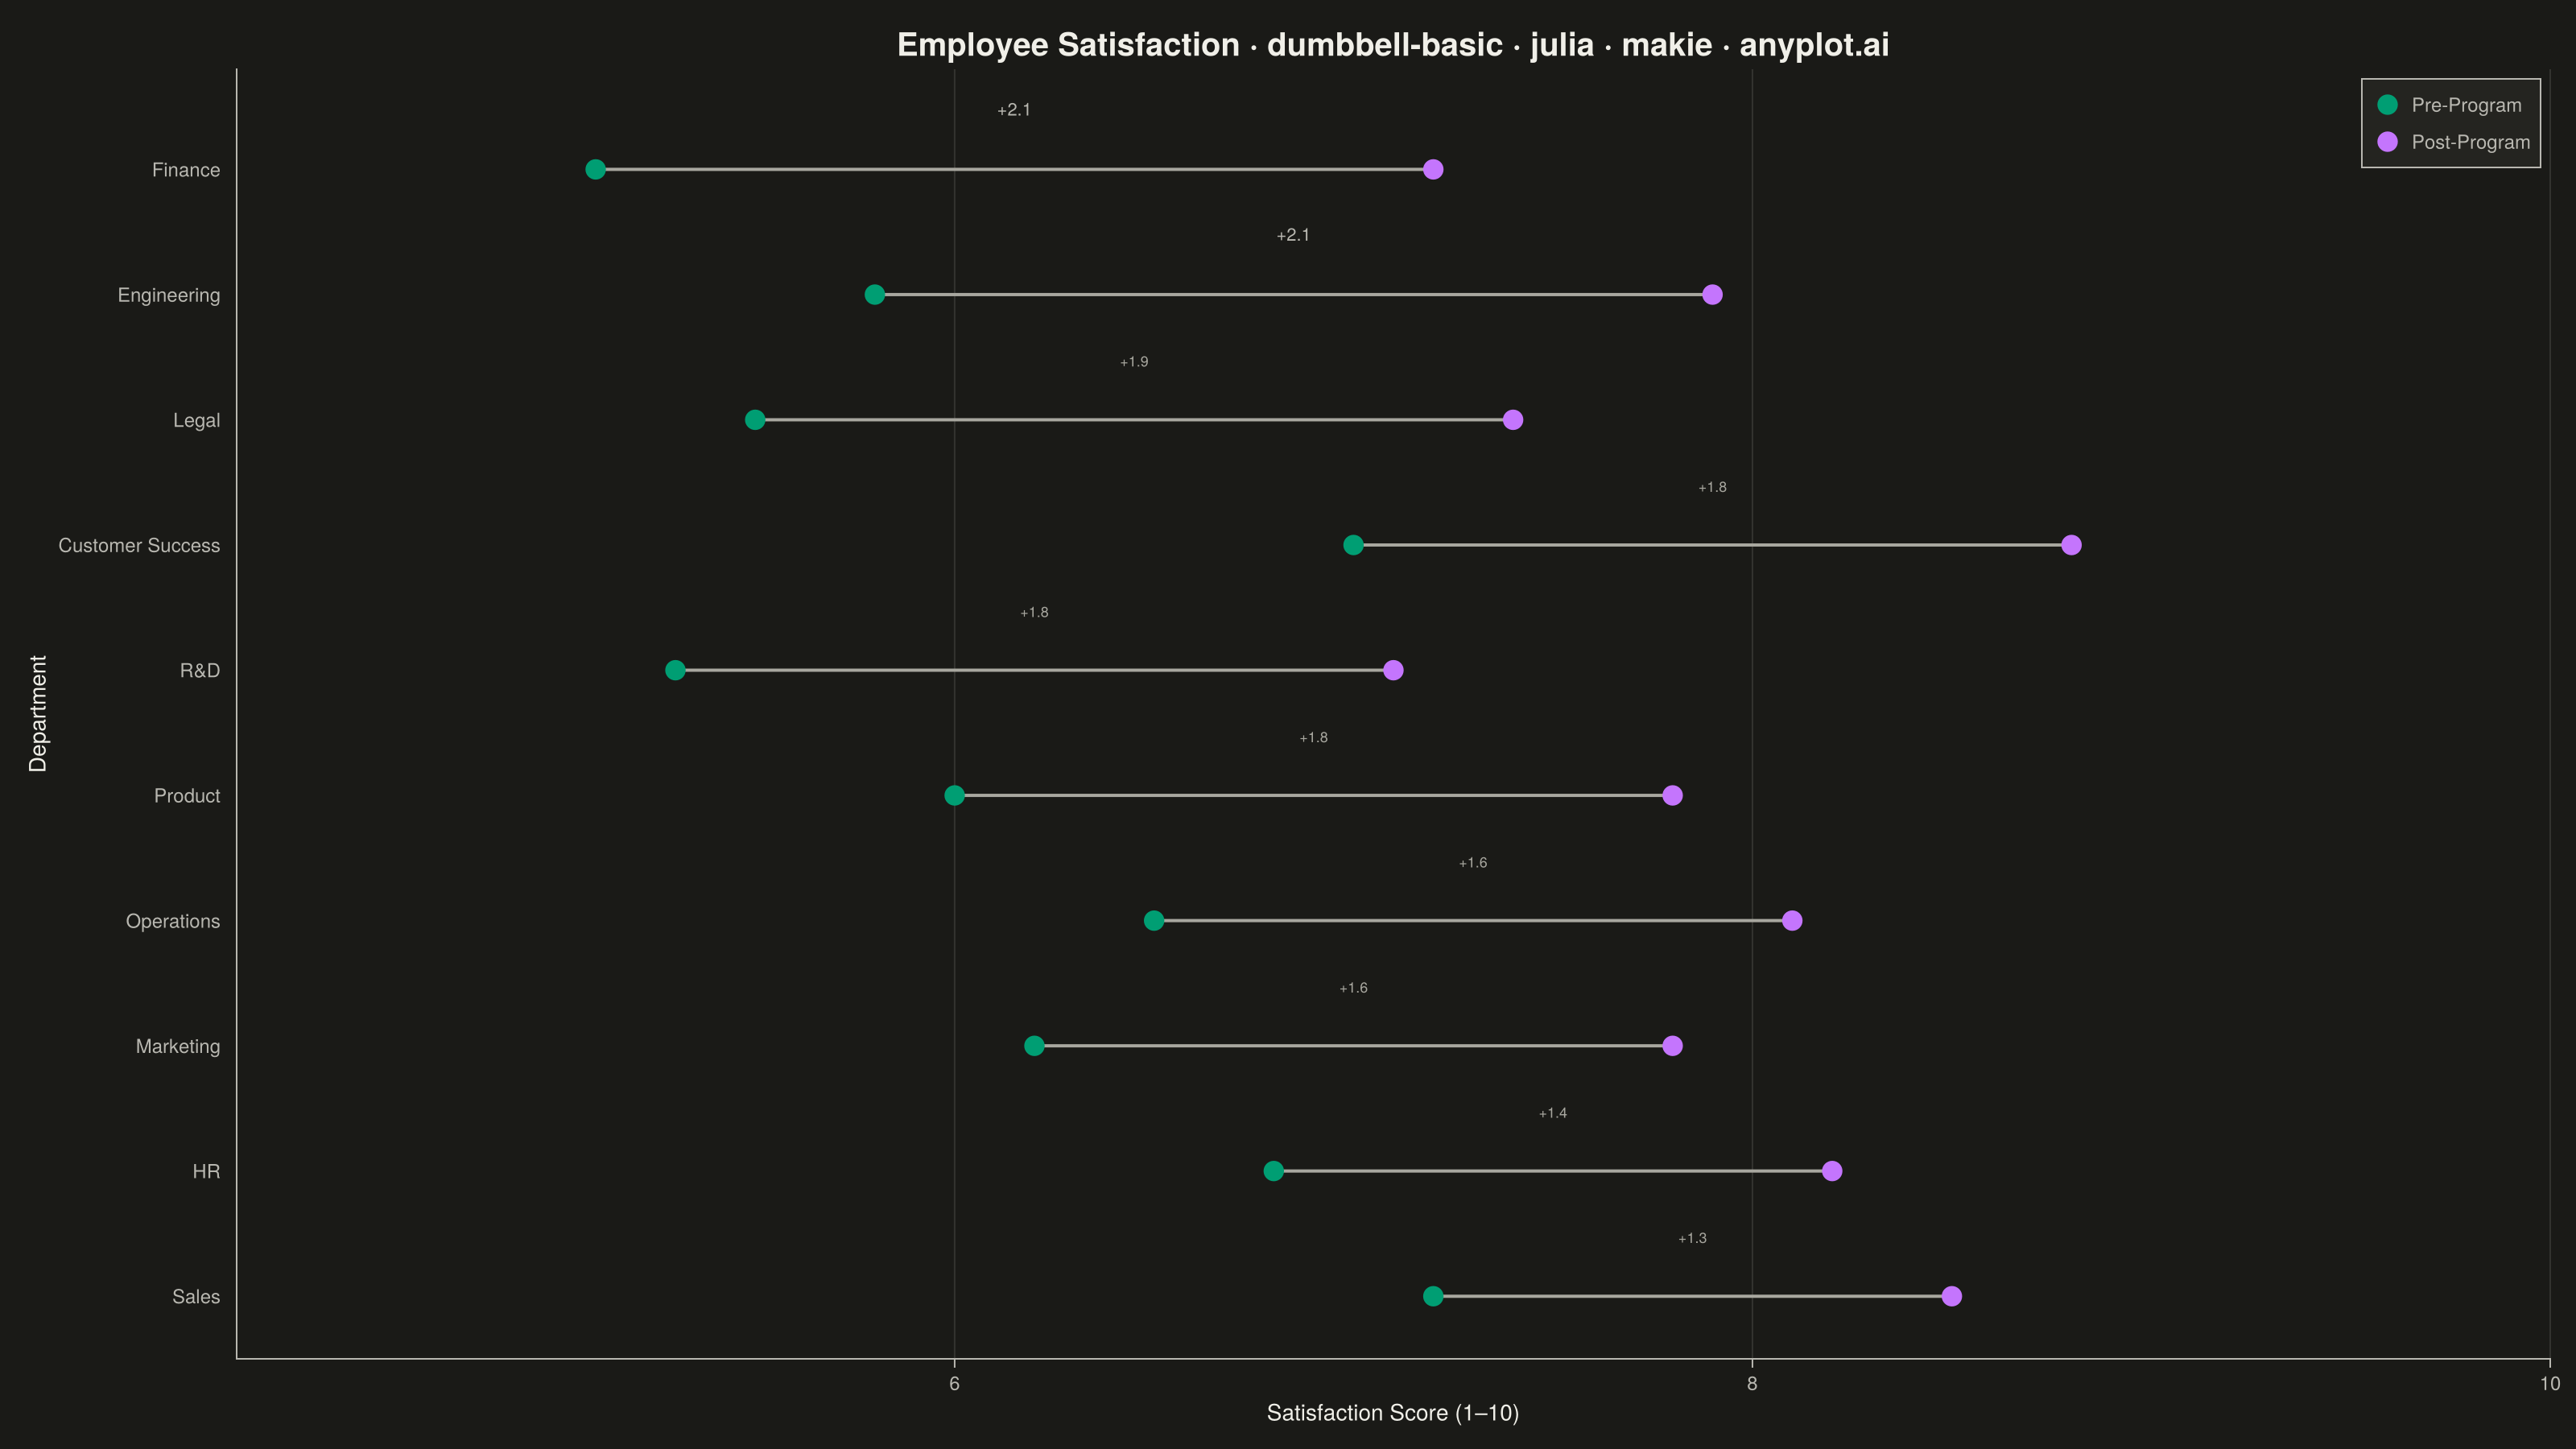
The same plot in 14 other libraries — Python: Altair, Bokeh, lets-plot, Matplotlib, Plotly, plotnine, Pygal, Seaborn; R: ggplot2; JavaScript: Chart.js, D3.js, Apache ECharts, Highcharts, MUI X Charts. Compare all 15 side by side: Basic Dumbbell Chart in Python, R, Julia and JavaScript.
A dumbbell chart (also called a connected dot plot or Cleveland dot plot) compares two values for each category by displaying two dots connected by a line. It effectively visualizes differences, changes, or ranges between two data points such as before/after comparisons, gaps, or min/max values. The connected dots make it easy to see both the magnitude and direction of change.
# anyplot.ai
# dumbbell-basic: Basic Dumbbell Chart
# Library: makie 0.21.9 | Julia 1.11.9
# Quality: 88/100 | Created: 2026-06-30

using CairoMakie
using Colors
using Random

Random.seed!(42)

const THEME       = get(ENV, "ANYPLOT_THEME", "light")
const PAGE_BG     = THEME == "light" ? colorant"#FAF8F1" : colorant"#1A1A17"
const ELEVATED_BG = THEME == "light" ? colorant"#FFFDF6" : colorant"#242420"
const INK         = THEME == "light" ? colorant"#1A1A17" : colorant"#F0EFE8"
const INK_SOFT    = THEME == "light" ? colorant"#4A4A44" : colorant"#B8B7B0"
const INK_MUTED   = THEME == "light" ? colorant"#6B6A63" : colorant"#A8A79F"

const IMPRINT_PALETTE = [
    colorant"#009E73",  # 1 — brand green (first series)
    colorant"#C475FD",  # 2 — lavender
    colorant"#4467A3",  # 3 — blue
    colorant"#BD8233",  # 4 — ochre
    colorant"#AE3030",  # 5 — matte red
    colorant"#2ABCCD",  # 6 — cyan
    colorant"#954477",  # 7 — rose
    colorant"#99B314",  # 8 — lime
]

# Data: Department satisfaction scores (scale 1–10) before and after a wellness program
departments_raw = ["Engineering", "Marketing", "Finance", "Operations", "Sales",
                   "HR", "Legal", "Product", "Customer Success", "R&D"]
before_raw = [5.8, 6.2, 5.1, 6.5, 7.2, 6.8, 5.5, 6.0, 7.0, 5.3]
after_raw  = [7.9, 7.8, 7.2, 8.1, 8.5, 8.2, 7.4, 7.8, 8.8, 7.1]

# Sort ascending by improvement — largest gain lands at top (y = n)
order         = sortperm(after_raw .- before_raw)
departments   = departments_raw[order]
before_scores = before_raw[order]
after_scores  = after_raw[order]
improvements  = after_scores .- before_scores

n     = length(departments)
y_pos = Float64.(1:n)

# Segment endpoints: pairs [before, after] per category for linesegments!
seg_x = reduce(vcat, [[before_scores[i], after_scores[i]] for i in 1:n])
seg_y = reduce(vcat, [[y_pos[i],         y_pos[i]]        for i in 1:n])

title_str = "Employee Satisfaction · dumbbell-basic · julia · makie · anyplot.ai"

fig = Figure(
    size            = (1600, 900),
    fontsize        = 14,
    backgroundcolor = PAGE_BG,
)

ax = Axis(
    fig[1, 1];
    title              = title_str,
    titlesize          = 20,
    titlecolor         = INK,
    xlabel             = "Satisfaction Score (1–10)",
    xlabelcolor        = INK,
    xlabelsize         = 14,
    ylabel             = "Department",
    ylabelcolor        = INK,
    ylabelsize         = 14,
    xticklabelcolor    = INK_SOFT,
    yticklabelcolor    = INK_SOFT,
    xticklabelsize     = 12,
    yticklabelsize     = 12,
    xtickcolor         = INK_SOFT,
    ytickcolor         = INK_SOFT,
    ytickwidth         = 0,
    backgroundcolor    = PAGE_BG,
    topspinevisible    = false,
    rightspinevisible  = false,
    leftspinecolor     = INK_SOFT,
    bottomspinecolor   = INK_SOFT,
    yticks             = (y_pos, departments),
    xgridvisible       = true,
    ygridvisible       = false,
    xgridcolor         = RGBAf(INK.r, INK.g, INK.b, 0.12),
    xminorgridvisible  = false,
    yminorgridvisible  = false,
)

# Connecting lines (subtle — should not overpower the dots)
linesegments!(ax, seg_x, seg_y; color = INK_MUTED, linewidth = 2.0)

# Dots: pre-program (first series, brand green) and post-program (lavender)
sc1 = scatter!(ax, before_scores, y_pos;
    color       = IMPRINT_PALETTE[1],
    markersize  = 18,
    strokewidth = 0,
    label       = "Pre-Program",
)
sc2 = scatter!(ax, after_scores, y_pos;
    color       = IMPRINT_PALETTE[2],
    markersize  = 18,
    strokewidth = 0,
    label       = "Post-Program",
)

# Gain delta labels centred above each segment — standout gains (≥ 2.0 pts) are darker/larger
for i in 1:n
    mid_x       = (before_scores[i] + after_scores[i]) / 2
    delta       = round(improvements[i]; digits = 1)
    is_standout = improvements[i] >= 2.0
    text!(ax, mid_x, y_pos[i] + 0.40;
        text     = "+$(delta)",
        color    = is_standout ? INK_SOFT : INK_MUTED,
        fontsize = is_standout ? 11 : 9,
        align    = (:center, :bottom),
    )
end

axislegend(ax;
    position        = :rt,
    backgroundcolor = ELEVATED_BG,
    framecolor      = INK_SOFT,
    labelcolor      = INK_SOFT,
    labelsize       = 12,
    framewidth      = 1,
)

xlims!(ax, 4.2, 10.0)
ylims!(ax, 0.5, Float64(n) + 0.8)

save("plot-$(THEME).png", fig; px_per_unit = 2)
Runnable source as JSON, for any HTTP client: https://api.anyplot.ai/specs/dumbbell-basic/makie/code. Any spec id and library id listed in llms-full.txt fit the same URL shape; every URL below is complete and callable.
{
  "spec_id": "dumbbell-basic",
  "language": "julia",
  "library": "makie",
  "page": "https://anyplot.ai/dumbbell-basic/julia/makie",
  "hub": "https://anyplot.ai/dumbbell-basic",
  "code_json": "https://api.anyplot.ai/specs/dumbbell-basic/makie/code",
  "spec_json": "https://api.anyplot.ai/specs/dumbbell-basic",
  "render_light_png": "https://storage.googleapis.com/anyplot-images/plots/dumbbell-basic/julia/makie/plot-light.png",
  "render_dark_png": "https://storage.googleapis.com/anyplot-images/plots/dumbbell-basic/julia/makie/plot-dark.png",
  "quality_score": 88.0,
  "license": "MIT",
  "guide": "https://anyplot.ai/llms.txt"
}
Part of Basic Dumbbell Chart on anyplot.ai.