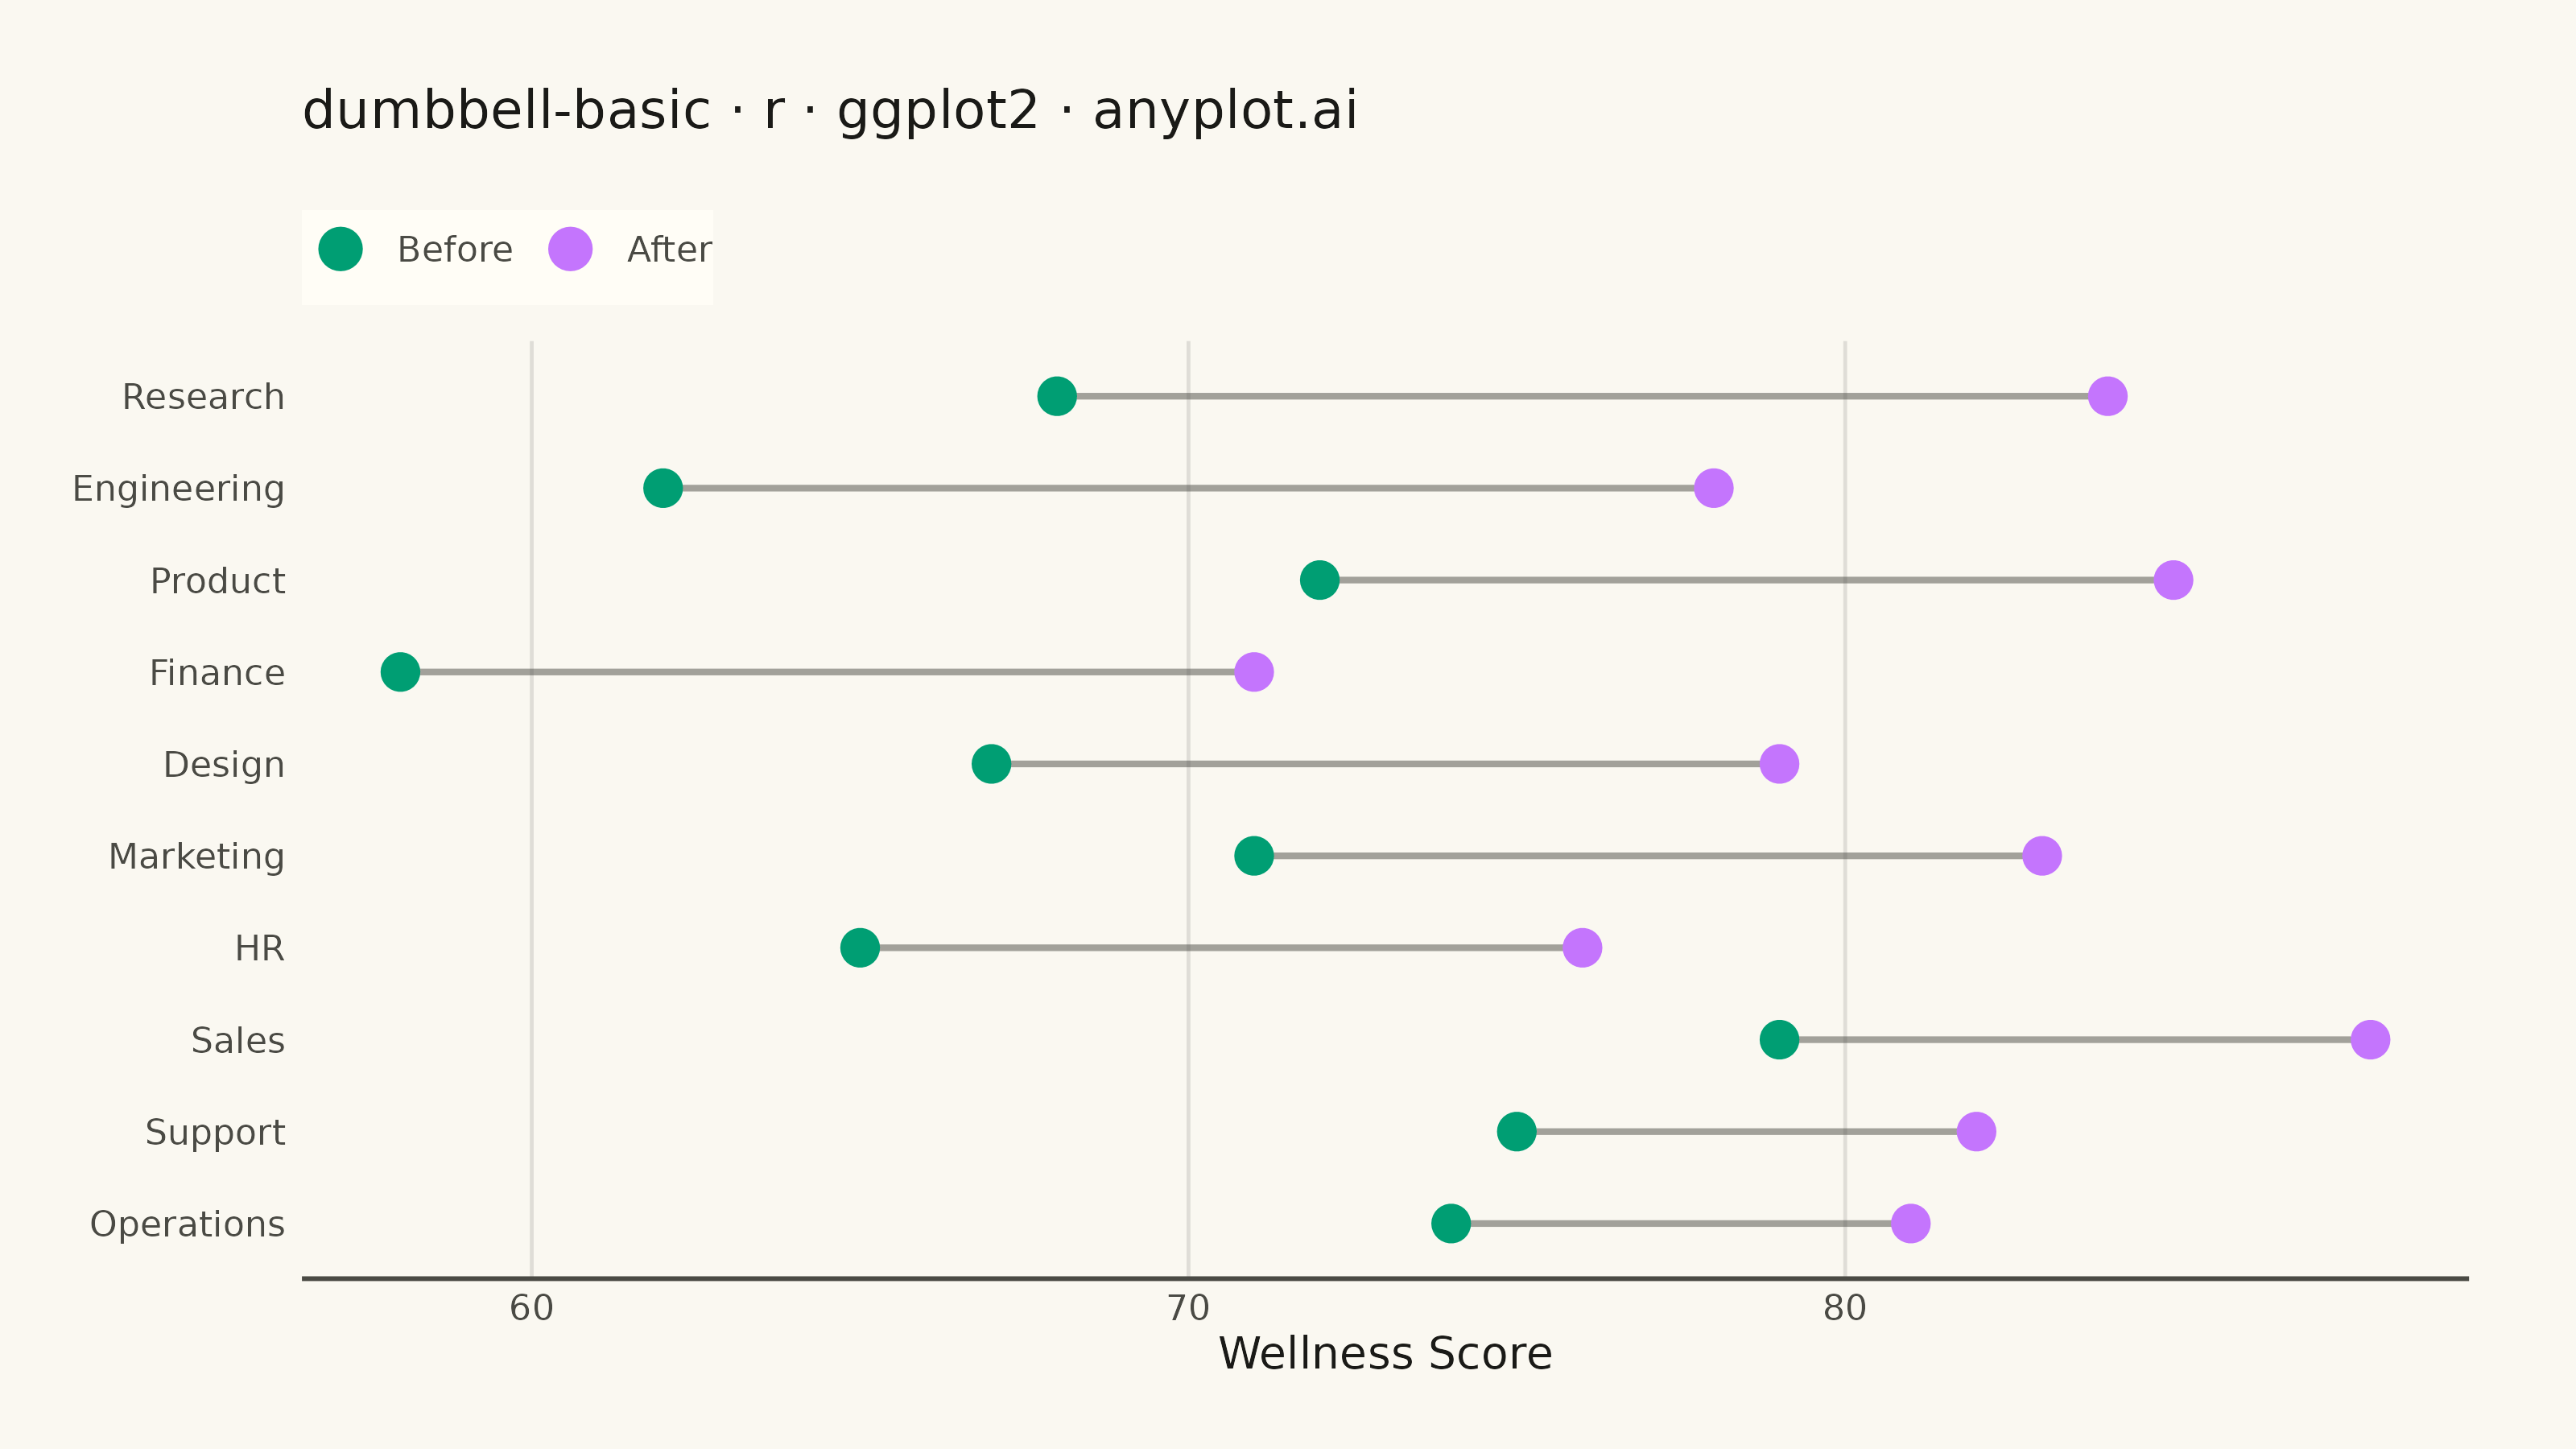
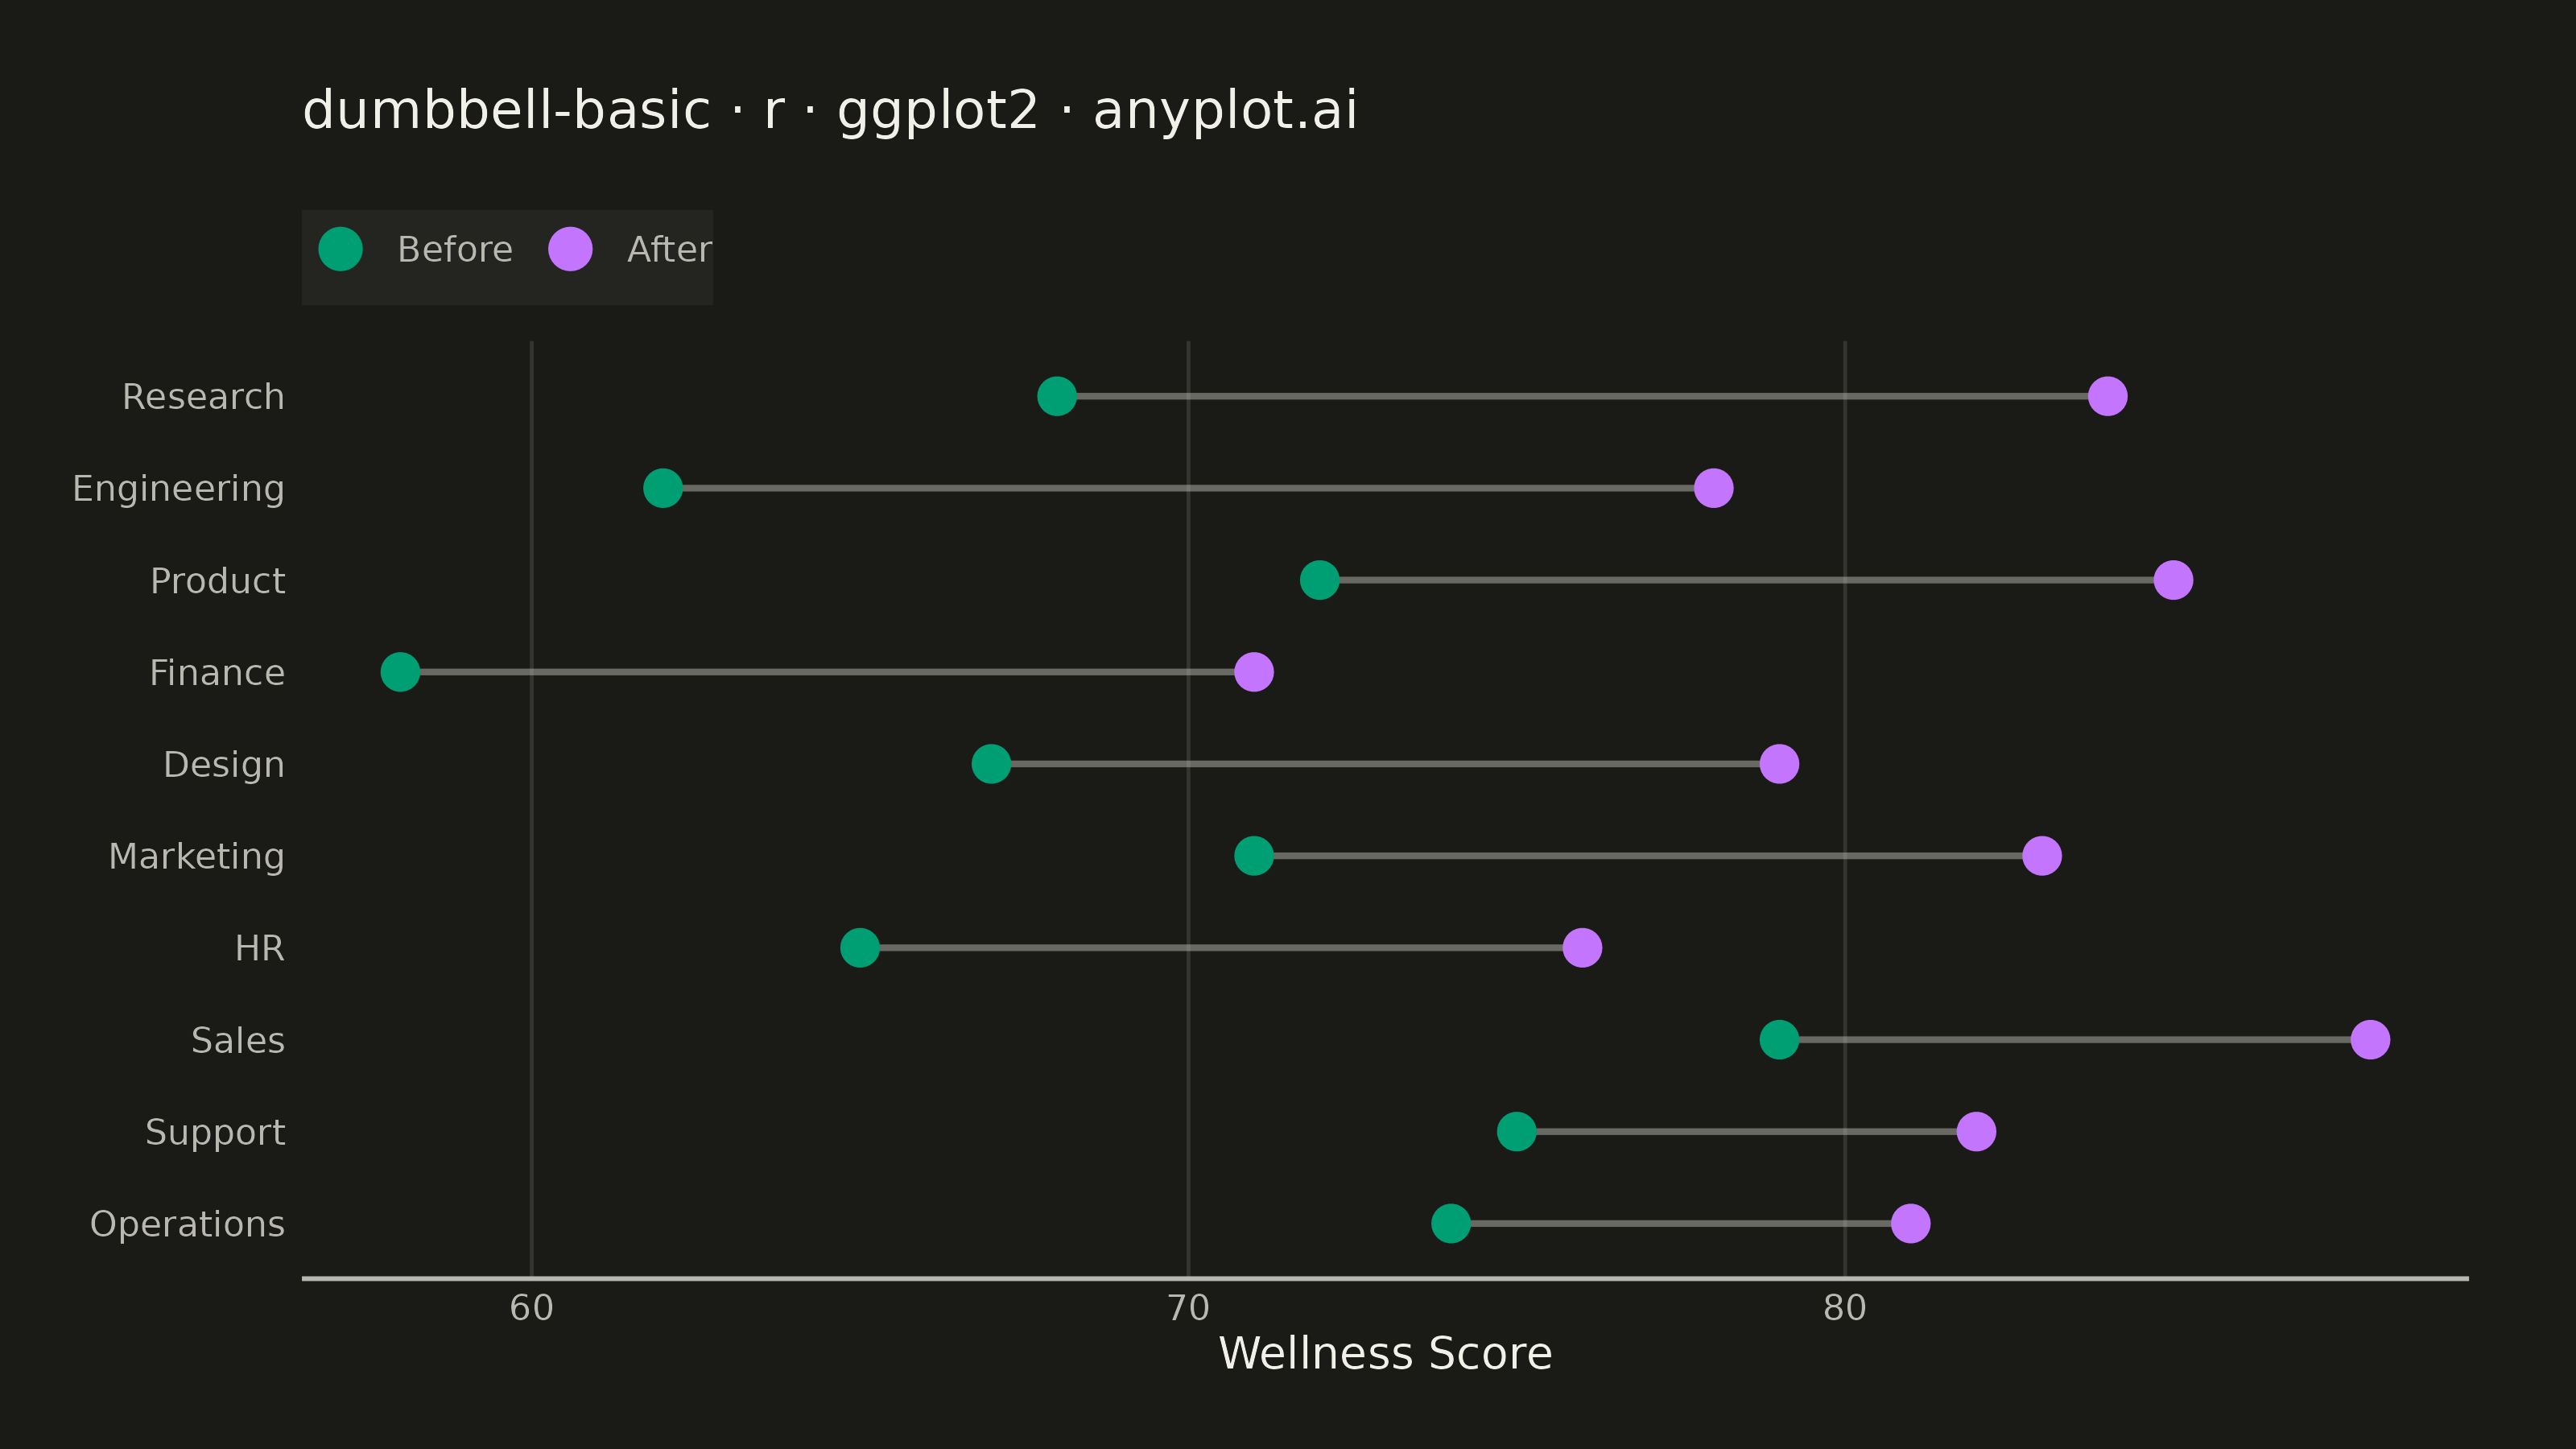
The same plot in 14 other libraries — Python: Altair, Bokeh, lets-plot, Matplotlib, Plotly, plotnine, Pygal, Seaborn; Julia: Makie.jl; JavaScript: Chart.js, D3.js, Apache ECharts, Highcharts, MUI X Charts. Compare all 15 side by side: Basic Dumbbell Chart in Python, R, Julia and JavaScript.
A dumbbell chart (also called a connected dot plot or Cleveland dot plot) compares two values for each category by displaying two dots connected by a line. It effectively visualizes differences, changes, or ranges between two data points such as before/after comparisons, gaps, or min/max values. The connected dots make it easy to see both the magnitude and direction of change.
#' anyplot.ai
#' dumbbell-basic: Basic Dumbbell Chart
#' Library: ggplot2 3.5.1 | R 4.4.1
#' Quality: 90/100 | Created: 2026-06-30

library(ggplot2)
library(ragg)

set.seed(42)

# Theme tokens
THEME       <- Sys.getenv("ANYPLOT_THEME", "light")
PAGE_BG     <- if (THEME == "light") "#FAF8F1" else "#1A1A17"
ELEVATED_BG <- if (THEME == "light") "#FFFDF6" else "#242420"
INK         <- if (THEME == "light") "#1A1A17" else "#F0EFE8"
INK_SOFT    <- if (THEME == "light") "#4A4A44" else "#B8B7B0"
GRID_COLOR  <- adjustcolor(INK, alpha.f = 0.12)

# Imprint palette (hybrid-v3 sort order)
IMPRINT_PALETTE <- c(
  "#009E73",  # 1 — brand green → Before score
  "#C475FD",  # 2 — lavender    → After score
  "#4467A3", "#BD8233", "#AE3030", "#2ABCCD", "#954477", "#99B314"
)

# Data: department wellness scores before and after a workplace initiative
departments <- c("Engineering", "Marketing", "Finance", "Operations",
                 "Research", "Sales", "HR", "Product", "Design", "Support")
before <- c(62, 71, 58, 74, 68, 79, 65, 72, 67, 75)
after  <- c(78, 83, 71, 81, 84, 88, 76, 85, 79, 82)

df <- data.frame(
  department = departments,
  before     = before,
  after      = after,
  diff       = after - before
)

# Sort by improvement so largest gains appear at the top
df            <- df[order(df$diff), ]
df$department <- factor(df$department, levels = df$department)

# Plot
p <- ggplot(df) +
  geom_segment(
    aes(x = before, xend = after, y = department, yend = department),
    color     = INK_SOFT,
    linewidth = 0.7,
    alpha     = 0.5
  ) +
  geom_point(
    aes(x = before, y = department, color = "Before"),
    size = 3.5
  ) +
  geom_point(
    aes(x = after, y = department, color = "After"),
    size = 3.5
  ) +
  scale_color_manual(
    values = c("Before" = IMPRINT_PALETTE[1], "After" = IMPRINT_PALETTE[2]),
    breaks = c("Before", "After"),
    name   = NULL
  ) +
  scale_x_continuous(
    expand = expansion(mult = 0.05)
  ) +
  labs(
    x     = "Wellness Score",
    y     = NULL,
    title = "dumbbell-basic · r · ggplot2 · anyplot.ai"
  ) +
  theme_minimal(base_size = 8) +
  theme(
    plot.background    = element_rect(fill = PAGE_BG,     color = PAGE_BG),
    panel.background   = element_rect(fill = PAGE_BG,     color = NA),
    panel.grid.major.x = element_line(color = GRID_COLOR, linewidth = 0.4),
    panel.grid.major.y = element_blank(),
    panel.grid.minor   = element_blank(),
    panel.border       = element_blank(),
    axis.line.x        = element_line(color = INK_SOFT,   linewidth = 0.5),
    axis.ticks         = element_blank(),
    axis.title         = element_text(color = INK,        size = 10),
    axis.text          = element_text(color = INK_SOFT,   size = 8),
    plot.title         = element_text(color = INK,        size = 12,
                                      margin = margin(b = 16)),
    plot.margin        = margin(t = 20, r = 24, b = 16, l = 16),
    legend.position    = "top",
    legend.justification = "left",
    legend.background  = element_rect(fill = ELEVATED_BG, color = NA),
    legend.text        = element_text(color = INK_SOFT,   size = 8),
    legend.key         = element_rect(fill = NA,           color = NA),
    legend.margin      = margin(b = 4)
  ) +
  guides(color = guide_legend(override.aes = list(size = 4)))

# Save
ggsave(
  filename = sprintf("plot-%s.png", THEME),
  plot     = p,
  device   = ragg::agg_png,
  width    = 8,
  height   = 4.5,
  units    = "in",
  dpi      = 400
)
Runnable source as JSON, for any HTTP client: https://api.anyplot.ai/specs/dumbbell-basic/ggplot2/code. Any spec id and library id listed in llms-full.txt fit the same URL shape; every URL below is complete and callable.
{
  "spec_id": "dumbbell-basic",
  "language": "r",
  "library": "ggplot2",
  "page": "https://anyplot.ai/dumbbell-basic/r/ggplot2",
  "hub": "https://anyplot.ai/dumbbell-basic",
  "code_json": "https://api.anyplot.ai/specs/dumbbell-basic/ggplot2/code",
  "spec_json": "https://api.anyplot.ai/specs/dumbbell-basic",
  "render_light_png": "https://storage.googleapis.com/anyplot-images/plots/dumbbell-basic/r/ggplot2/plot-light.png",
  "render_dark_png": "https://storage.googleapis.com/anyplot-images/plots/dumbbell-basic/r/ggplot2/plot-dark.png",
  "quality_score": 90.0,
  "license": "MIT",
  "guide": "https://anyplot.ai/llms.txt"
}
Part of Basic Dumbbell Chart on anyplot.ai.