The same plot in 14 other libraries — JavaScript: Chart.js, Apache ECharts, Highcharts, MUI X Charts; Python: Altair, Bokeh, lets-plot, Matplotlib, Plotly, plotnine, Pygal, Seaborn; R: ggplot2; Julia: Makie.jl. Compare all 15 side by side: Basic Dumbbell Chart in Python, R, Julia and JavaScript.
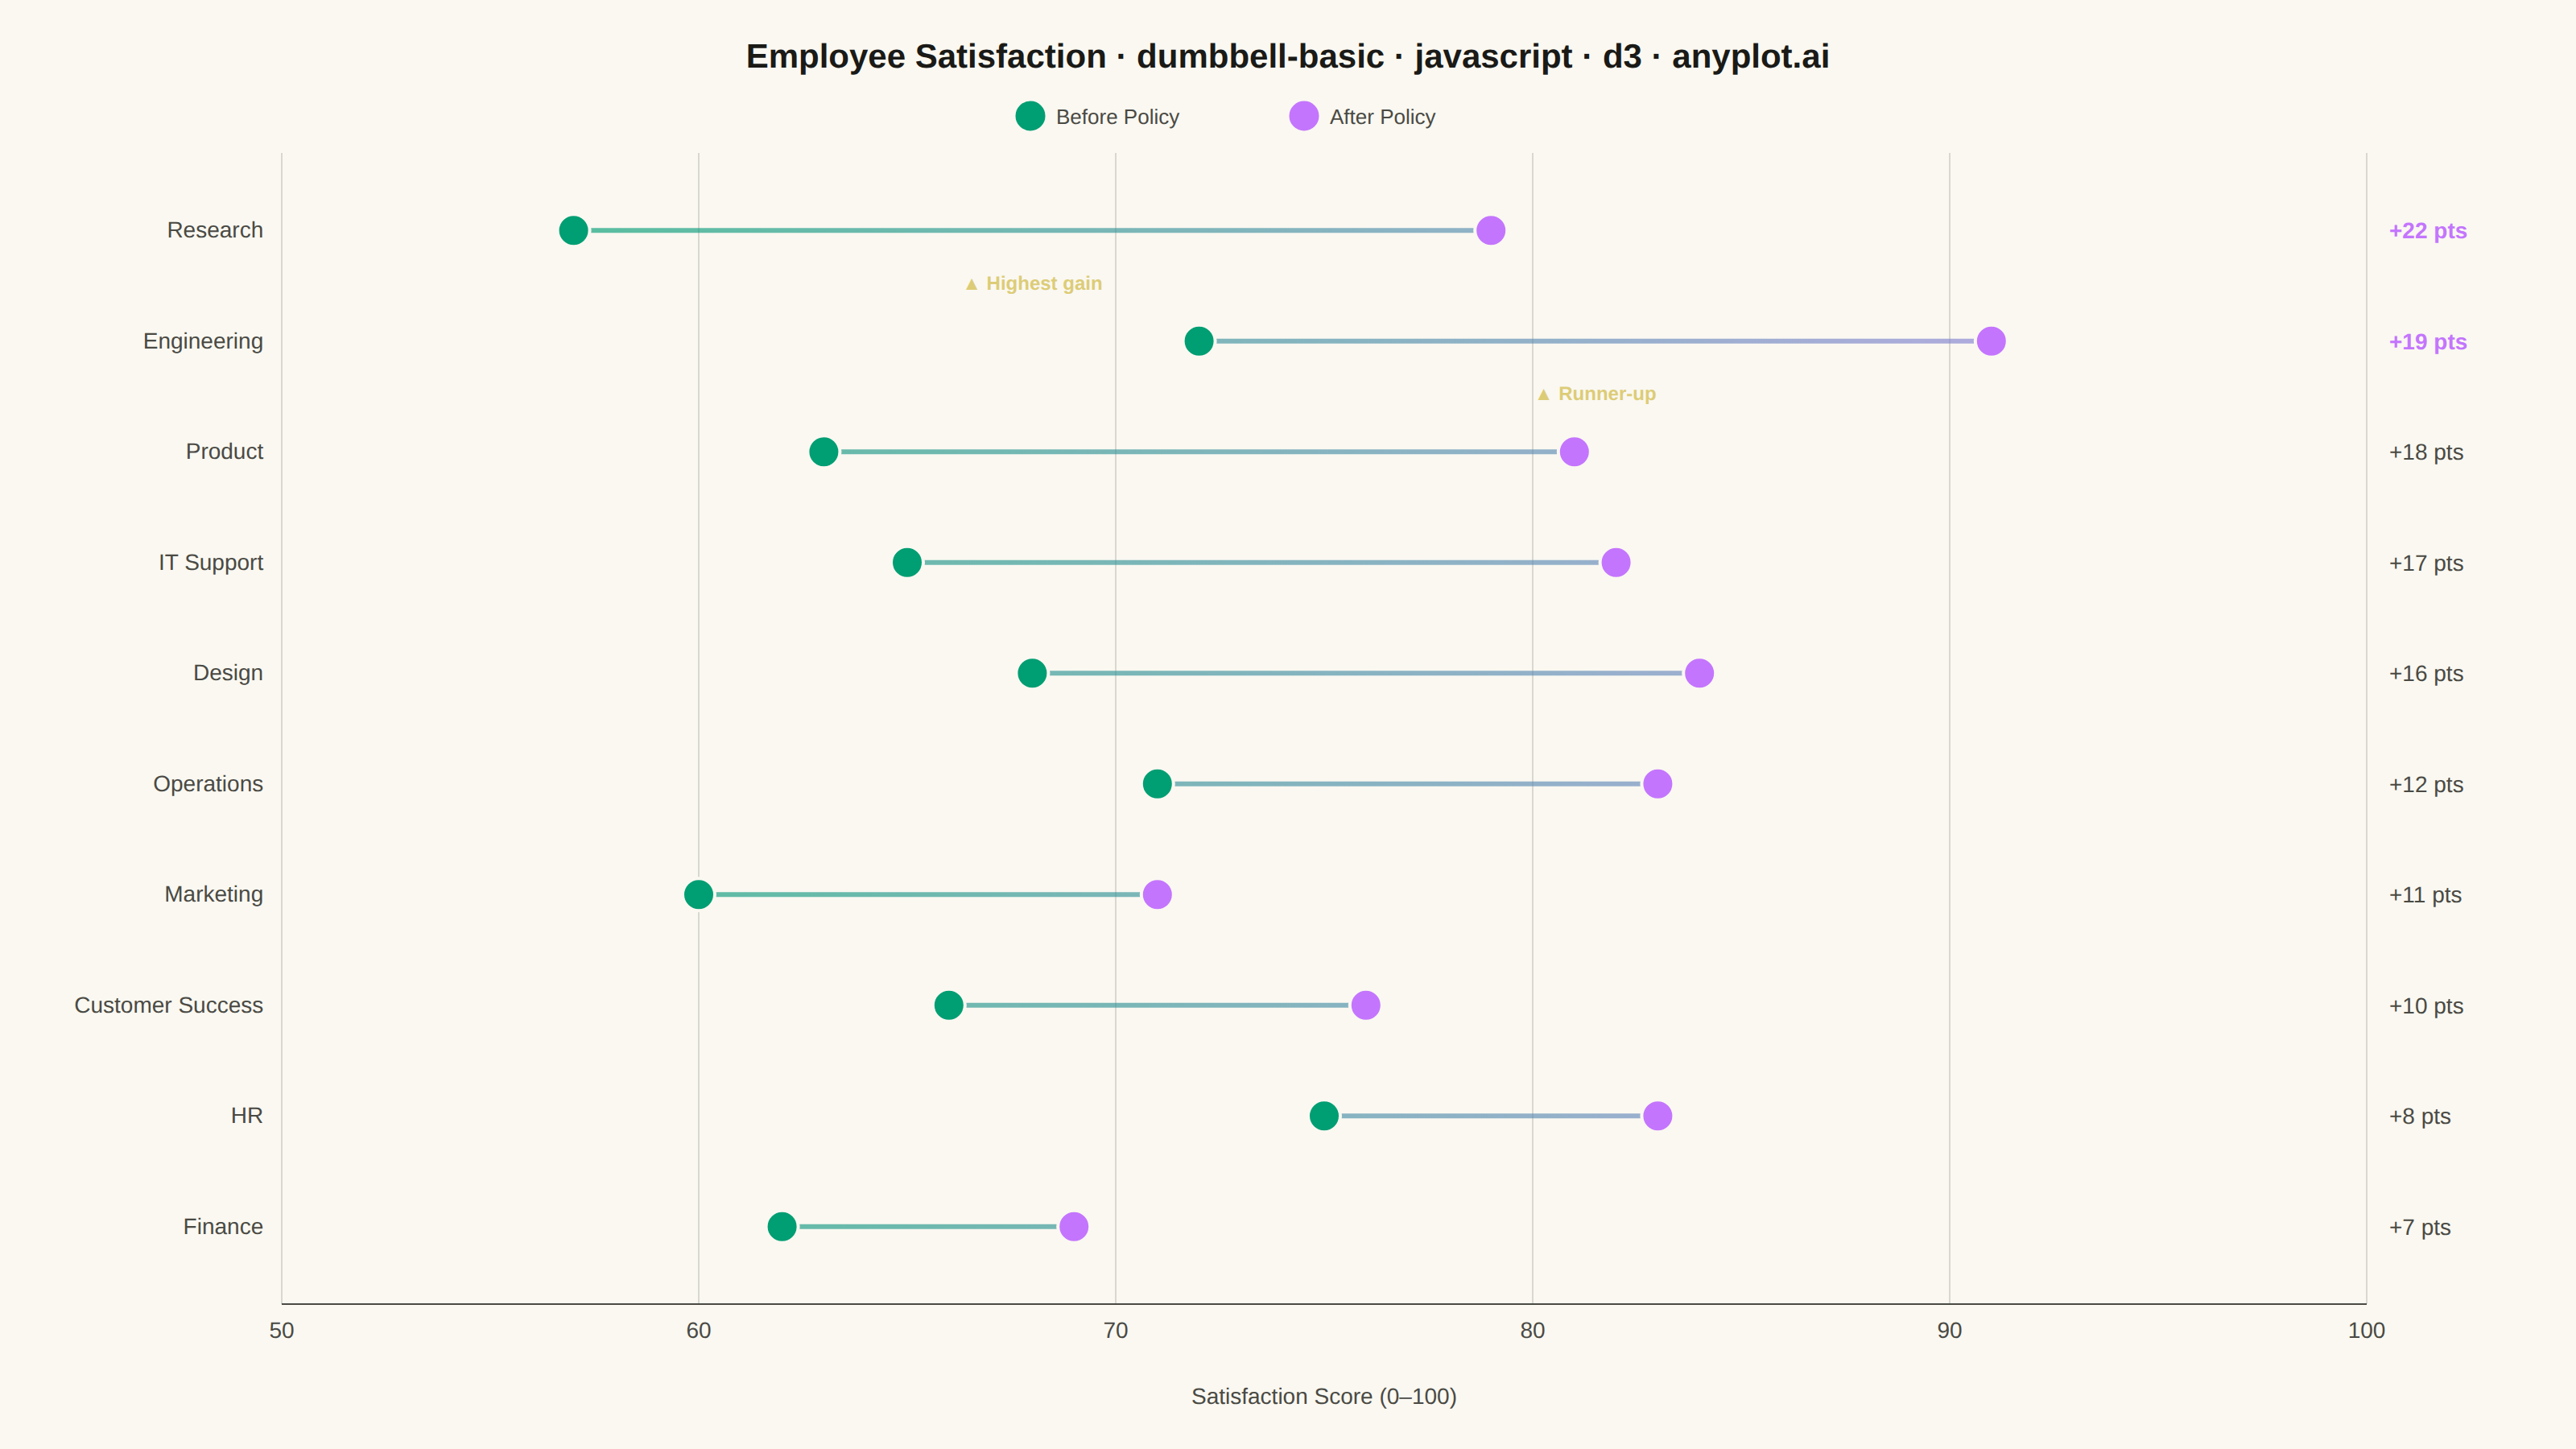
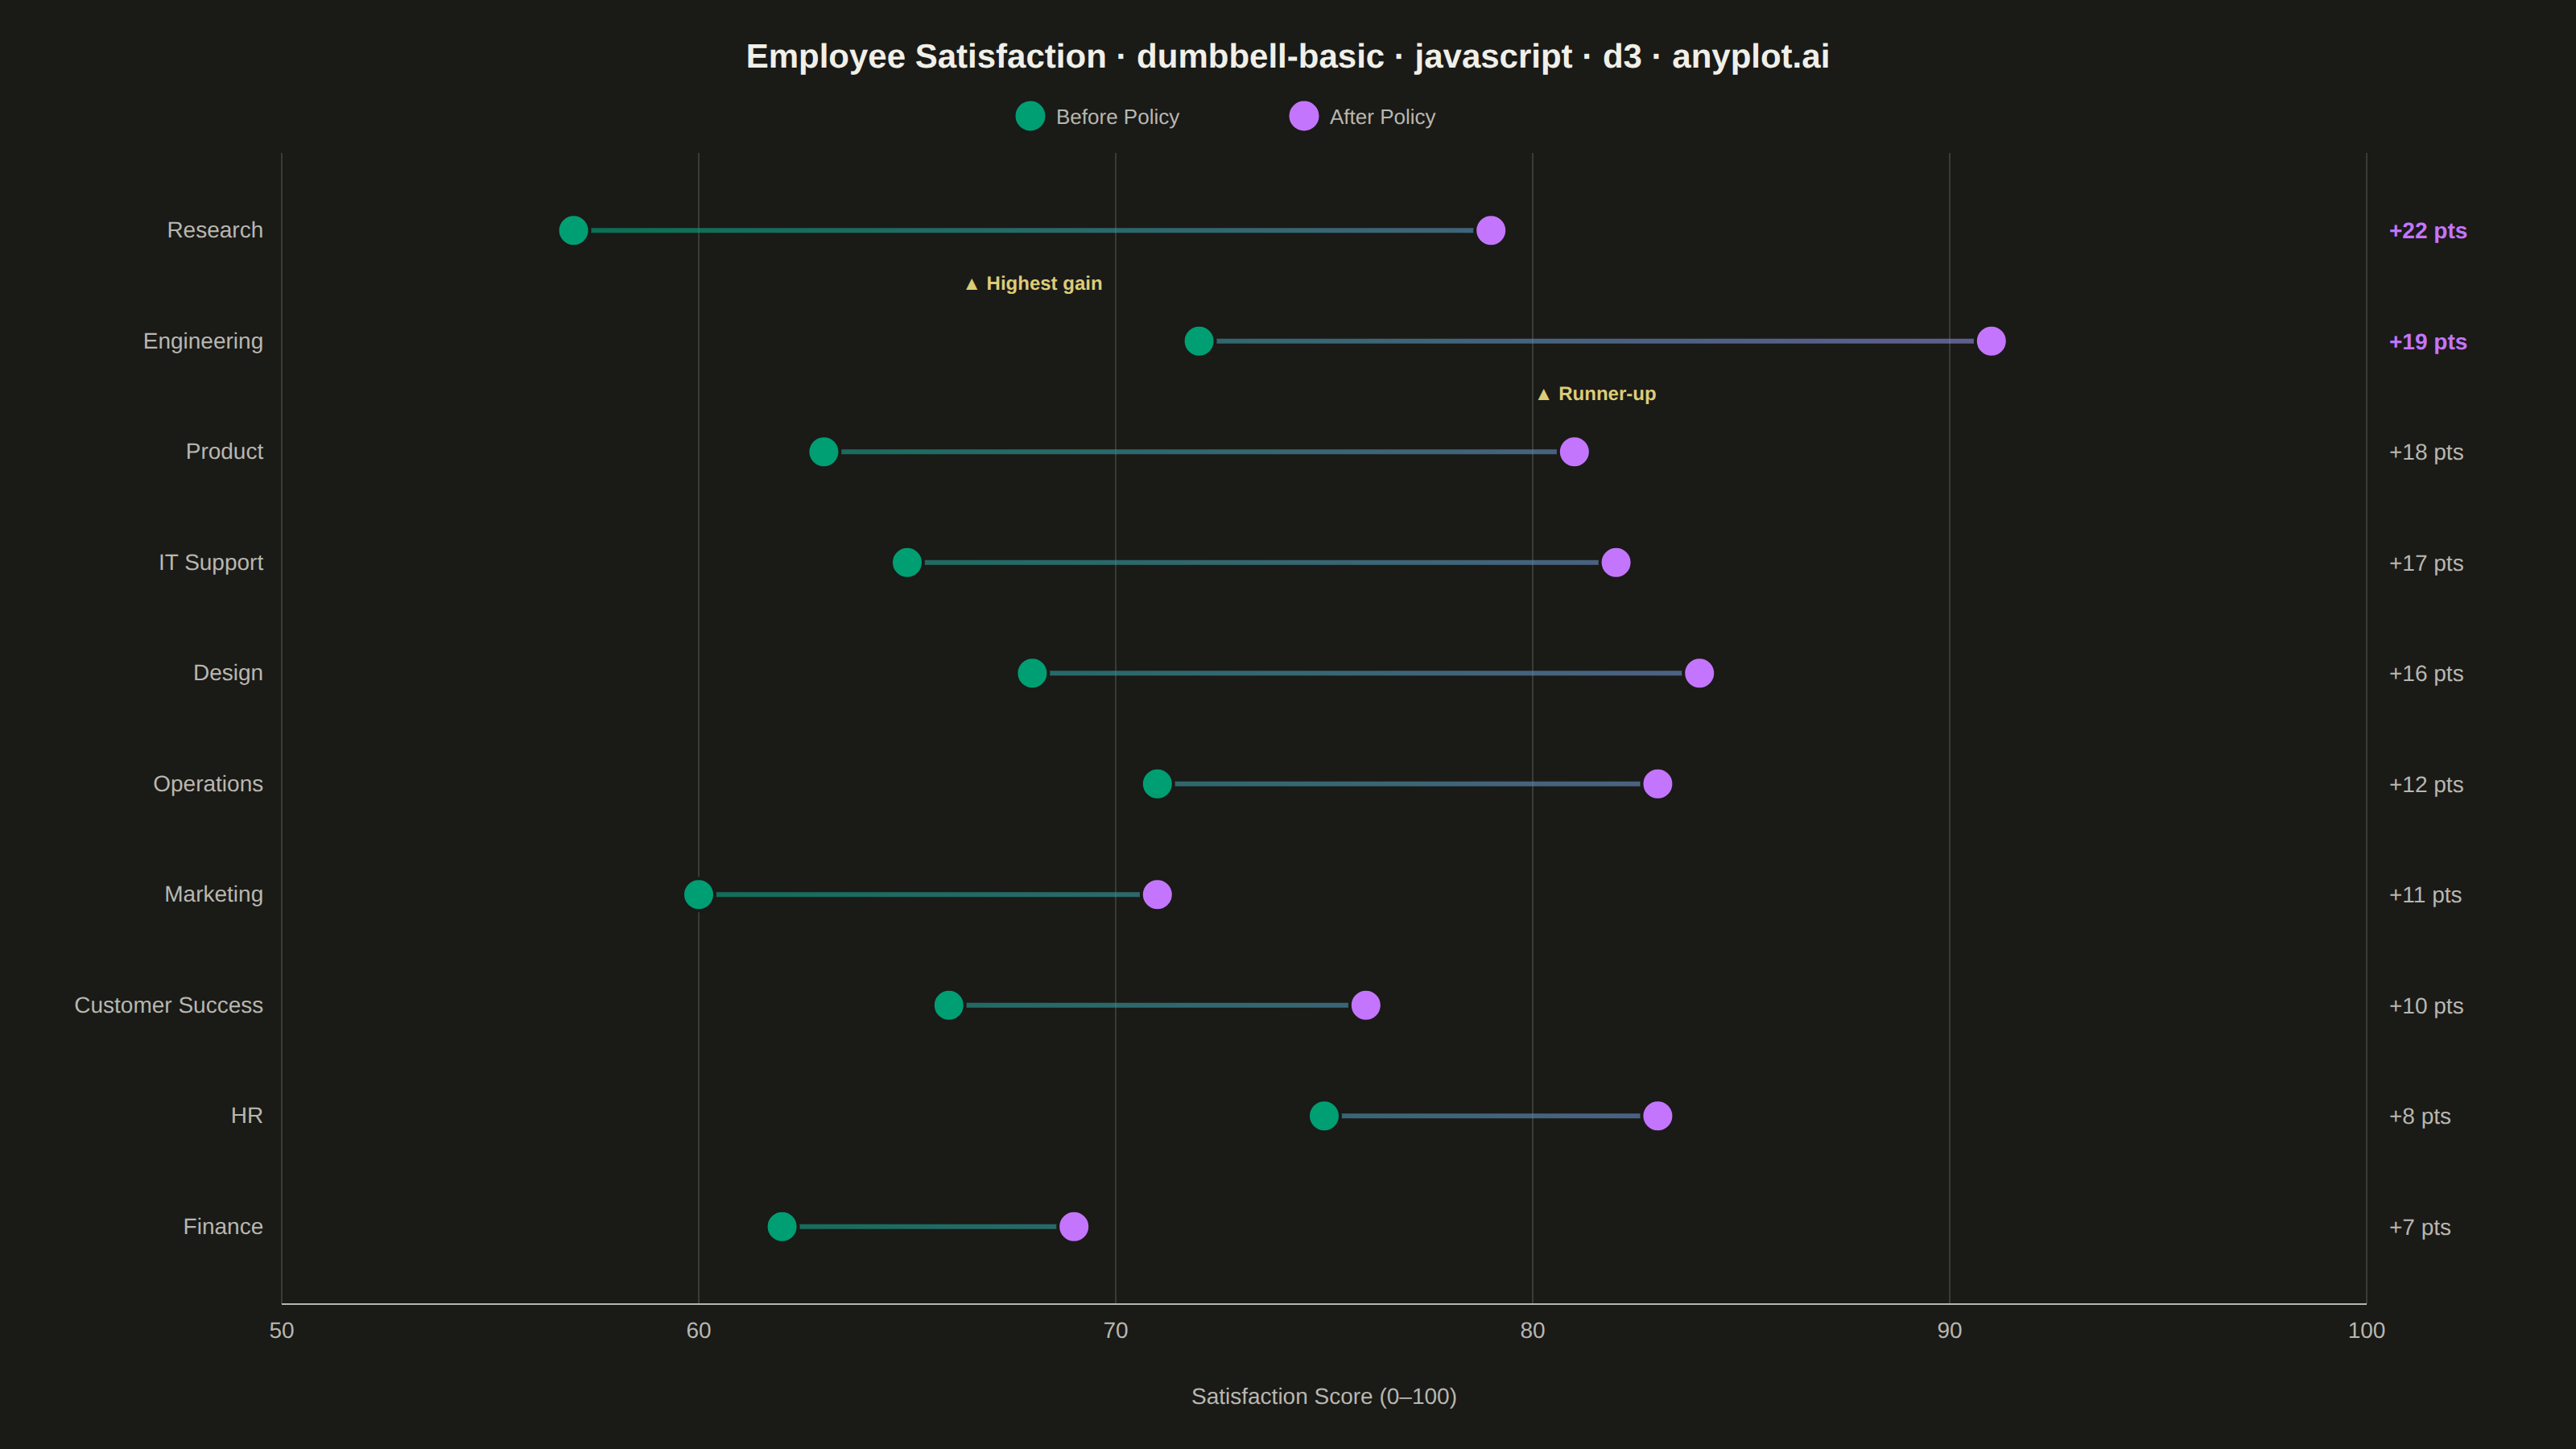
A dumbbell chart (also called a connected dot plot or Cleveland dot plot) compares two values for each category by displaying two dots connected by a line. It effectively visualizes differences, changes, or ranges between two data points such as before/after comparisons, gaps, or min/max values. The connected dots make it easy to see both the magnitude and direction of change.
// anyplot.ai
// dumbbell-basic: Basic Dumbbell Chart
// Library: d3 7.9.0 | JavaScript 22.23.1
// Quality: 91/100 | Created: 2026-06-30

const t = window.ANYPLOT_TOKENS;
const { width, height } = window.ANYPLOT_SIZE;

const margin = { top: 95, right: 130, bottom: 90, left: 175 };
const iw = width - margin.left - margin.right;
const ih = height - margin.top - margin.bottom;

// Employee satisfaction scores (0–100) before and after flexible work policy
const rawData = [
  { dept: "Research",         before: 57, after: 79 },
  { dept: "Engineering",      before: 72, after: 91 },
  { dept: "Product",          before: 63, after: 81 },
  { dept: "IT Support",       before: 65, after: 82 },
  { dept: "Design",           before: 68, after: 84 },
  { dept: "Operations",       before: 71, after: 83 },
  { dept: "Marketing",        before: 60, after: 71 },
  { dept: "Customer Success", before: 66, after: 76 },
  { dept: "HR",               before: 75, after: 83 },
  { dept: "Finance",          before: 62, after: 69 },
];

// Sort by improvement (largest gap at top)
const data = rawData.slice().sort((a, b) => (b.after - b.before) - (a.after - a.before));
data.forEach(d => { d.delta = d.after - d.before; });

const svg = d3.select("#container").append("svg")
  .attr("width", width)
  .attr("height", height);

// --- D3 SVG defs: linear gradient for connecting lines (green → lavender) ---
// Defined in SVG user-space so position tracks the data scale exactly
const defs = svg.append("defs");
const grad = defs.append("linearGradient")
  .attr("id", "line-grad")
  .attr("gradientUnits", "userSpaceOnUse")
  .attr("x1", margin.left)
  .attr("x2", margin.left + iw)
  .attr("y1", 0)
  .attr("y2", 0);
grad.append("stop").attr("offset", "0%")
  .attr("stop-color", t.palette[0]).attr("stop-opacity", 0.65);
grad.append("stop").attr("offset", "100%")
  .attr("stop-color", t.palette[1]).attr("stop-opacity", 0.65);

const g = svg.append("g").attr("transform", `translate(${margin.left},${margin.top})`);

// Scales
const x = d3.scaleLinear().domain([50, 100]).range([0, iw]);
const y = d3.scaleBand()
  .domain(data.map(d => d.dept))
  .range([0, ih])
  .padding(0.4);

// Vertical gridlines
g.selectAll(".vgrid")
  .data(x.ticks(6))
  .join("line")
  .attr("x1", d => x(d))
  .attr("x2", d => x(d))
  .attr("y1", 0)
  .attr("y2", ih)
  .attr("stroke", t.grid)
  .attr("stroke-width", 1);

// X-axis — d3.format("d") produces clean integers with no decimal noise
const xAxisG = g.append("g")
  .attr("transform", `translate(0,${ih})`)
  .call(d3.axisBottom(x).ticks(6).tickSize(0).tickFormat(d3.format("d")));

xAxisG.select(".domain").attr("stroke", t.inkSoft);
xAxisG.selectAll(".tick text")
  .attr("fill", t.inkSoft)
  .style("font-size", "14px")
  .attr("dy", "1.3em");
xAxisG.selectAll(".tick line").remove();

// Y-axis (no domain line — categories self-label)
const yAxisG = g.append("g")
  .call(d3.axisLeft(y).tickSize(0));

yAxisG.select(".domain").remove();
yAxisG.selectAll(".tick text")
  .attr("fill", t.inkSoft)
  .style("font-size", "14px")
  .attr("dx", "-0.6em");

// Connecting lines — gradient stroke encodes before→after direction
g.selectAll(".dumbbell-line")
  .data(data)
  .join("line")
  .attr("x1", d => x(d.before))
  .attr("x2", d => x(d.after))
  .attr("y1", d => y(d.dept) + y.bandwidth() / 2)
  .attr("y2", d => y(d.dept) + y.bandwidth() / 2)
  .attr("stroke", "url(#line-grad)")
  .attr("stroke-width", 3);

// Before dots (Imprint palette[0] — brand green)
g.selectAll(".dot-before")
  .data(data)
  .join("circle")
  .attr("cx", d => x(d.before))
  .attr("cy", d => y(d.dept) + y.bandwidth() / 2)
  .attr("r", 10)
  .attr("fill", t.palette[0])
  .attr("stroke", t.pageBg)
  .attr("stroke-width", 2);

// After dots (Imprint palette[1] — lavender)
g.selectAll(".dot-after")
  .data(data)
  .join("circle")
  .attr("cx", d => x(d.after))
  .attr("cy", d => y(d.dept) + y.bandwidth() / 2)
  .attr("r", 10)
  .attr("fill", t.palette[1])
  .attr("stroke", t.pageBg)
  .attr("stroke-width", 2);

// Delta labels — d3.format("+d") shows signed improvement for each row
const deltaFmt = d3.format("+d");
g.selectAll(".delta-label")
  .data(data)
  .join("text")
  .attr("x", iw + 14)
  .attr("y", d => y(d.dept) + y.bandwidth() / 2 + 5)
  .attr("fill", (d, i) => i < 2 ? t.palette[1] : t.inkSoft)
  .style("font-size", "14px")
  .style("font-weight", (d, i) => i < 2 ? "700" : "400")
  .text(d => deltaFmt(d.delta) + " pts");

// Callout annotations for top 2 improvements — placed in the gap below each band
const annLabels = ["▲ Highest gain", "▲ Runner-up"];
data.slice(0, 2).forEach((d, i) => {
  const xMid = (x(d.before) + x(d.after)) / 2;
  const yAnn = y(d.dept) + y.bandwidth() + 6;
  g.append("text")
    .attr("x", xMid)
    .attr("y", yAnn + 10)
    .attr("text-anchor", "middle")
    .attr("fill", t.amber)
    .style("font-size", "12px")
    .style("font-weight", "600")
    .text(annLabels[i]);
});

// X-axis label
g.append("text")
  .attr("x", iw / 2)
  .attr("y", ih + 62)
  .attr("text-anchor", "middle")
  .attr("fill", t.inkSoft)
  .style("font-size", "14px")
  .text("Satisfaction Score (0–100)");

// Legend (horizontal, centered below title in top margin)
const legendItems = [
  { label: "Before Policy", color: t.palette[0] },
  { label: "After Policy",  color: t.palette[1] },
];
const legendSpacing = 170;
const legendStartX = (width - legendItems.length * legendSpacing) / 2;
const legendY = 72;

legendItems.forEach((item, i) => {
  const lx = legendStartX + i * legendSpacing;
  svg.append("circle")
    .attr("cx", lx + 10).attr("cy", legendY)
    .attr("r", 10)
    .attr("fill", item.color)
    .attr("stroke", t.pageBg)
    .attr("stroke-width", 1.5);
  svg.append("text")
    .attr("x", lx + 26).attr("y", legendY + 5)
    .attr("fill", t.inkSoft)
    .style("font-size", "13px")
    .text(item.label);
});

// Title — font-size scaled for long descriptive title
const title = "Employee Satisfaction · dumbbell-basic · javascript · d3 · anyplot.ai";
const titleFontSize = title.length > 67 ? Math.round(22 * 67 / title.length) : 22;

svg.append("text")
  .attr("x", width / 2)
  .attr("y", 42)
  .attr("text-anchor", "middle")
  .attr("fill", t.ink)
  .style("font-size", `${titleFontSize}px`)
  .style("font-weight", "600")
  .text(title);
Runnable source as JSON, for any HTTP client: https://api.anyplot.ai/specs/dumbbell-basic/d3/code. Any spec id and library id listed in llms-full.txt fit the same URL shape; every URL below is complete and callable.
{
  "spec_id": "dumbbell-basic",
  "language": "javascript",
  "library": "d3",
  "page": "https://anyplot.ai/dumbbell-basic/javascript/d3",
  "hub": "https://anyplot.ai/dumbbell-basic",
  "code_json": "https://api.anyplot.ai/specs/dumbbell-basic/d3/code",
  "spec_json": "https://api.anyplot.ai/specs/dumbbell-basic",
  "render_light_png": "https://storage.googleapis.com/anyplot-images/plots/dumbbell-basic/javascript/d3/plot-light.png",
  "render_dark_png": "https://storage.googleapis.com/anyplot-images/plots/dumbbell-basic/javascript/d3/plot-dark.png",
  "interactive_light_html": "https://storage.googleapis.com/anyplot-images/plots/dumbbell-basic/javascript/d3/plot-light.html",
  "interactive_dark_html": "https://storage.googleapis.com/anyplot-images/plots/dumbbell-basic/javascript/d3/plot-dark.html",
  "quality_score": 91.0,
  "license": "MIT",
  "guide": "https://anyplot.ai/llms.txt"
}
Part of Basic Dumbbell Chart on anyplot.ai.