The same plot in 14 other libraries — JavaScript: D3.js, Apache ECharts, Highcharts, MUI X Charts; Python: Altair, Bokeh, lets-plot, Matplotlib, Plotly, plotnine, Pygal, Seaborn; R: ggplot2; Julia: Makie.jl. Compare all 15 side by side: Basic Error Bar Plot in Python, R, Julia and JavaScript.
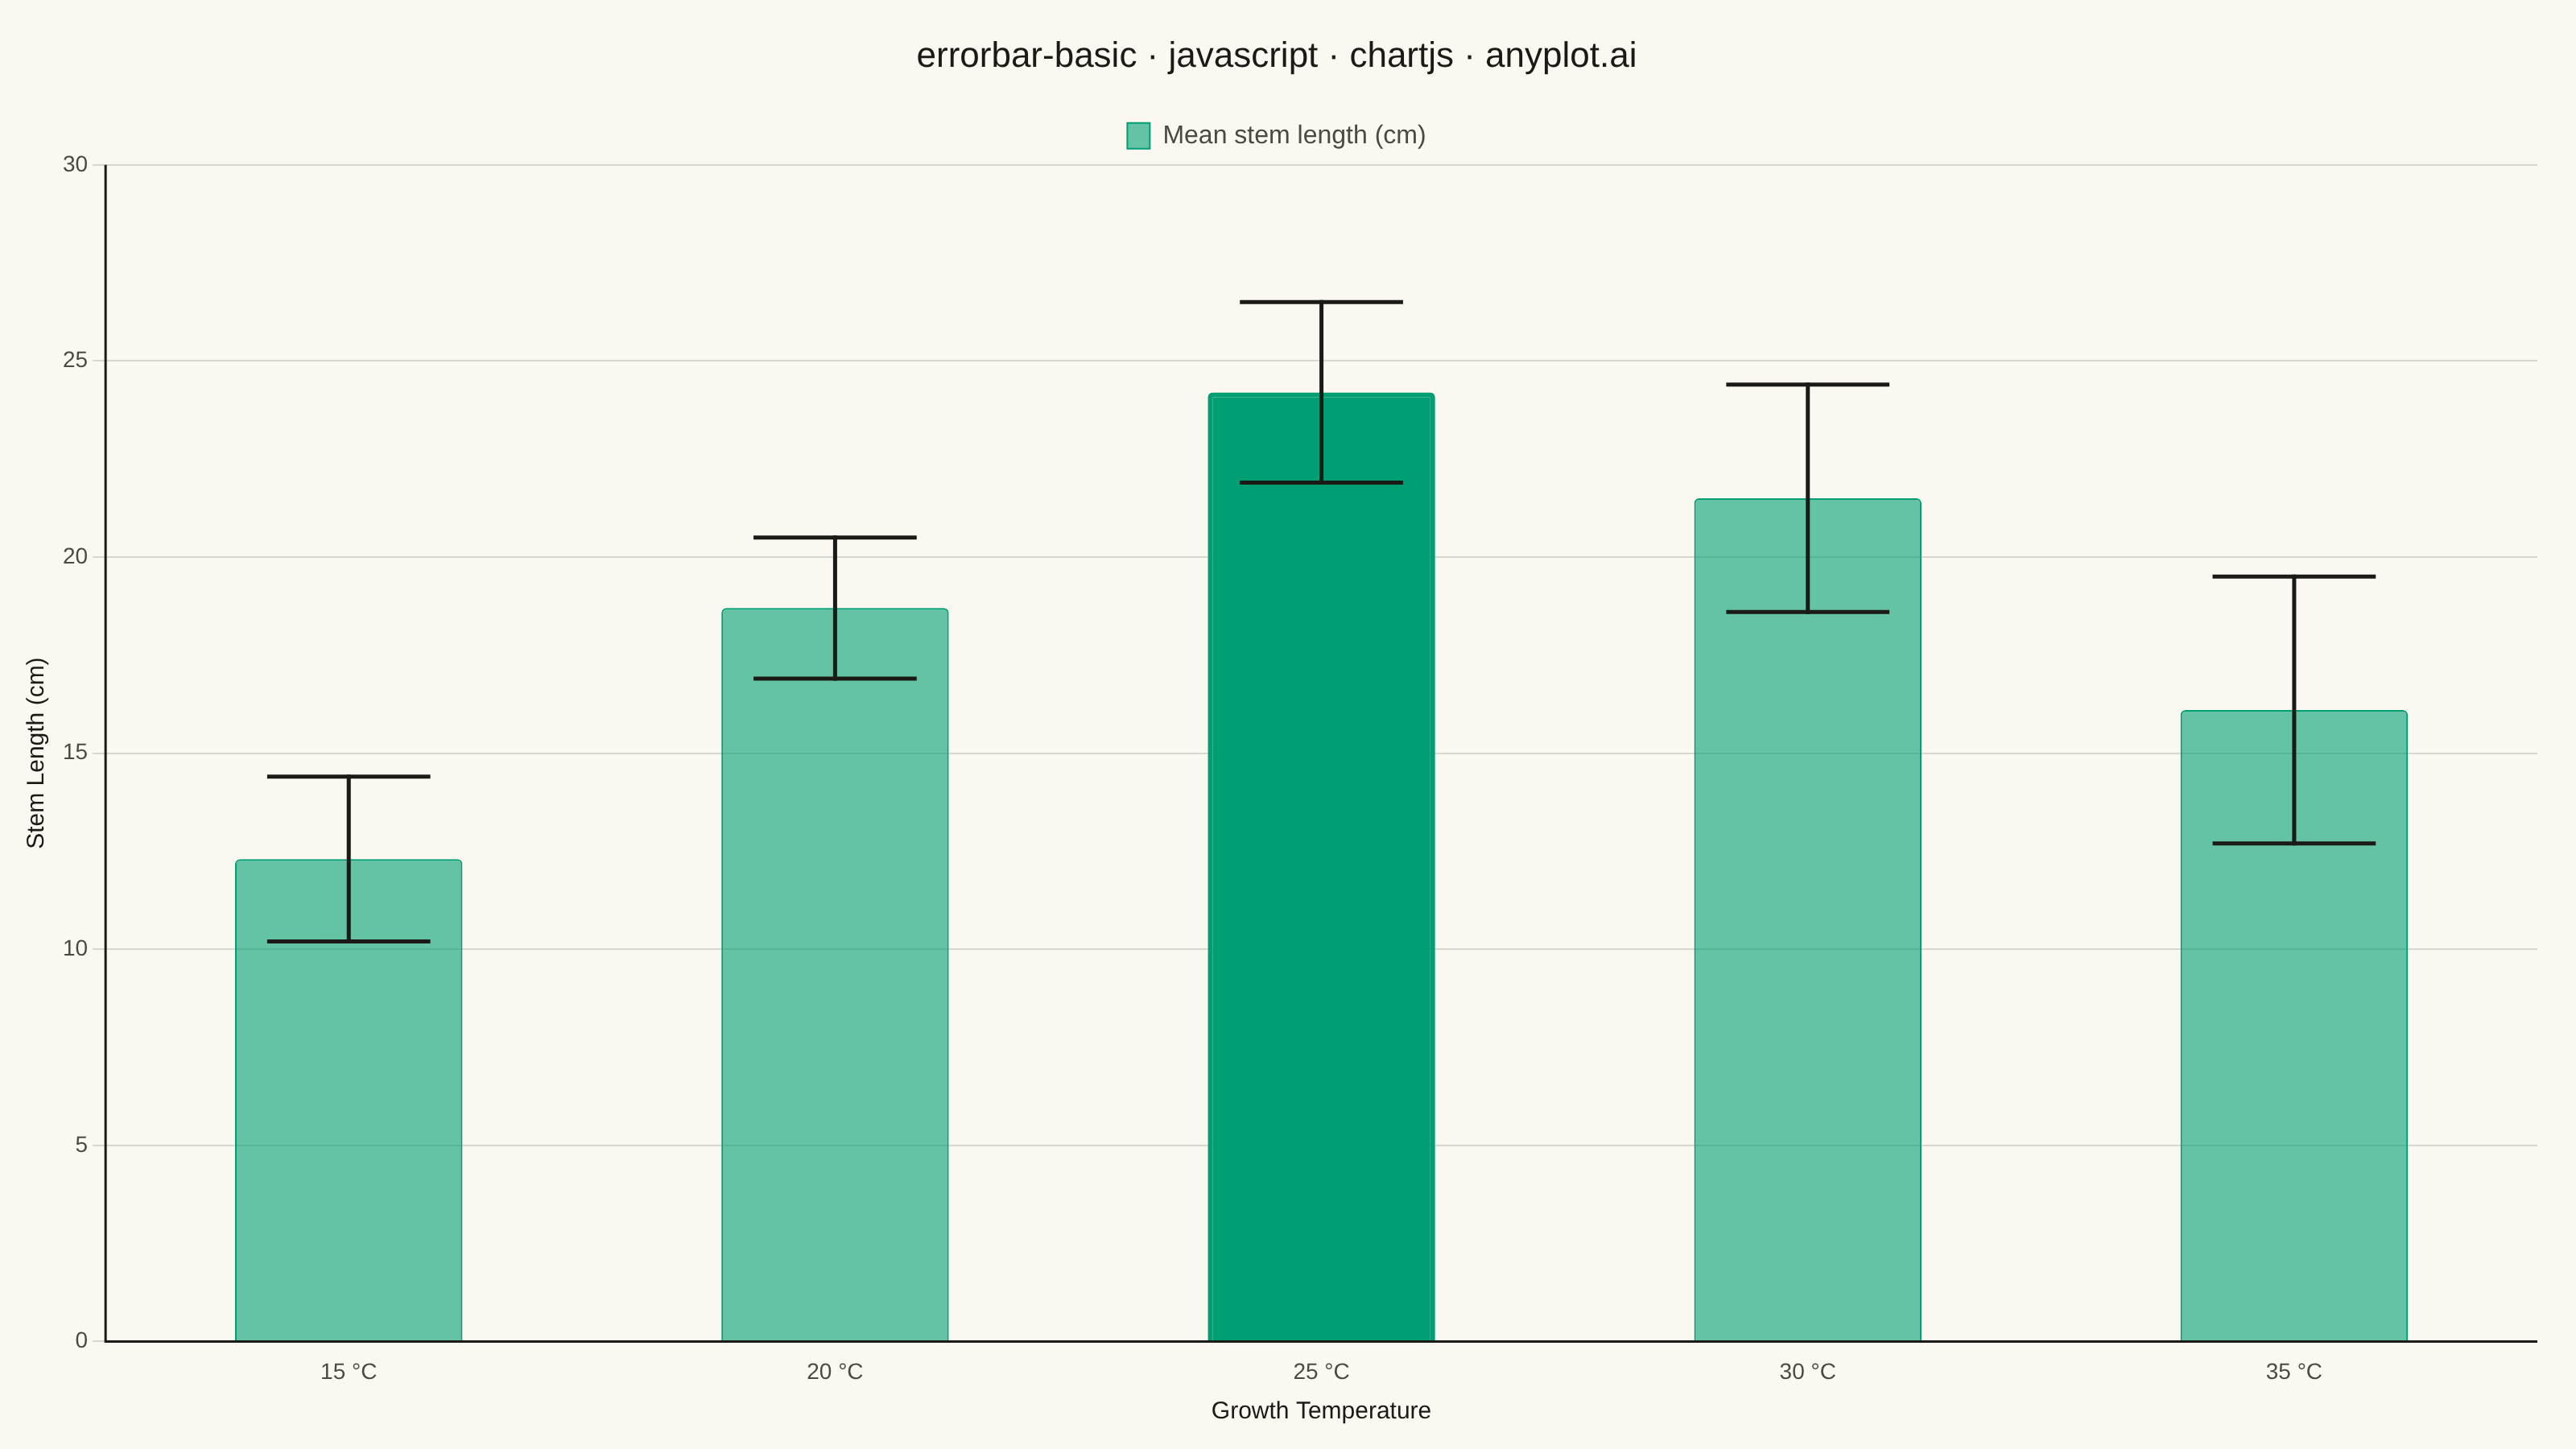
An error bar plot displays data points with associated uncertainty or variability represented by bars extending above and below (or left and right of) each point. Error bars commonly represent standard deviation, standard error, confidence intervals, or min/max ranges. This visualization is essential for communicating the reliability and precision of measurements or statistical estimates.
// anyplot.ai
// errorbar-basic: Basic Error Bar Plot
// Library: chartjs 4.4.7 | JavaScript 22.23.0
// Quality: 90/100 | Created: 2026-06-30

const t = window.ANYPLOT_TOKENS;

// Temperature × plant growth study: mean stem length (cm) ± 1 SD across 5 conditions
const labels = ["15 °C", "20 °C", "25 °C", "30 °C", "35 °C"];
const means  = [12.3, 18.7, 24.2, 21.5, 16.1];
const errors = [2.1,  1.8,  2.3,  2.9,  3.4];

// Peak at 25°C — full opacity to draw the eye to the inverted-U apex
const peakIdx = 2;

// Plugin: fill canvas with theme background before anything is drawn
const bgPlugin = {
  id: "bg",
  beforeDraw(chart) {
    const { ctx } = chart;
    ctx.save();
    ctx.fillStyle = t.pageBg;
    ctx.fillRect(0, 0, chart.width, chart.height);
    ctx.restore();
  },
};

// Plugin: draw L-shaped frame (left + bottom spines only) — Chart.js border.display is
// disabled on both scales so this replaces the default 4-sided box with a clean L-shape
const spinePlugin = {
  id: "spine",
  afterDraw(chart) {
    const { ctx, chartArea } = chart;
    ctx.save();
    ctx.strokeStyle = t.ink;
    ctx.lineWidth = 1.5;
    ctx.beginPath();
    ctx.moveTo(chartArea.left, chartArea.top);
    ctx.lineTo(chartArea.left, chartArea.bottom);
    ctx.lineTo(chartArea.right, chartArea.bottom);
    ctx.stroke();
    ctx.restore();
  },
};

// Plugin: I-bar error whiskers drawn over each bar after bars are rendered
const errorBarPlugin = {
  id: "errorBar",
  afterDatasetsDraw(chart) {
    const { ctx, scales } = chart;
    const meta = chart.getDatasetMeta(0);

    ctx.save();
    ctx.strokeStyle = t.ink;
    ctx.lineWidth = 2.5;
    ctx.lineCap = "square";

    meta.data.forEach((bar, i) => {
      const x   = bar.x;
      const CAP = bar.width * 0.35; // cap width proportional to bar width
      const yHi = scales.y.getPixelForValue(means[i] + errors[i]);
      const yLo = scales.y.getPixelForValue(means[i] - errors[i]);

      // Vertical stem
      ctx.beginPath();
      ctx.moveTo(x, yHi);
      ctx.lineTo(x, yLo);
      ctx.stroke();

      // Top cap
      ctx.beginPath();
      ctx.moveTo(x - CAP, yHi);
      ctx.lineTo(x + CAP, yHi);
      ctx.stroke();

      // Bottom cap
      ctx.beginPath();
      ctx.moveTo(x - CAP, yLo);
      ctx.lineTo(x + CAP, yLo);
      ctx.stroke();
    });

    ctx.restore();
  },
};

// Mount
const canvas = document.createElement("canvas");
document.getElementById("container").appendChild(canvas);

// Chart
new Chart(canvas, {
  type: "bar",
  plugins: [bgPlugin, spinePlugin, errorBarPlugin],
  data: {
    labels,
    datasets: [
      {
        label: "Mean stem length (cm)",
        data: means,
        // Peak bar (25°C) at full opacity; remaining bars at 60% to guide attention
        backgroundColor: means.map((_, i) => i === peakIdx ? t.palette[0] : t.palette[0] + "99"),
        borderColor: t.palette[0],
        borderWidth: means.map((_, i) => i === peakIdx ? 3 : 1),
        borderRadius: 3,
        barPercentage: 0.55,
        categoryPercentage: 0.85,
      },
    ],
  },
  options: {
    responsive: true,
    maintainAspectRatio: false,
    animation: false,
    layout: { padding: { top: 10, right: 24, bottom: 10, left: 10 } },
    plugins: {
      title: {
        display: true,
        text: "errorbar-basic · javascript · chartjs · anyplot.ai",
        color: t.ink,
        font: { size: 22, weight: "500" },
        padding: { top: 12, bottom: 18 },
      },
      legend: {
        labels: { color: t.inkSoft, font: { size: 16 }, boxWidth: 14 },
      },
    },
    scales: {
      x: {
        border: { display: false }, // spinePlugin draws the L-frame instead
        ticks: { color: t.inkSoft, font: { size: 14 } },
        grid: { display: false },   // Y-axis only grid for bar charts
        title: {
          display: true,
          text: "Growth Temperature",
          color: t.ink,
          font: { size: 15 },
        },
      },
      y: {
        border: { display: false }, // spinePlugin draws the L-frame instead
        min: 0,
        suggestedMax: 30,
        ticks: { color: t.inkSoft, font: { size: 14 } },
        grid: { color: t.grid },
        title: {
          display: true,
          text: "Stem Length (cm)",
          color: t.ink,
          font: { size: 15 },
        },
      },
    },
  },
});
Runnable source as JSON, for any HTTP client: https://api.anyplot.ai/specs/errorbar-basic/chartjs/code. Any spec id and library id listed in llms-full.txt fit the same URL shape; every URL below is complete and callable.
{
  "spec_id": "errorbar-basic",
  "language": "javascript",
  "library": "chartjs",
  "page": "https://anyplot.ai/errorbar-basic/javascript/chartjs",
  "hub": "https://anyplot.ai/errorbar-basic",
  "code_json": "https://api.anyplot.ai/specs/errorbar-basic/chartjs/code",
  "spec_json": "https://api.anyplot.ai/specs/errorbar-basic",
  "render_light_png": "https://storage.googleapis.com/anyplot-images/plots/errorbar-basic/javascript/chartjs/plot-light.png",
  "render_dark_png": "https://storage.googleapis.com/anyplot-images/plots/errorbar-basic/javascript/chartjs/plot-dark.png",
  "interactive_light_html": "https://storage.googleapis.com/anyplot-images/plots/errorbar-basic/javascript/chartjs/plot-light.html",
  "interactive_dark_html": "https://storage.googleapis.com/anyplot-images/plots/errorbar-basic/javascript/chartjs/plot-dark.html",
  "quality_score": 90.0,
  "license": "MIT",
  "guide": "https://anyplot.ai/llms.txt"
}
Part of Basic Error Bar Plot on anyplot.ai.