The same plot in 14 other libraries — JavaScript: Chart.js, D3.js, Highcharts, MUI X Charts; Python: Altair, Bokeh, lets-plot, Matplotlib, Plotly, plotnine, Pygal, Seaborn; R: ggplot2; Julia: Makie.jl. Compare all 15 side by side: Basic Error Bar Plot in Python, R, Julia and JavaScript.
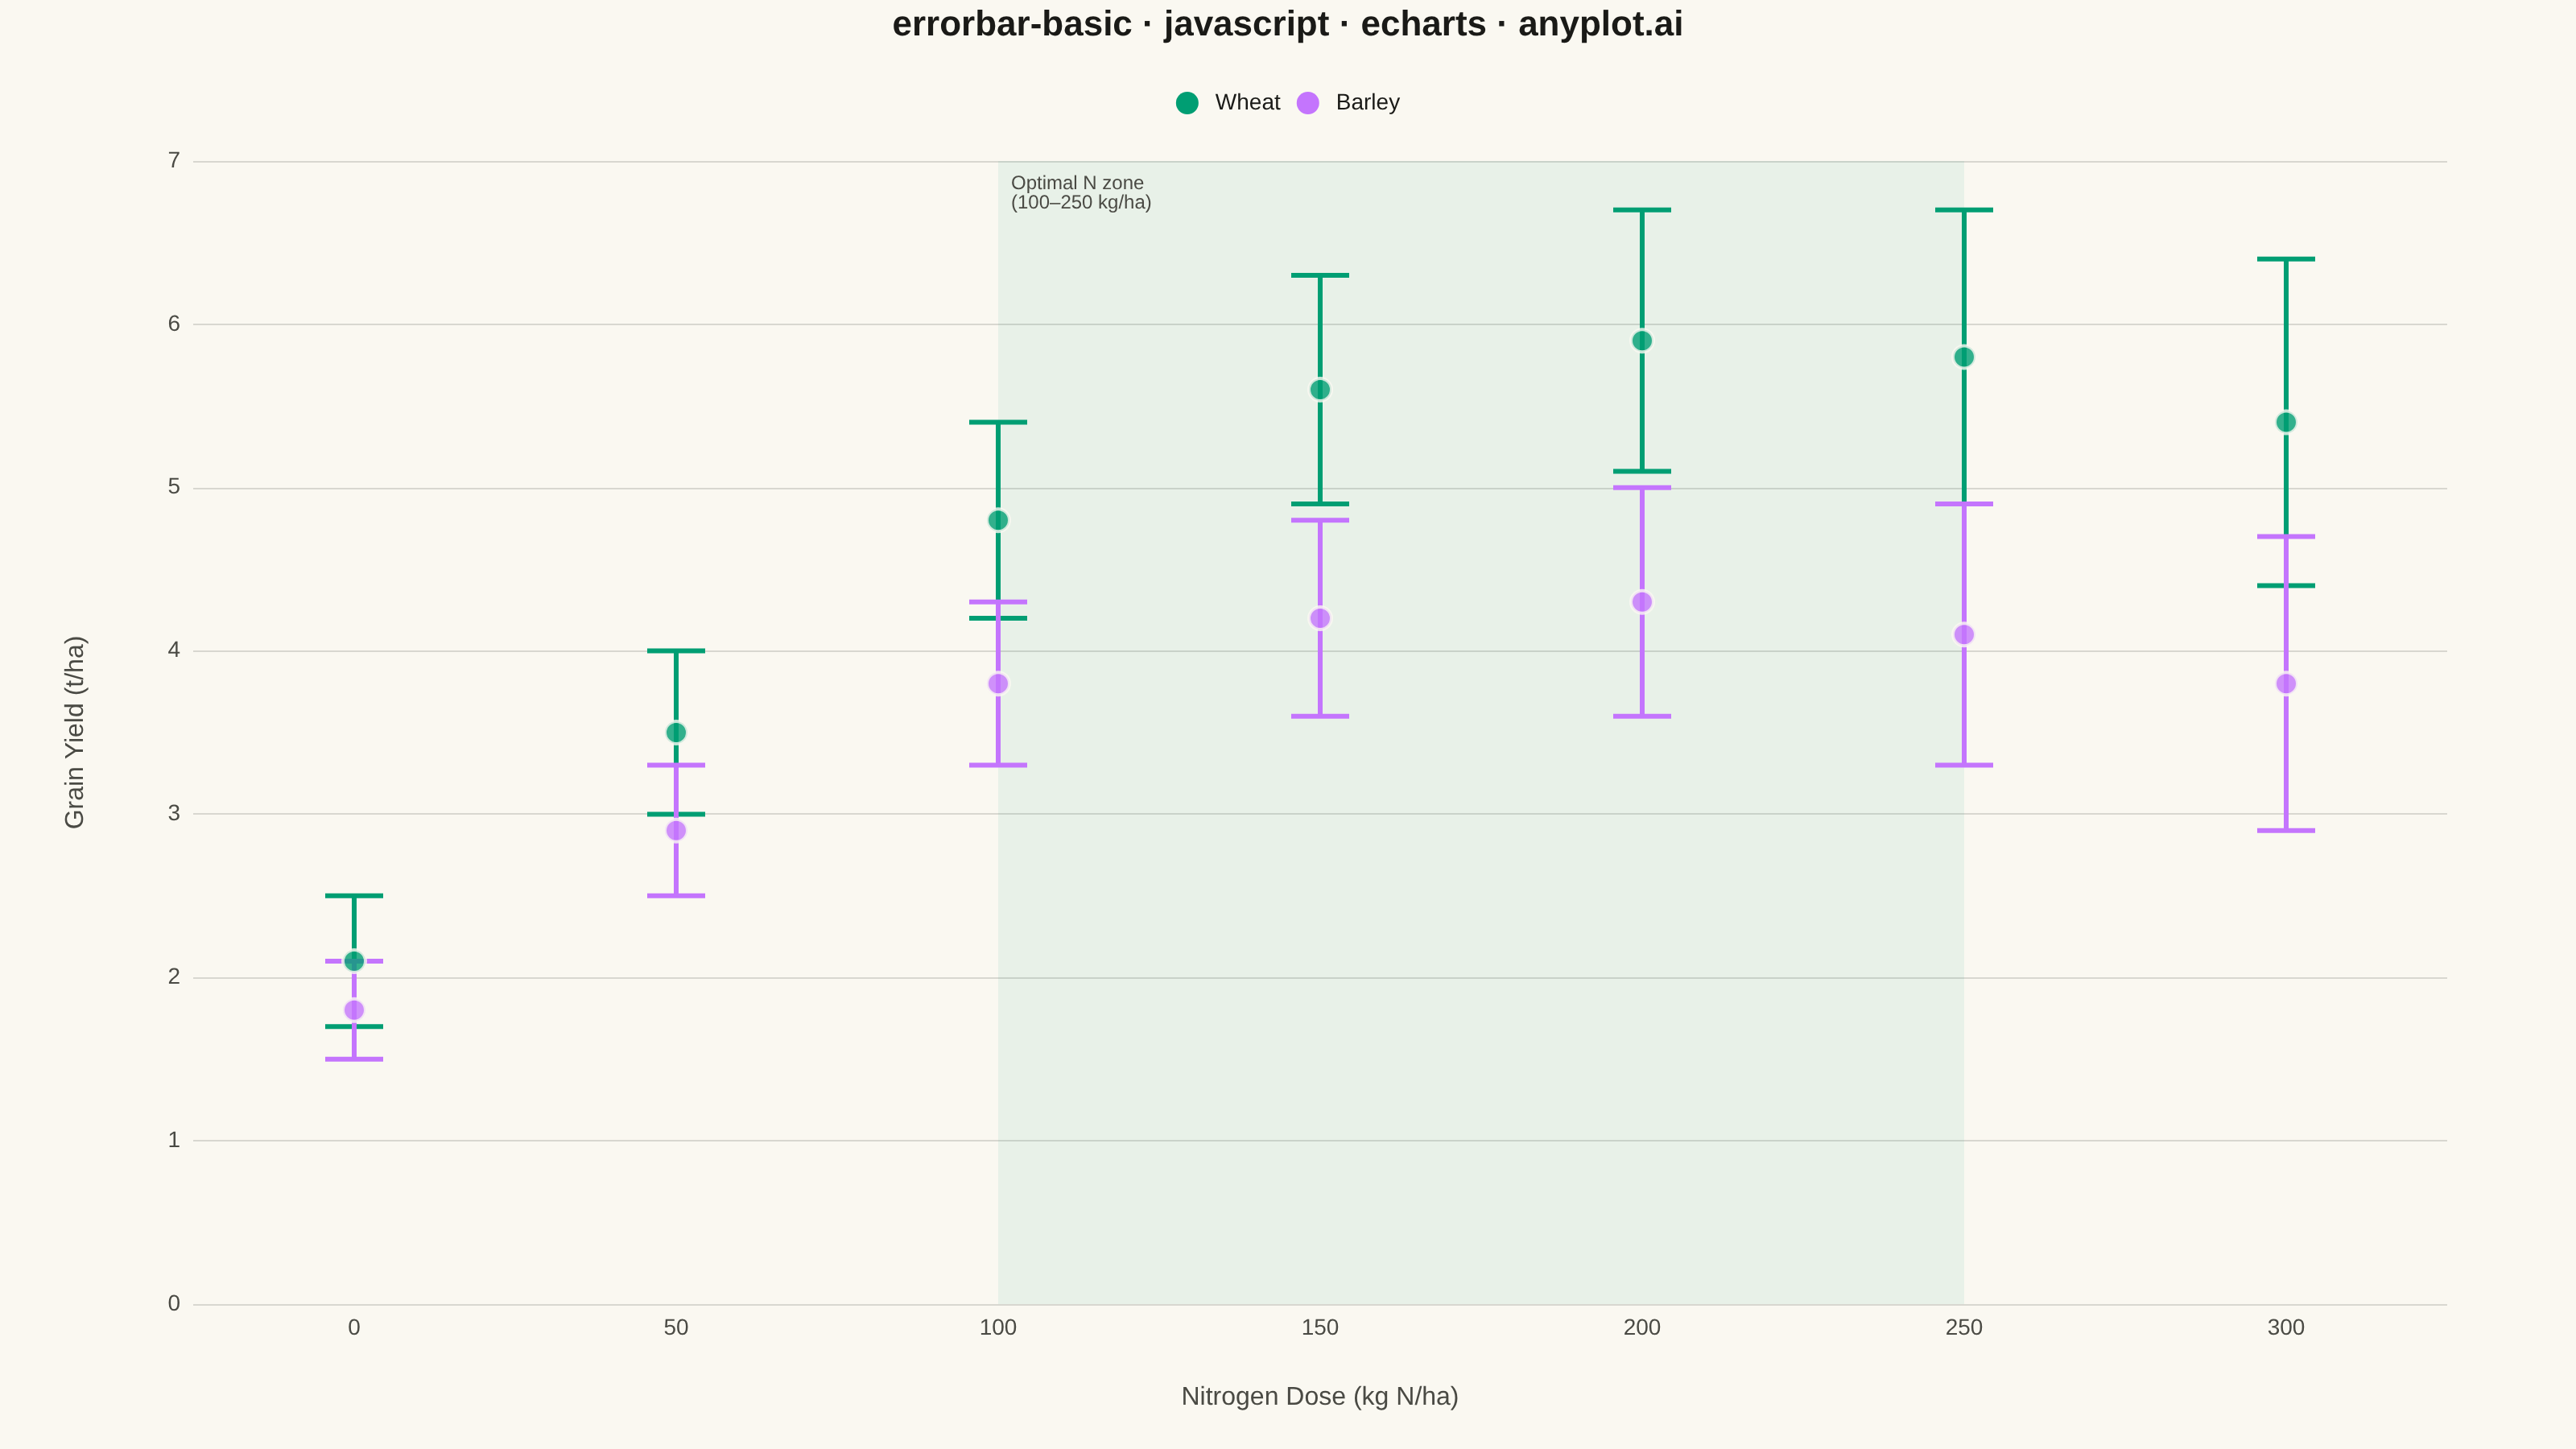
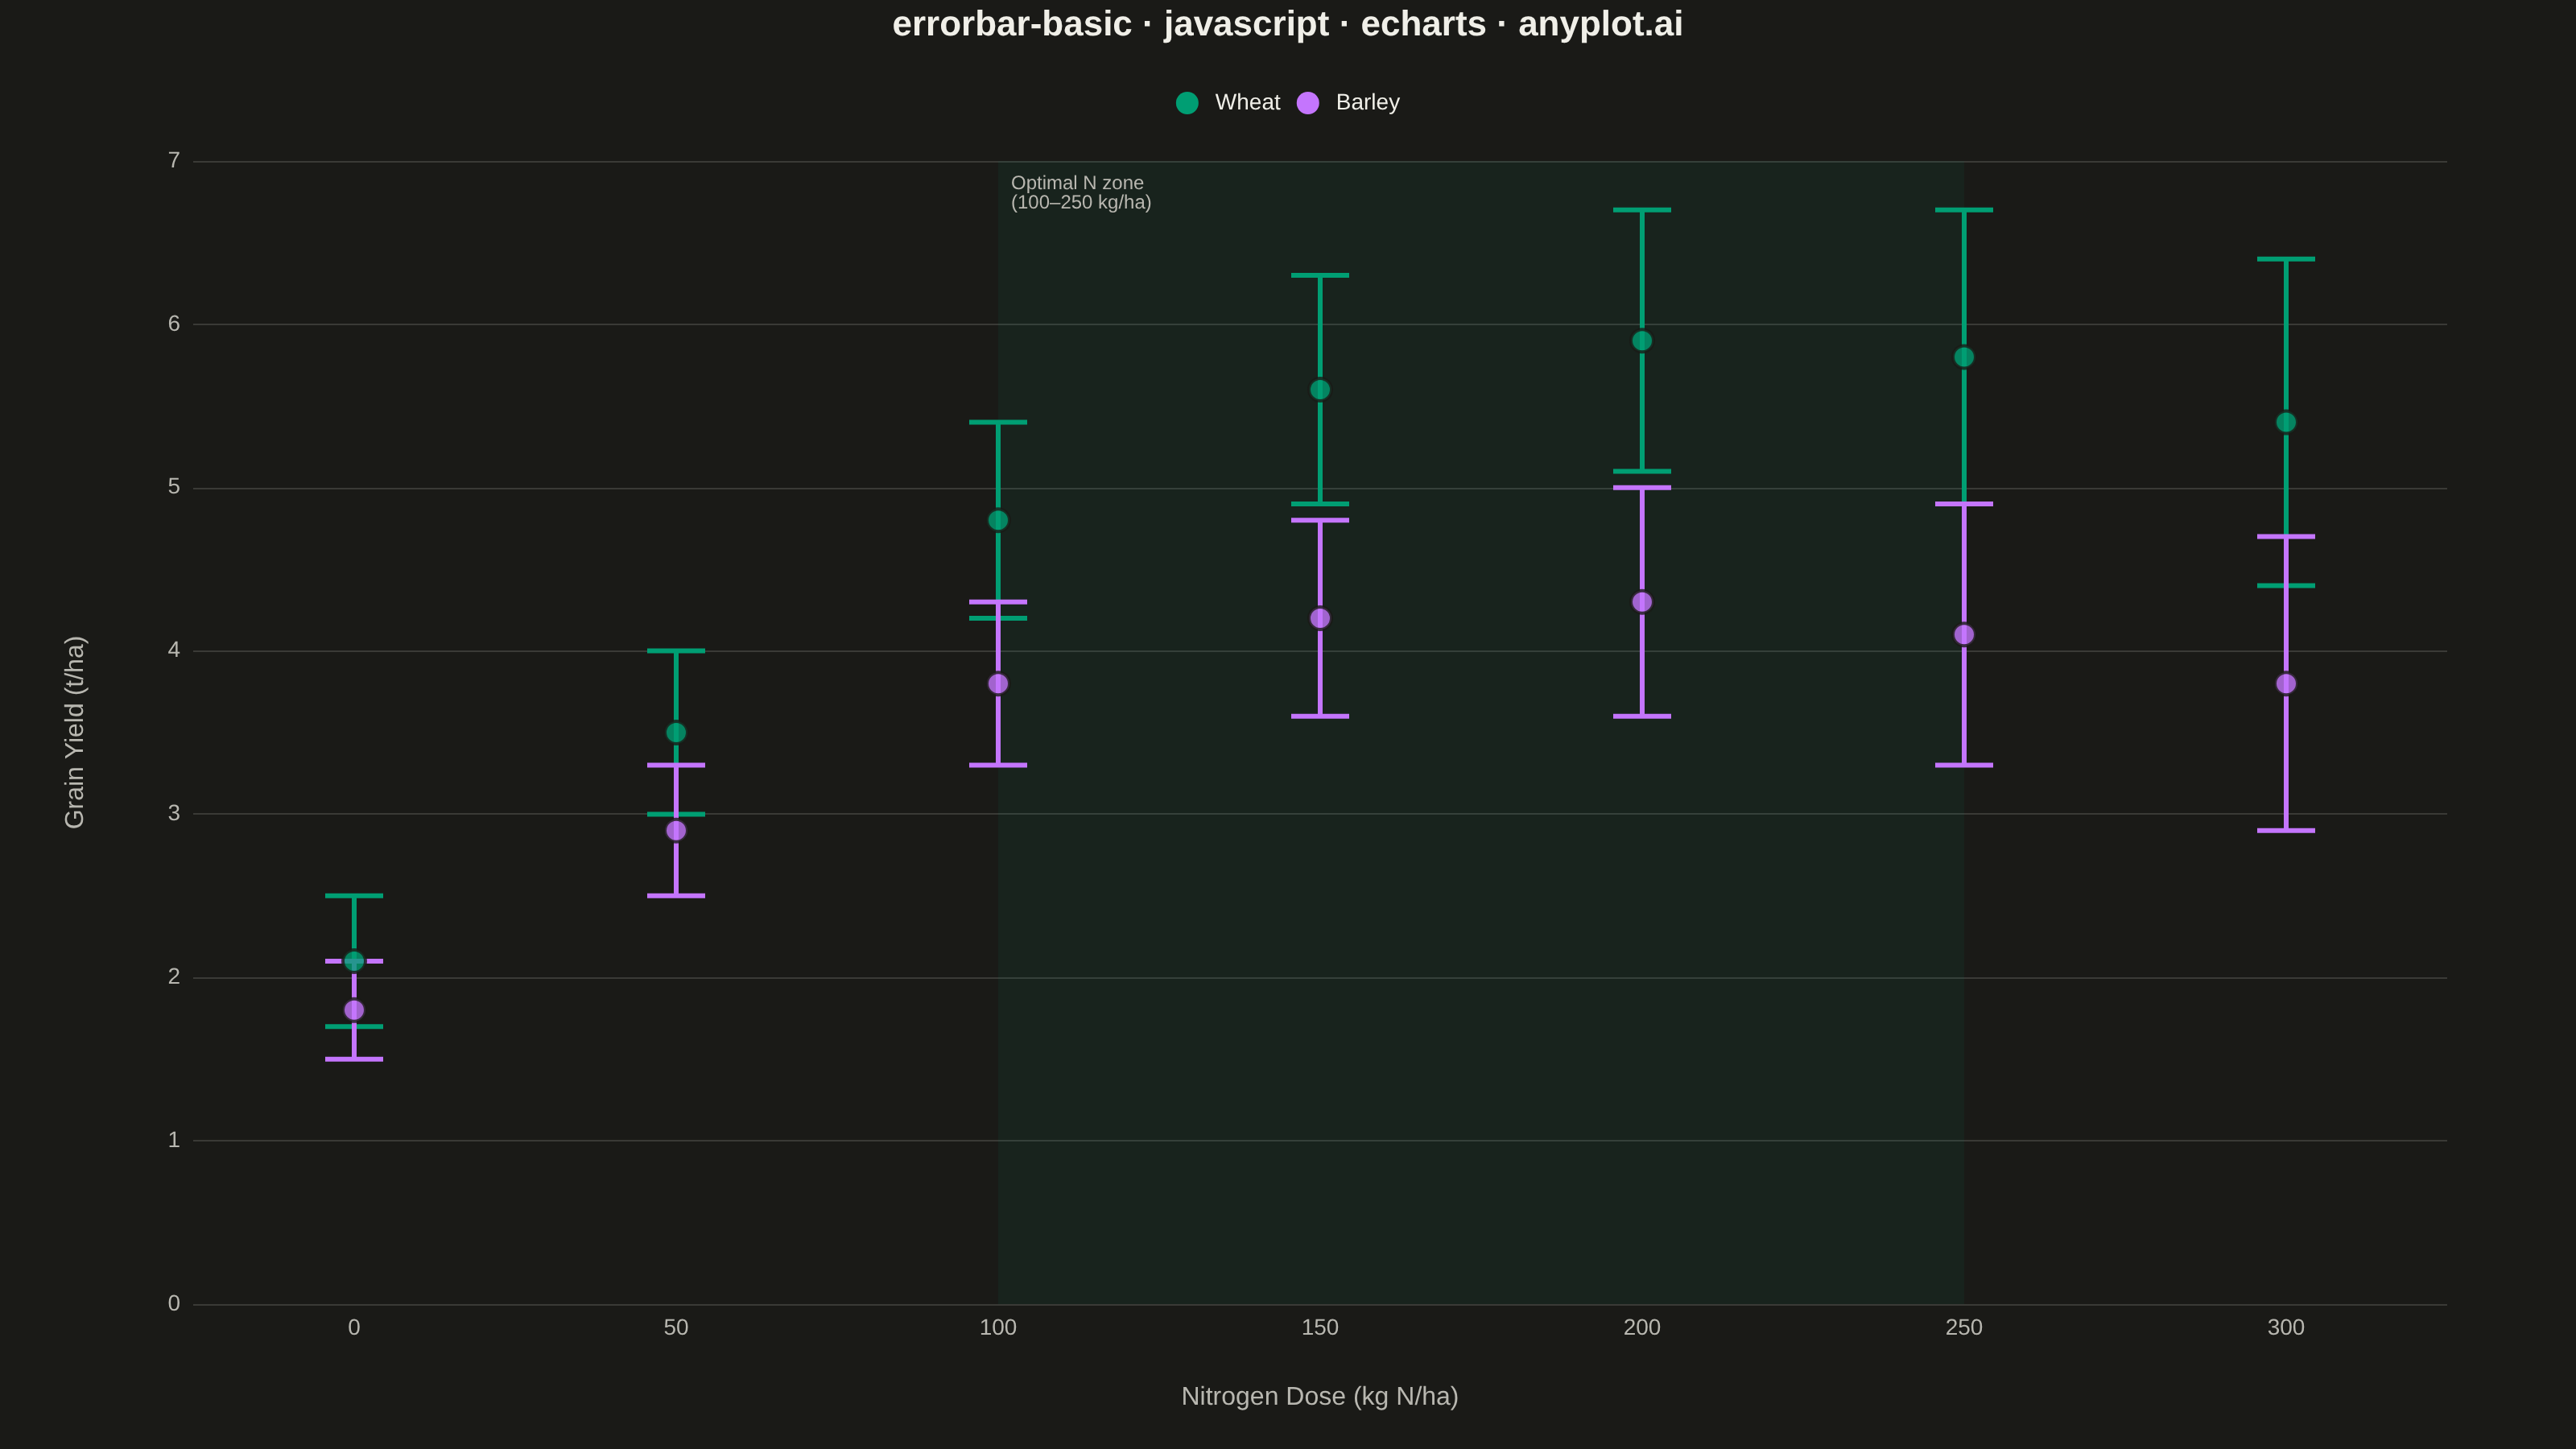
An error bar plot displays data points with associated uncertainty or variability represented by bars extending above and below (or left and right of) each point. Error bars commonly represent standard deviation, standard error, confidence intervals, or min/max ranges. This visualization is essential for communicating the reliability and precision of measurements or statistical estimates.
// anyplot.ai
// errorbar-basic: Basic Error Bar Plot
// Library: echarts 5.5.1 | JavaScript 22.23.0
// Quality: 91/100 | Created: 2026-06-30

const t = window.ANYPLOT_TOKENS;

// Wheat vs barley grain yield response to nitrogen fertilization
// (7 N dose levels, n=5 field replicates per variety)
const doses = ["0", "50", "100", "150", "200", "250", "300"];

const wheatMeans  = [2.1, 3.5, 4.8, 5.6, 5.9, 5.8, 5.4];
const wheatErrors = [0.4, 0.5, 0.6, 0.7, 0.8, 0.9, 1.0];

// Barley: lower baseline, earlier N saturation than wheat
const barleyMeans  = [1.8, 2.9, 3.8, 4.2, 4.3, 4.1, 3.8];
const barleyErrors = [0.3, 0.4, 0.5, 0.6, 0.7, 0.8, 0.9];

const WHEAT  = t.palette[0];  // #009E73 — brand green (first series)
const BARLEY = t.palette[1];  // #C475FD — lavender

function mkErrData(means, errors) {
  return means.map(function(m, i) { return [i, m + errors[i], m - errors[i]]; });
}
function mkScatData(means) {
  return means.map(function(m, i) { return [i, m]; });
}

// Factory: creates a renderItem callback for error bars in the given color
function makeRenderItem(color) {
  return function(params, api) {
    var x  = api.value(0);
    var hi = api.coord([x, api.value(1)]);
    var lo = api.coord([x, api.value(2)]);
    var cw = 18, lw = 3;
    return {
      type: "group",
      children: [
        { type: "line", shape: { x1: hi[0], y1: hi[1], x2: lo[0], y2: lo[1] }, style: { stroke: color, lineWidth: lw } },
        { type: "line", shape: { x1: hi[0]-cw, y1: hi[1], x2: hi[0]+cw, y2: hi[1] }, style: { stroke: color, lineWidth: lw } },
        { type: "line", shape: { x1: lo[0]-cw, y1: lo[1], x2: lo[0]+cw, y2: lo[1] }, style: { stroke: color, lineWidth: lw } }
      ]
    };
  };
}

const chart = echarts.init(document.getElementById("container"));

chart.setOption({
  animation: false,
  color: t.palette,
  backgroundColor: "transparent",
  title: {
    text: "errorbar-basic · javascript · echarts · anyplot.ai",
    left: "center",
    textStyle: { color: t.ink, fontSize: 22 }
  },
  legend: {
    data: [
      { name: "Wheat", icon: "circle" },
      { name: "Barley", icon: "circle" }
    ],
    top: 52,
    textStyle: { color: t.ink, fontSize: 14 }
  },
  grid: { left: 120, right: 80, top: 100, bottom: 90 },
  xAxis: {
    type: "category",
    data: doses,
    name: "Nitrogen Dose (kg N/ha)",
    nameLocation: "middle",
    nameGap: 50,
    nameTextStyle: { color: t.inkSoft, fontSize: 16 },
    axisLabel: { color: t.inkSoft, fontSize: 14 },
    axisLine: { show: false },
    axisTick: { show: false },
    splitLine: { show: false }
  },
  yAxis: {
    type: "value",
    name: "Grain Yield (t/ha)",
    nameLocation: "middle",
    nameGap: 65,
    nameTextStyle: { color: t.inkSoft, fontSize: 16 },
    min: 0,
    max: 7,
    axisLabel: { color: t.inkSoft, fontSize: 14 },
    axisLine: { show: false },
    axisTick: { show: false },
    splitLine: { lineStyle: { color: t.grid } }
  },
  series: [
    // Wheat error bars — custom renderer for stems + caps
    {
      name: "Wheat",
      type: "custom",
      itemStyle: { color: WHEAT },
      dimensions: ["xIdx", "yHigh", "yLow"],
      encode: { x: 0, y: [1, 2] },
      renderItem: makeRenderItem(WHEAT),
      data: mkErrData(wheatMeans, wheatErrors),
      z: 3
    },
    // Wheat center-value markers + optimal N zone annotation
    {
      name: "Wheat",
      type: "scatter",
      data: mkScatData(wheatMeans),
      symbolSize: 14,
      itemStyle: { color: WHEAT, borderColor: t.pageBg, borderWidth: 2 },
      z: 4,
      markArea: {
        silent: true,
        itemStyle: { color: WHEAT, opacity: 0.07 },
        label: {
          show: true,
          formatter: "Optimal N zone\n(100–250 kg/ha)",
          color: t.inkSoft,
          fontSize: 12,
          position: "insideTopLeft",
          distance: 8
        },
        data: [[{ xAxis: "100" }, { xAxis: "250" }]]
      }
    },
    // Barley error bars
    {
      name: "Barley",
      type: "custom",
      itemStyle: { color: BARLEY },
      dimensions: ["xIdx", "yHigh", "yLow"],
      encode: { x: 0, y: [1, 2] },
      renderItem: makeRenderItem(BARLEY),
      data: mkErrData(barleyMeans, barleyErrors),
      z: 3
    },
    // Barley center-value markers
    {
      name: "Barley",
      type: "scatter",
      data: mkScatData(barleyMeans),
      symbolSize: 14,
      itemStyle: { color: BARLEY, borderColor: t.pageBg, borderWidth: 2 },
      z: 4
    }
  ]
});
Runnable source as JSON, for any HTTP client: https://api.anyplot.ai/specs/errorbar-basic/echarts/code. Any spec id and library id listed in llms-full.txt fit the same URL shape; every URL below is complete and callable.
{
  "spec_id": "errorbar-basic",
  "language": "javascript",
  "library": "echarts",
  "page": "https://anyplot.ai/errorbar-basic/javascript/echarts",
  "hub": "https://anyplot.ai/errorbar-basic",
  "code_json": "https://api.anyplot.ai/specs/errorbar-basic/echarts/code",
  "spec_json": "https://api.anyplot.ai/specs/errorbar-basic",
  "render_light_png": "https://storage.googleapis.com/anyplot-images/plots/errorbar-basic/javascript/echarts/plot-light.png",
  "render_dark_png": "https://storage.googleapis.com/anyplot-images/plots/errorbar-basic/javascript/echarts/plot-dark.png",
  "interactive_light_html": "https://storage.googleapis.com/anyplot-images/plots/errorbar-basic/javascript/echarts/plot-light.html",
  "interactive_dark_html": "https://storage.googleapis.com/anyplot-images/plots/errorbar-basic/javascript/echarts/plot-dark.html",
  "quality_score": 91.0,
  "license": "MIT",
  "guide": "https://anyplot.ai/llms.txt"
}
Part of Basic Error Bar Plot on anyplot.ai.