The same plot in 14 other libraries — Python: Altair, Bokeh, lets-plot, Matplotlib, Plotly, plotnine, Pygal, Seaborn; Julia: Makie.jl; JavaScript: Chart.js, D3.js, Apache ECharts, Highcharts, MUI X Charts. Compare all 15 side by side: Basic Error Bar Plot in Python, R, Julia and JavaScript.
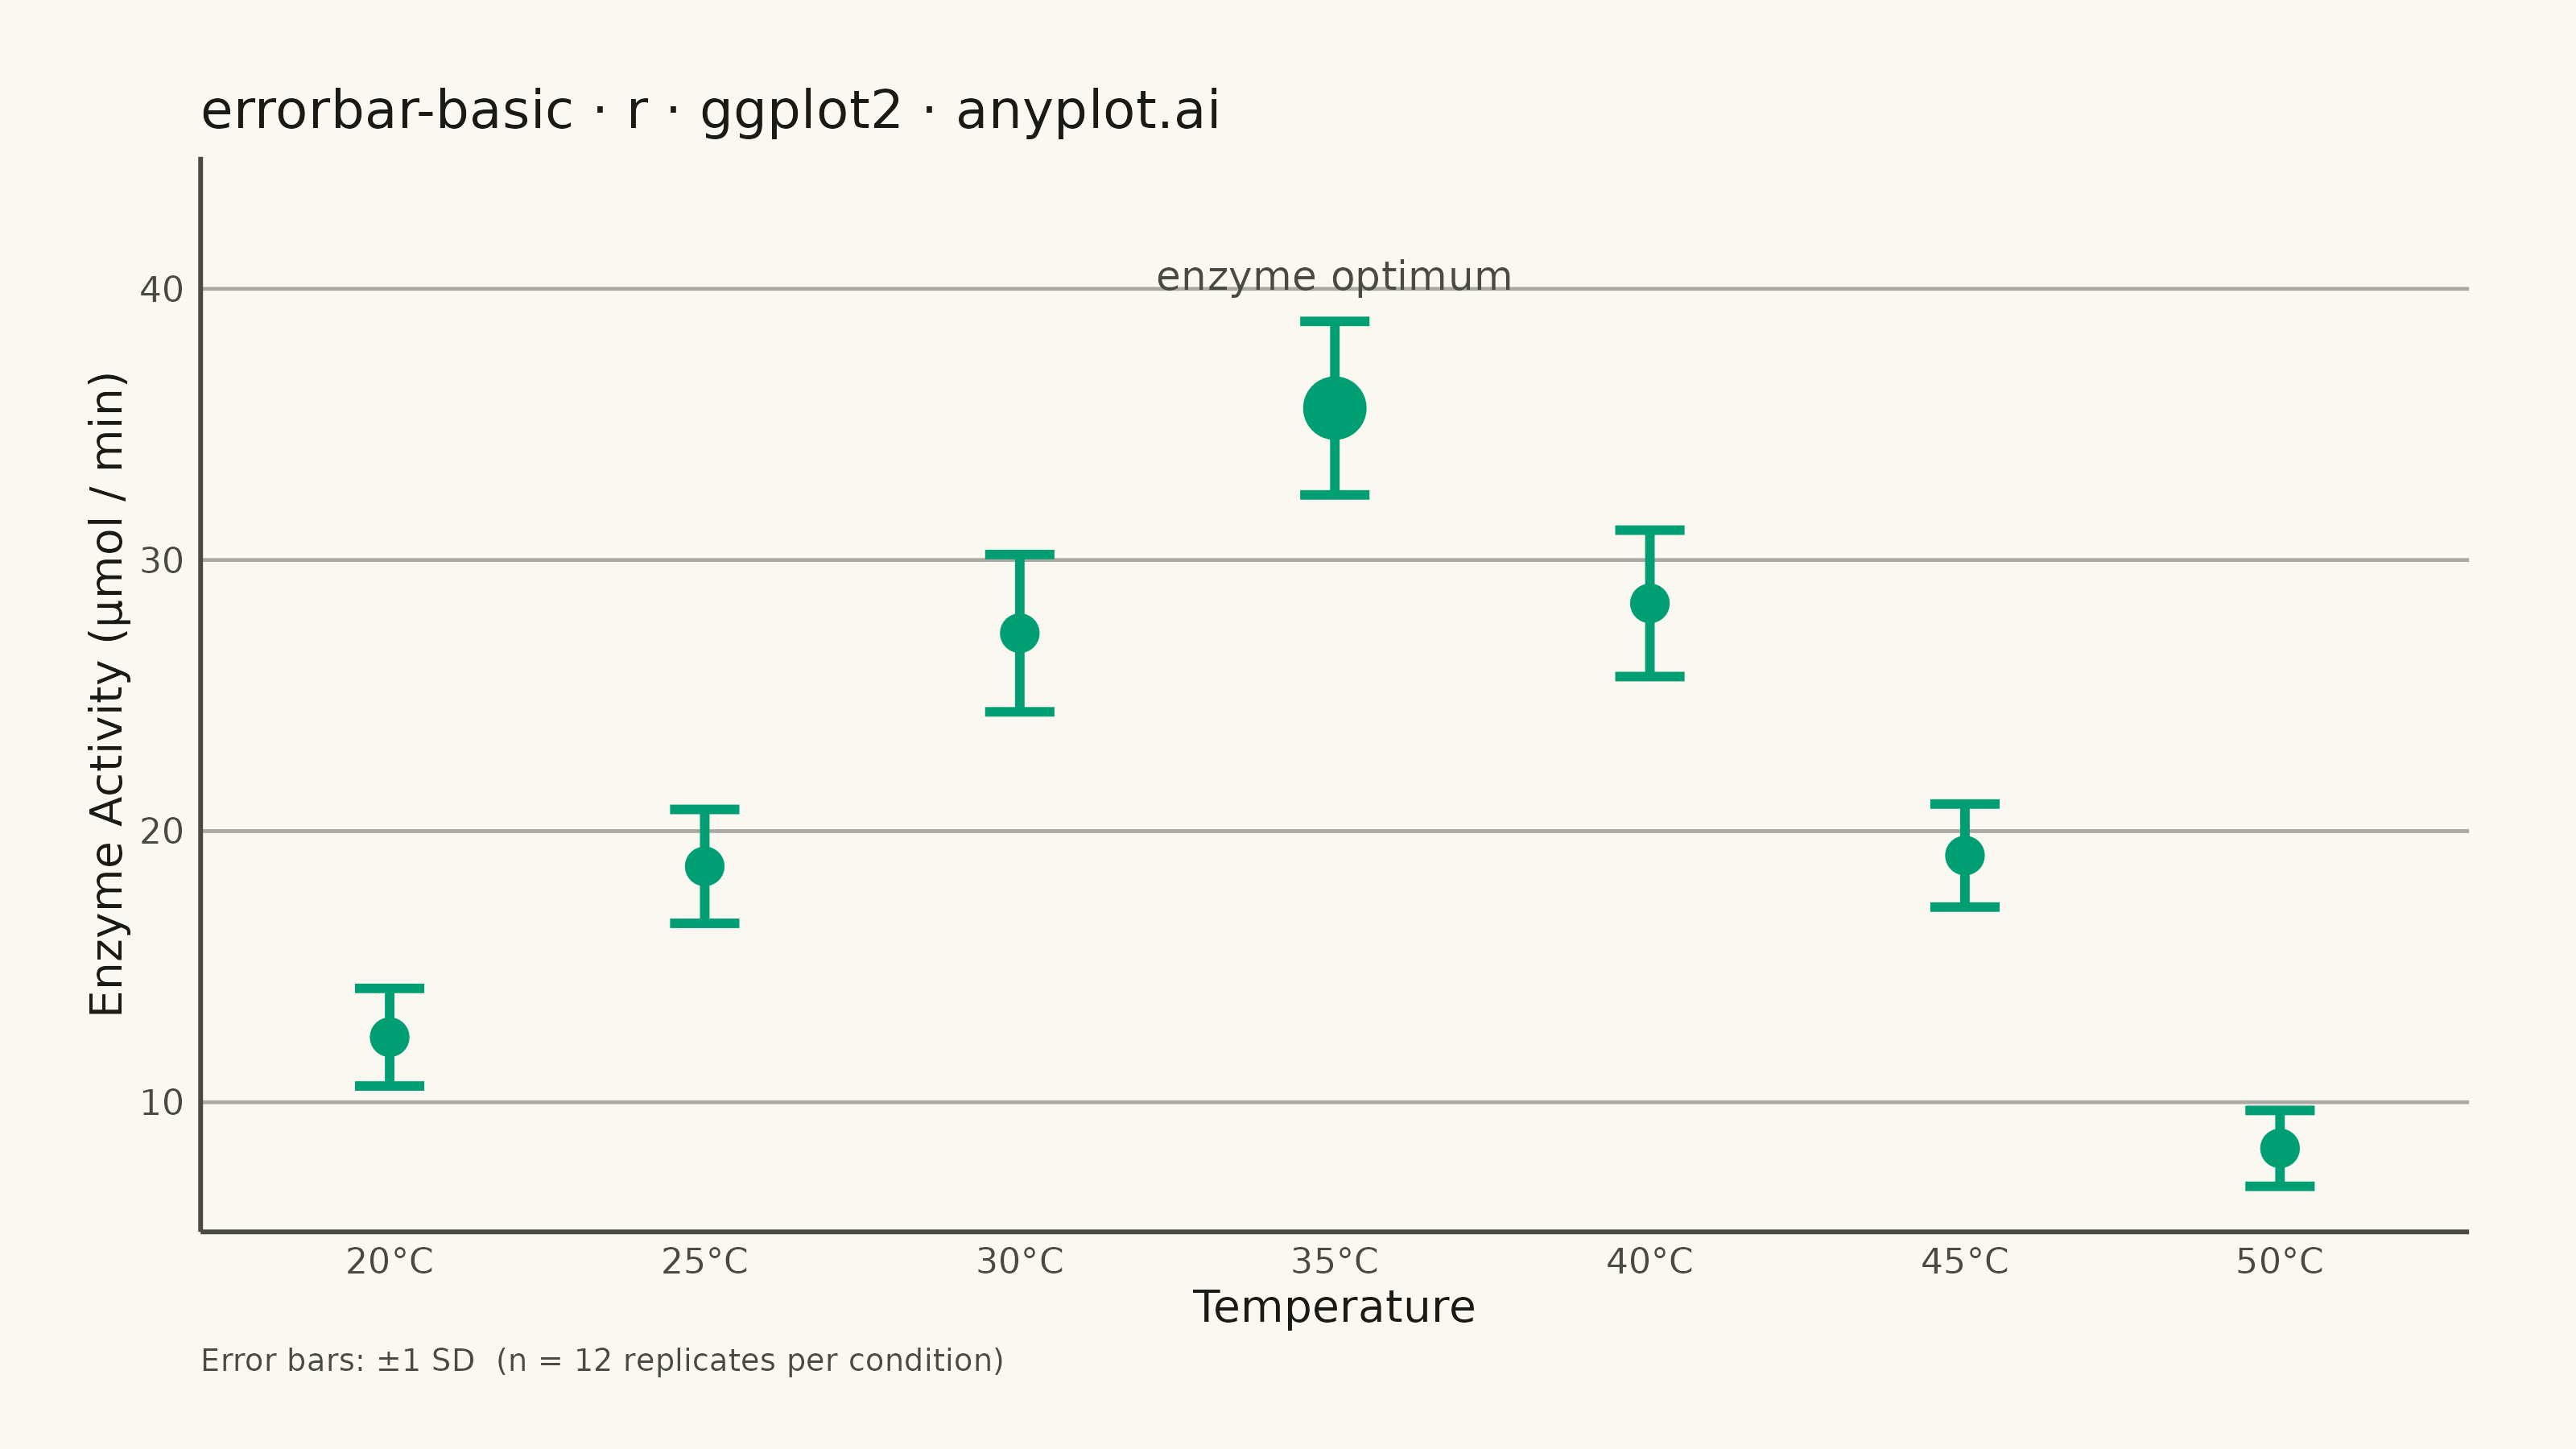
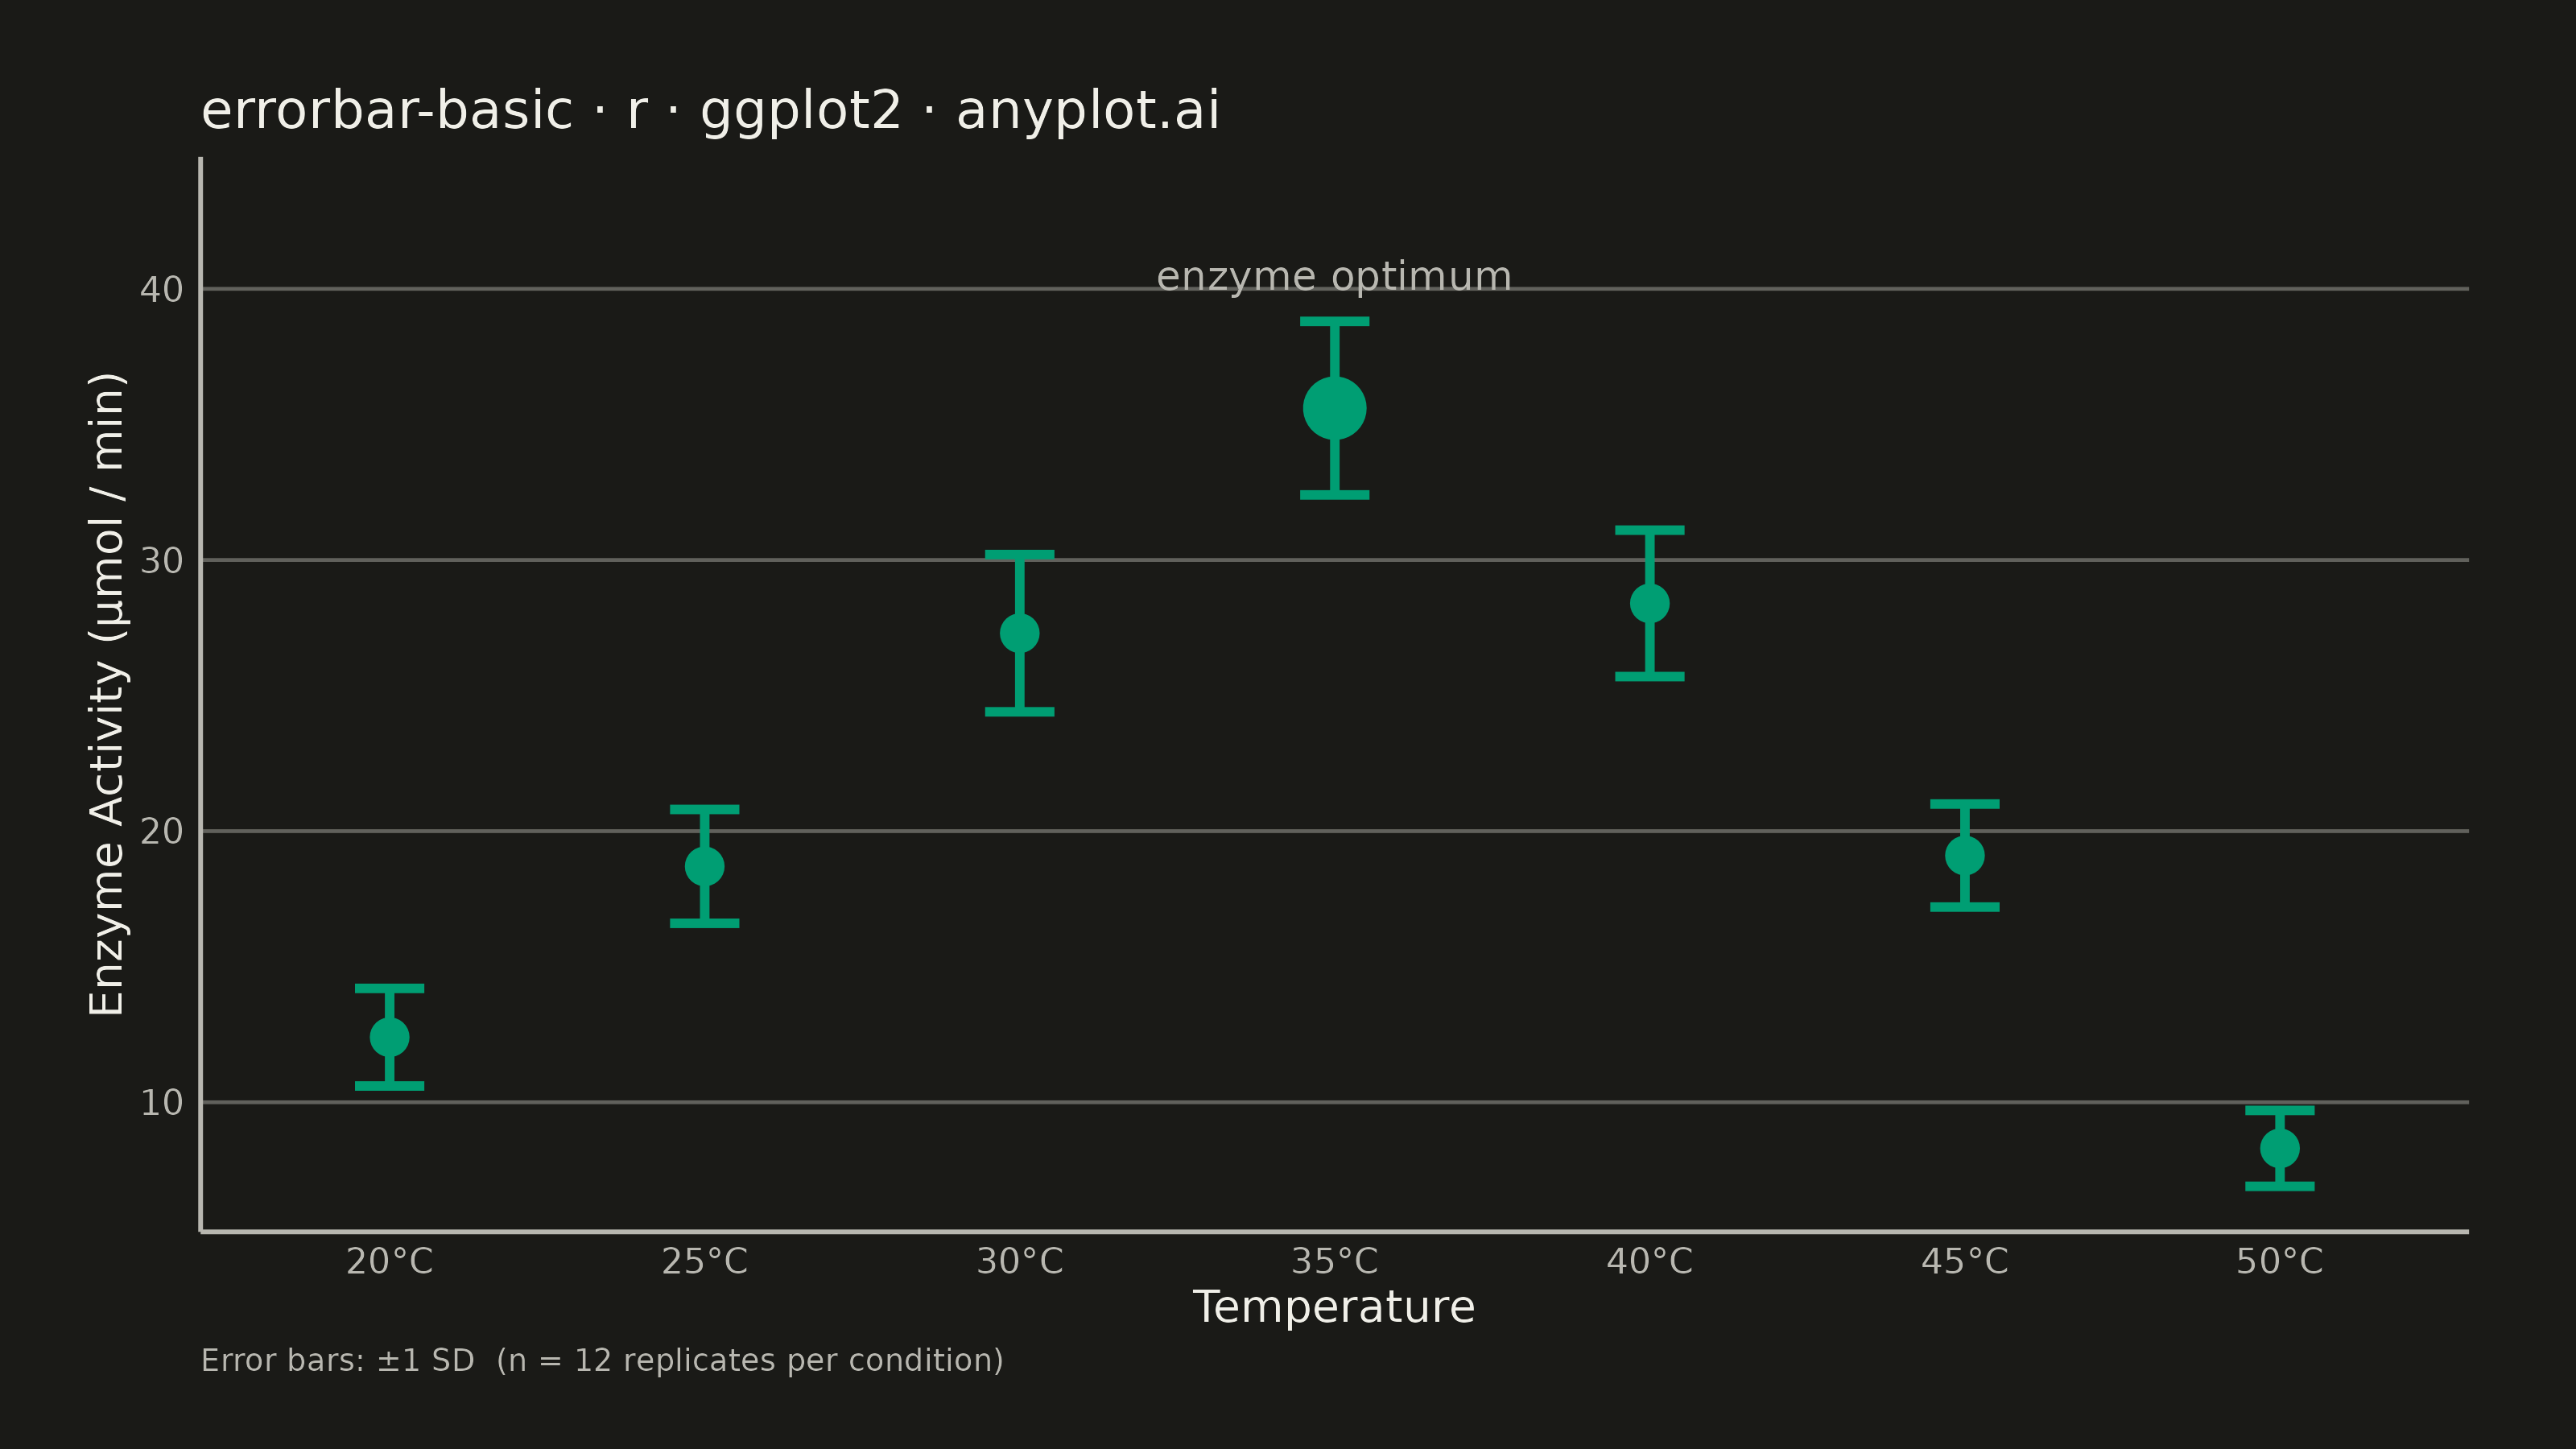
An error bar plot displays data points with associated uncertainty or variability represented by bars extending above and below (or left and right of) each point. Error bars commonly represent standard deviation, standard error, confidence intervals, or min/max ranges. This visualization is essential for communicating the reliability and precision of measurements or statistical estimates.
#' anyplot.ai
#' errorbar-basic: Basic Error Bar Plot
#' Library: ggplot2 3.5.1 | R 4.4.1
#' Quality: 90/100 | Created: 2026-06-30

library(ggplot2)
library(ragg)

# Theme tokens — Imprint palette, theme-adaptive chrome
THEME    <- Sys.getenv("ANYPLOT_THEME", "light")
PAGE_BG  <- if (THEME == "light") "#FAF8F1" else "#1A1A17"
INK      <- if (THEME == "light") "#1A1A17" else "#F0EFE8"
INK_SOFT <- if (THEME == "light") "#4A4A44" else "#B8B7B0"

IMPRINT_PALETTE <- c(
    "#009E73",  # 1 — brand green (first series)
    "#C475FD",  # 2 — lavender
    "#4467A3",  # 3 — blue
    "#BD8233",  # 4 — ochre
    "#AE3030",  # 5 — matte red
    "#2ABCCD",  # 6 — cyan
    "#954477",  # 7 — rose
    "#99B314"   # 8 — lime
)

# Data: enzyme activity across temperature conditions (mean ± 1 SD, n = 12 replicates)
conditions    <- c("20°C", "25°C", "30°C", "35°C", "40°C", "45°C", "50°C")
mean_activity <- c(12.4, 18.7, 27.3, 35.6, 28.4, 19.1, 8.3)
sd_activity   <- c(1.8,  2.1,  2.9,  3.2,  2.7,  1.9,  1.4)

df <- data.frame(
    temperature = factor(conditions, levels = conditions),
    mean_act    = mean_activity,
    lower       = mean_activity - sd_activity,
    upper       = mean_activity + sd_activity
)

# Plot
p <- ggplot(df, aes(x = temperature, y = mean_act)) +
    geom_errorbar(
        aes(ymin = lower, ymax = upper),
        width     = 0.22,
        linewidth = 1.0,
        color     = IMPRINT_PALETTE[1]
    ) +
    geom_point(
        size  = 3.5,
        color = IMPRINT_PALETTE[1]
    ) +
    # Enlarged marker highlights the enzyme optimum at 35°C
    geom_point(
        data  = df[df$temperature == "35°C", ],
        size  = 6.0,
        color = IMPRINT_PALETTE[1]
    ) +
    # Focal-point annotation at enzyme optimum
    annotate(
        "text",
        x     = 4,
        y     = 40.5,
        label = "enzyme optimum",
        color = INK_SOFT,
        size  = 3.2,
        hjust = 0.5
    ) +
    scale_y_continuous(expand = expansion(mult = c(0.05, 0.13))) +
    labs(
        x       = "Temperature",
        y       = "Enzyme Activity (μmol / min)",
        title   = "errorbar-basic · r · ggplot2 · anyplot.ai",
        caption = "Error bars: ±1 SD  (n = 12 replicates per condition)"
    ) +
    theme_minimal(base_size = 8) +
    theme(
        plot.background    = element_rect(fill = PAGE_BG, color = PAGE_BG),
        panel.background   = element_rect(fill = PAGE_BG, color = NA),
        panel.border       = element_blank(),
        panel.grid.major.y = element_line(
            color     = grDevices::adjustcolor(INK_SOFT, alpha.f = 0.45),
            linewidth = 0.4
        ),
        panel.grid.major.x = element_blank(),
        panel.grid.minor   = element_blank(),
        axis.line          = element_line(color = INK_SOFT, linewidth = 0.5),
        axis.title         = element_text(color = INK,      size = 10),
        axis.text          = element_text(color = INK_SOFT, size = 8),
        plot.title         = element_text(color = INK,      size = 12),
        plot.caption       = element_text(color = INK_SOFT, size = 7,  hjust = 0),
        plot.margin        = margin(20, 24, 16, 20)
    )

# Save
ggsave(
    filename = sprintf("plot-%s.png", THEME),
    plot     = p,
    device   = ragg::agg_png,
    width    = 8,
    height   = 4.5,
    units    = "in",
    dpi      = 400
)
Runnable source as JSON, for any HTTP client: https://api.anyplot.ai/specs/errorbar-basic/ggplot2/code. Any spec id and library id listed in llms-full.txt fit the same URL shape; every URL below is complete and callable.
{
  "spec_id": "errorbar-basic",
  "language": "r",
  "library": "ggplot2",
  "page": "https://anyplot.ai/errorbar-basic/r/ggplot2",
  "hub": "https://anyplot.ai/errorbar-basic",
  "code_json": "https://api.anyplot.ai/specs/errorbar-basic/ggplot2/code",
  "spec_json": "https://api.anyplot.ai/specs/errorbar-basic",
  "render_light_png": "https://storage.googleapis.com/anyplot-images/plots/errorbar-basic/r/ggplot2/plot-light.png",
  "render_dark_png": "https://storage.googleapis.com/anyplot-images/plots/errorbar-basic/r/ggplot2/plot-dark.png",
  "quality_score": 90.0,
  "license": "MIT",
  "guide": "https://anyplot.ai/llms.txt"
}
Part of Basic Error Bar Plot on anyplot.ai.