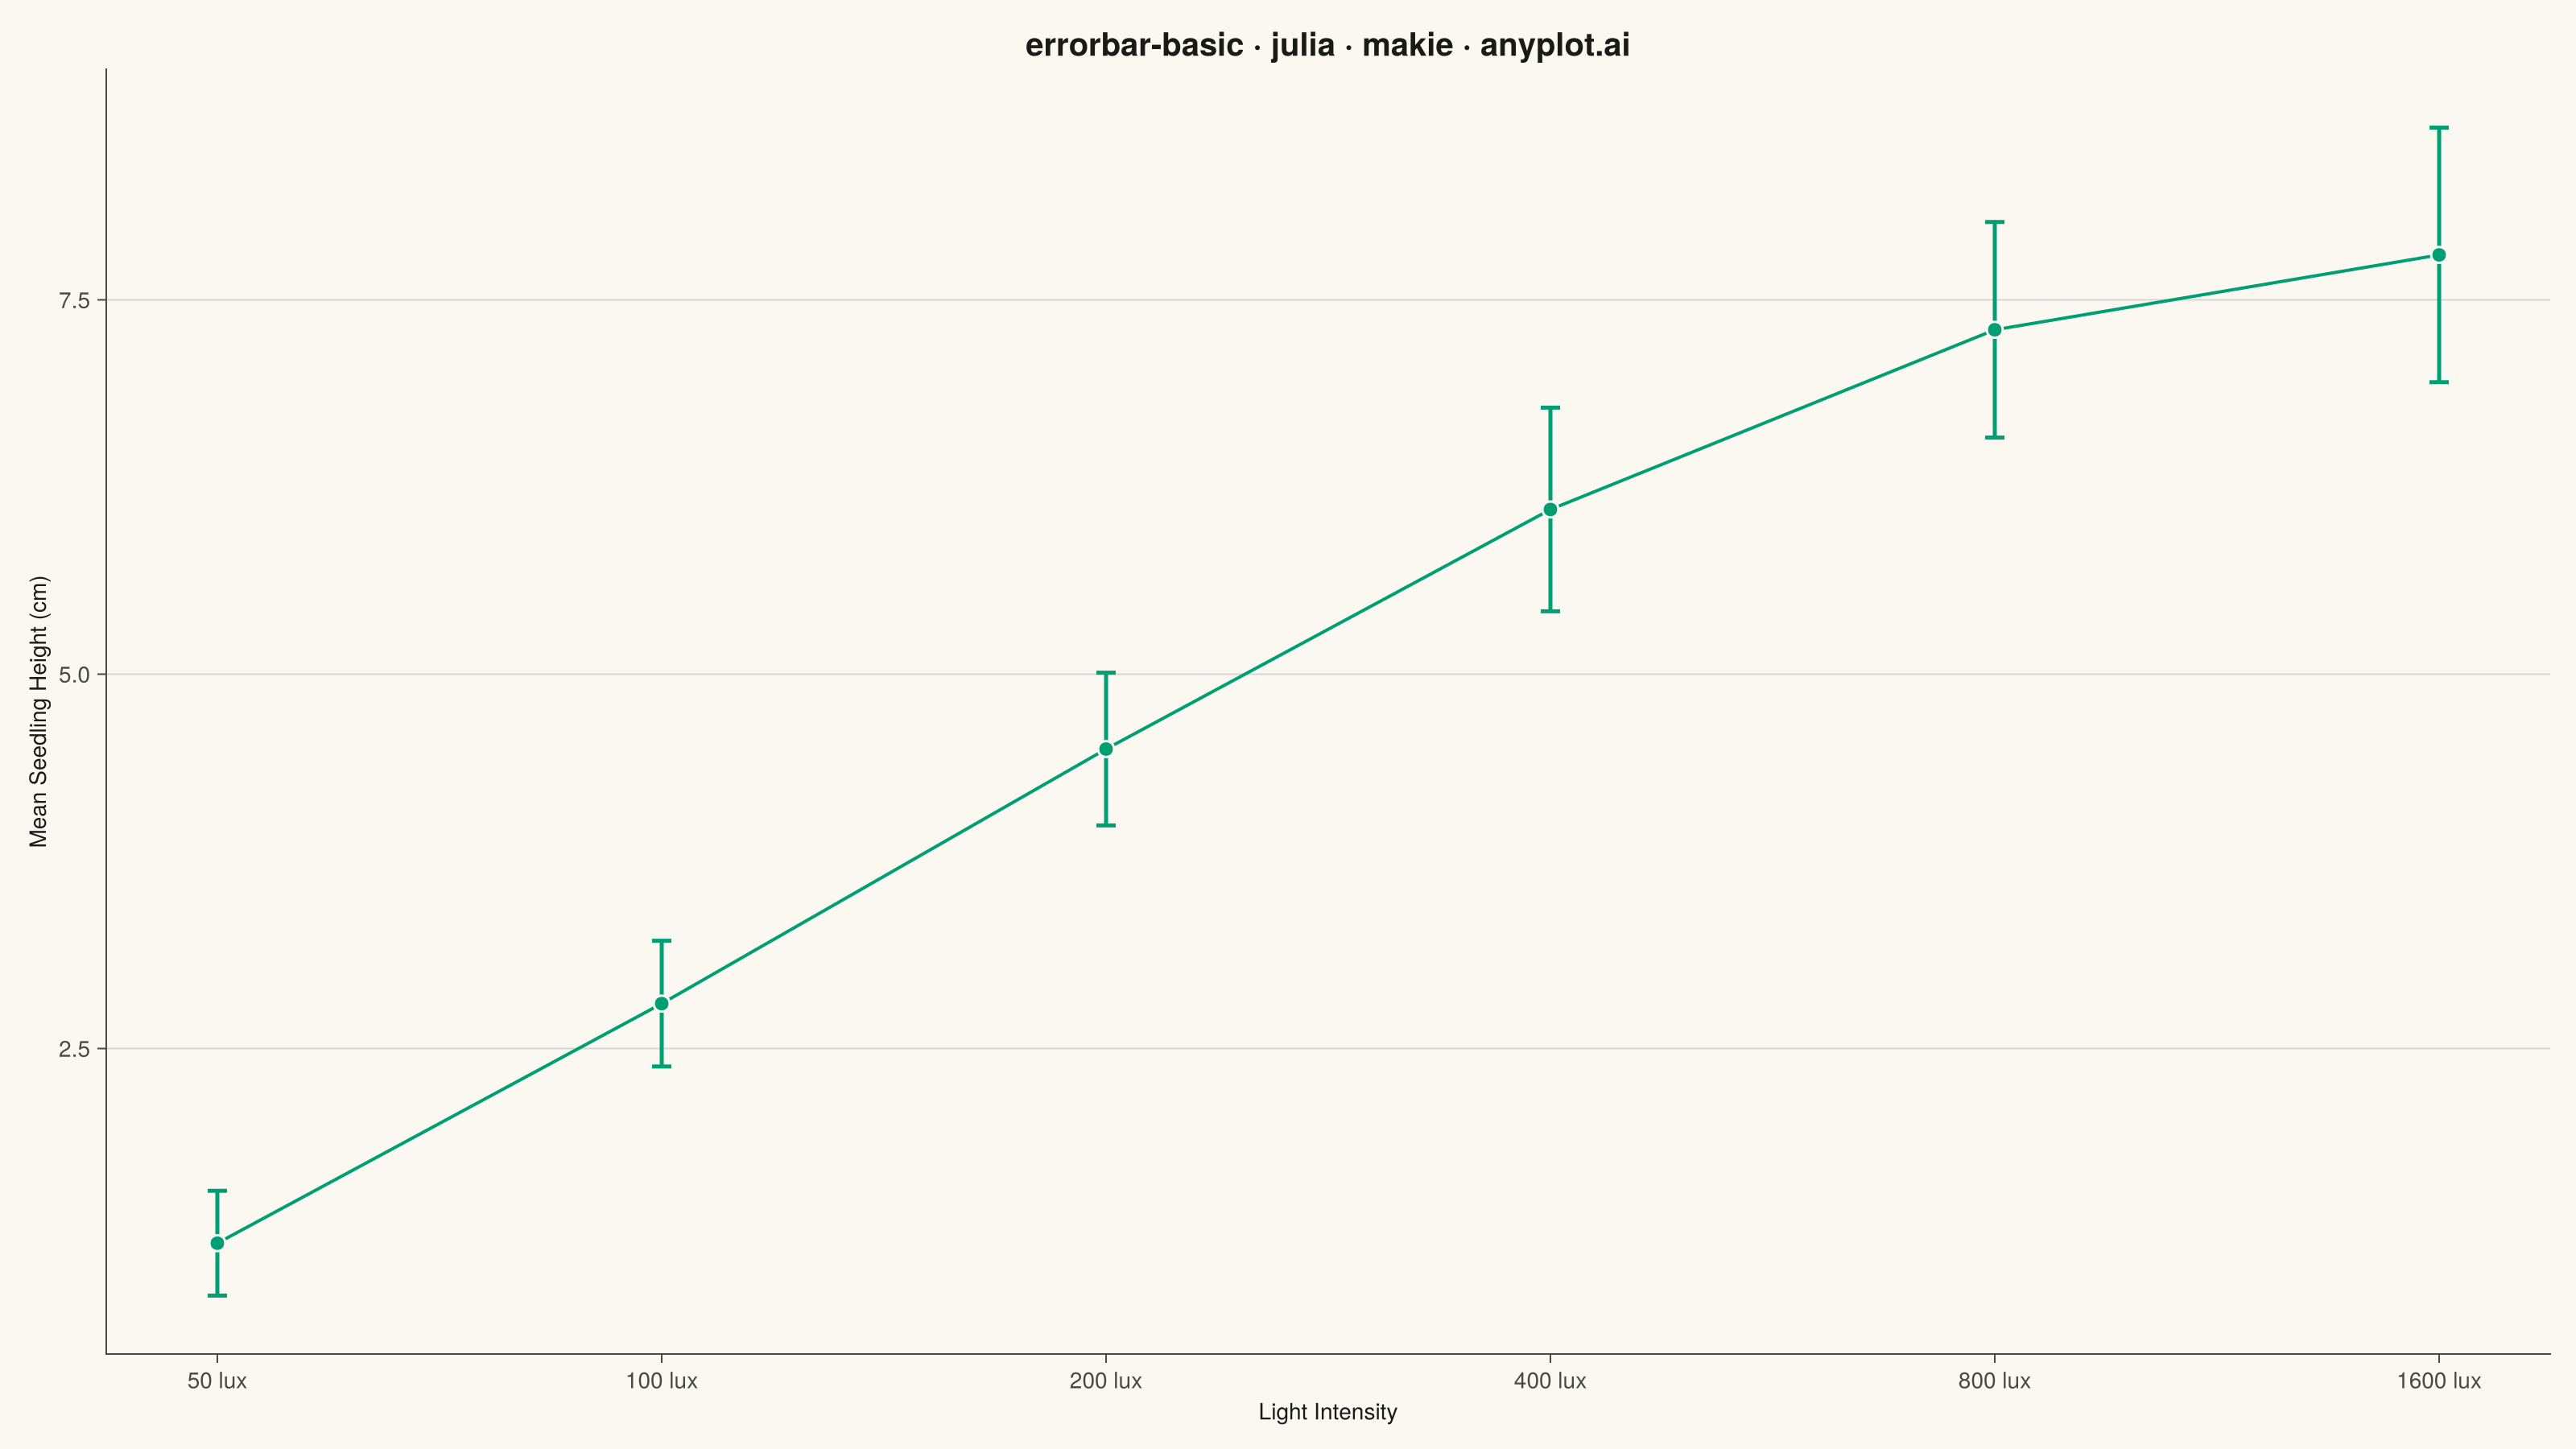
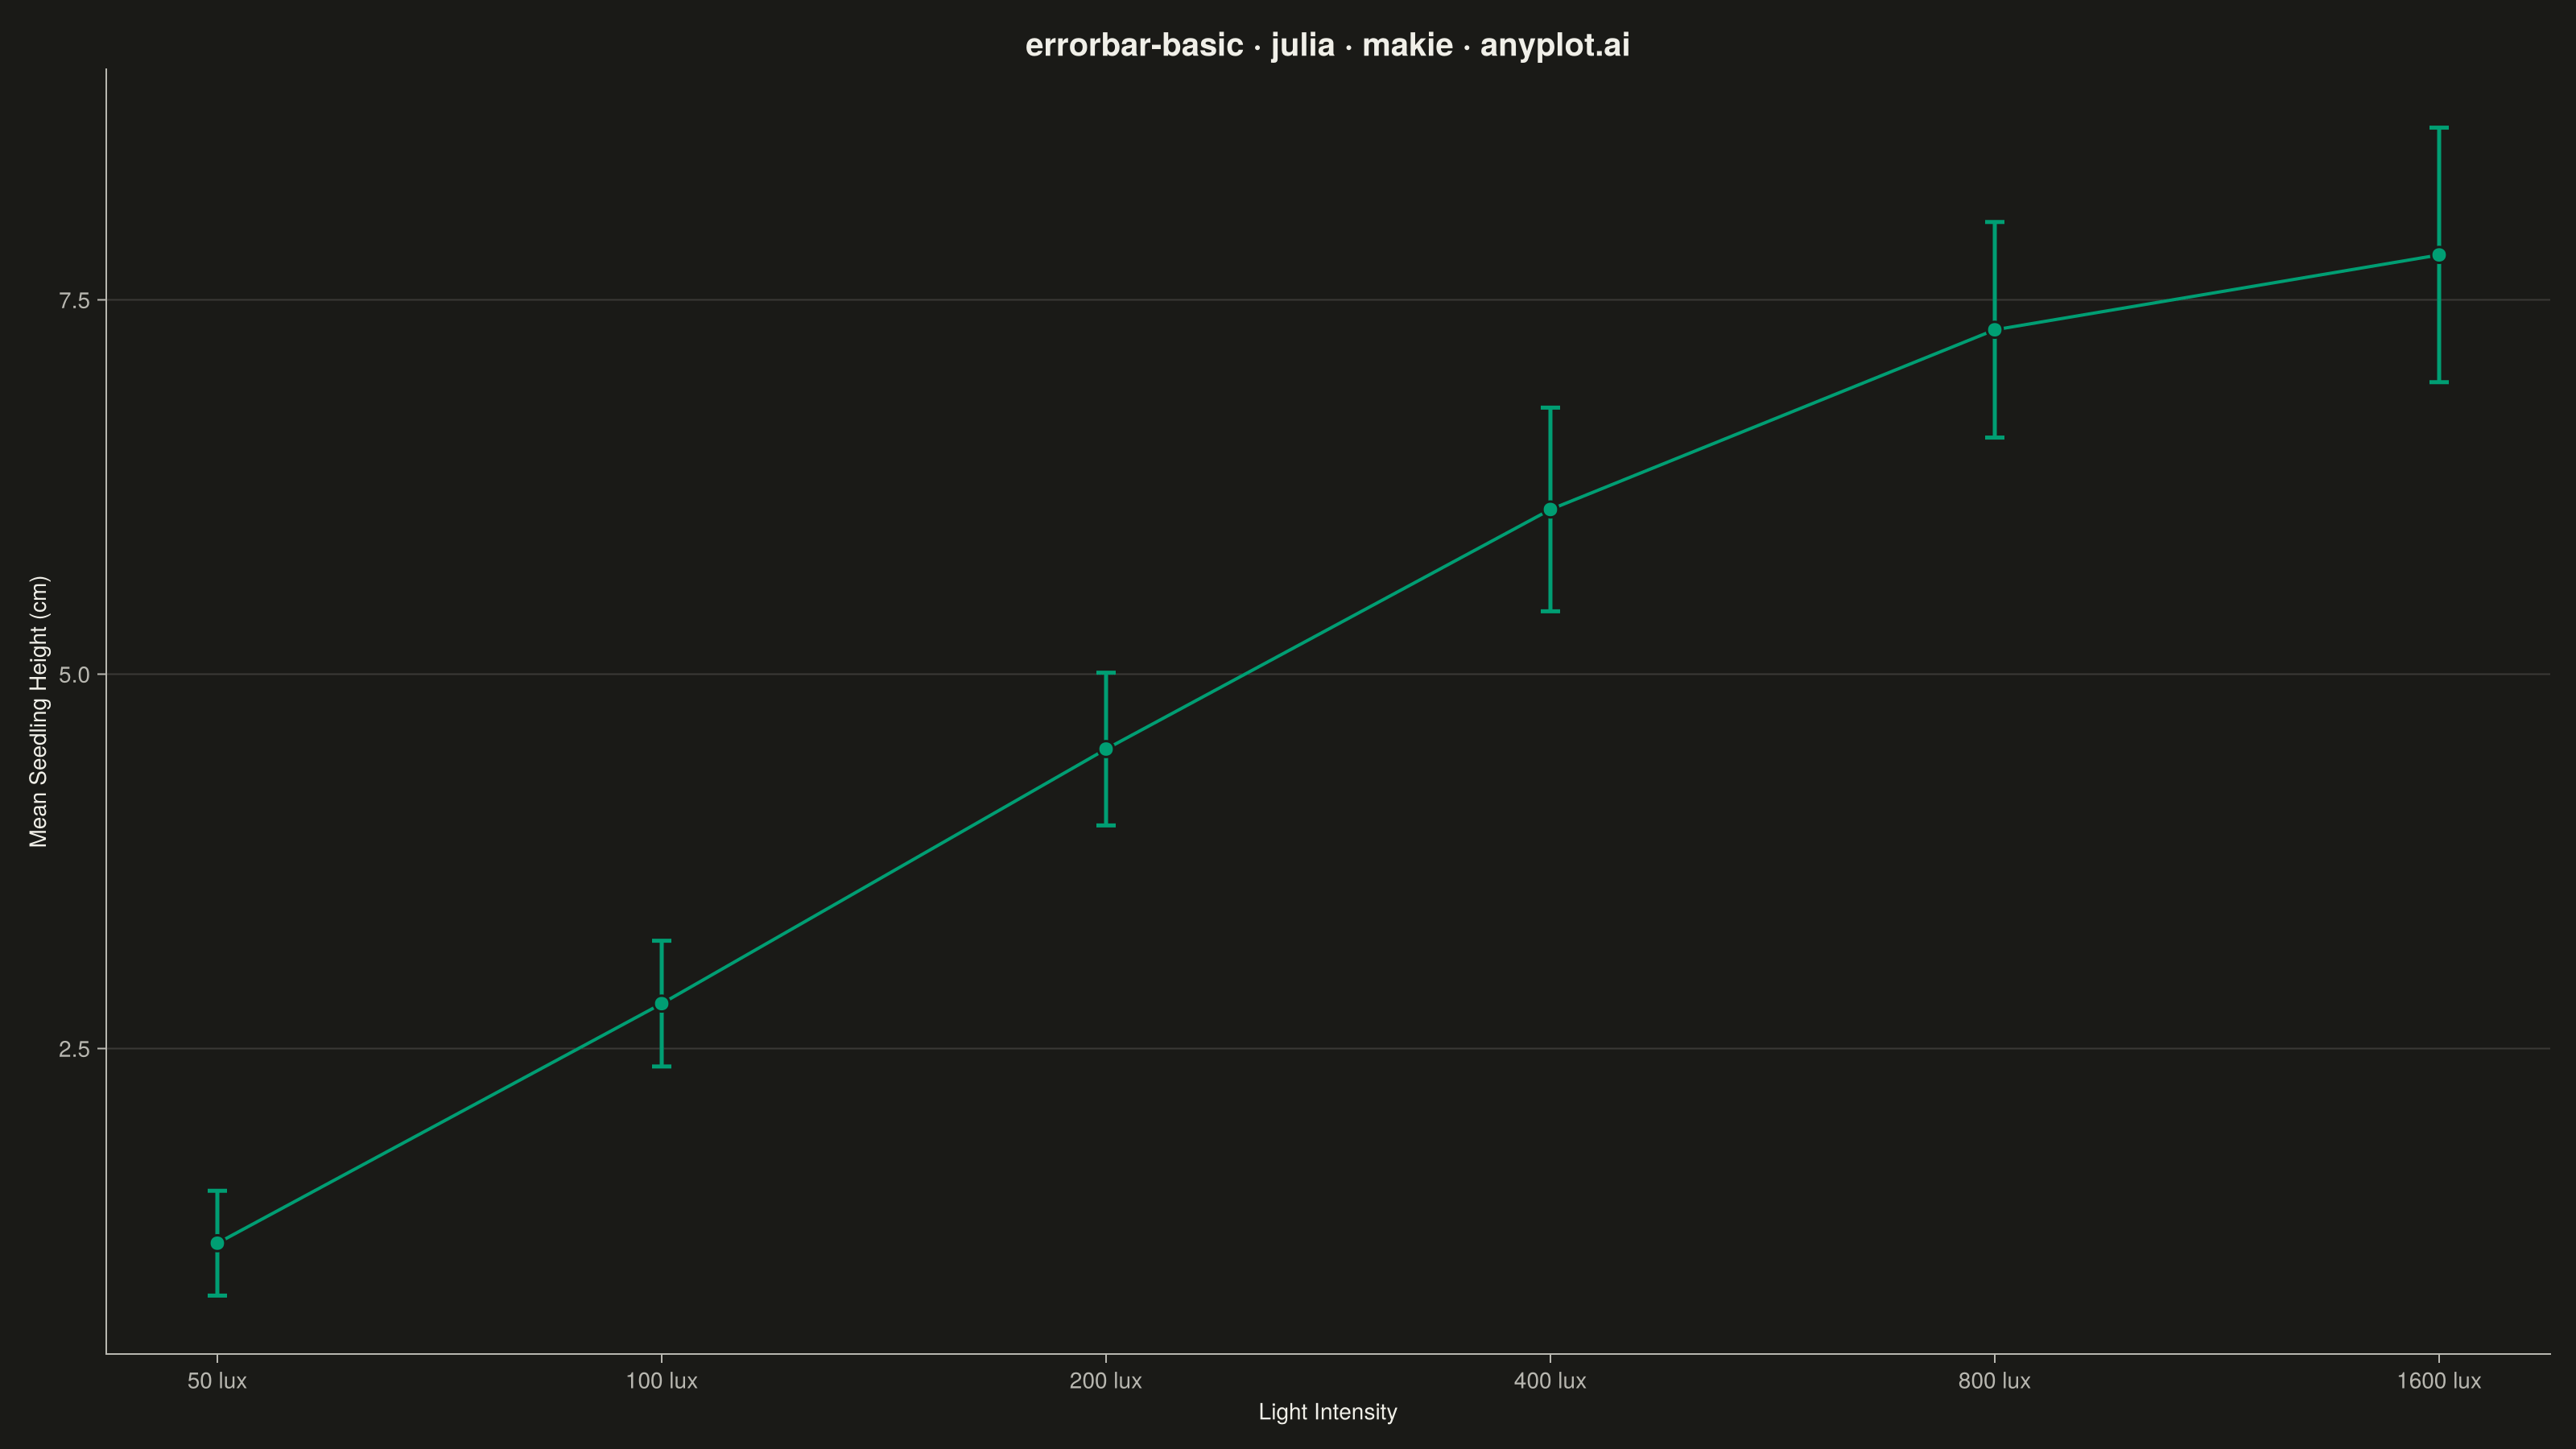
The same plot in 14 other libraries — Python: Altair, Bokeh, lets-plot, Matplotlib, Plotly, plotnine, Pygal, Seaborn; R: ggplot2; JavaScript: Chart.js, D3.js, Apache ECharts, Highcharts, MUI X Charts. Compare all 15 side by side: Basic Error Bar Plot in Python, R, Julia and JavaScript.
An error bar plot displays data points with associated uncertainty or variability represented by bars extending above and below (or left and right of) each point. Error bars commonly represent standard deviation, standard error, confidence intervals, or min/max ranges. This visualization is essential for communicating the reliability and precision of measurements or statistical estimates.
# anyplot.ai
# errorbar-basic: Basic Error Bar Plot
# Library: makie 0.21.9 | Julia 1.11.9
# Quality: 88/100 | Created: 2026-06-30

using CairoMakie
using Colors
using Random

Random.seed!(42)

# Theme tokens
const THEME     = get(ENV, "ANYPLOT_THEME", "light")
const PAGE_BG   = THEME == "light" ? colorant"#FAF8F1" : colorant"#1A1A17"
const INK       = THEME == "light" ? colorant"#1A1A17" : colorant"#F0EFE8"
const INK_SOFT  = THEME == "light" ? colorant"#4A4A44" : colorant"#B8B7B0"
const INK_MUTED = THEME == "light" ? colorant"#6B6A63" : colorant"#A8A79F"
const IMPRINT_PALETTE = [
    colorant"#009E73",  # 1 — first categorical series (Imprint brand green)
    colorant"#C475FD",  # 2 — lavender
    colorant"#4467A3",  # 3 — blue
    colorant"#BD8233",  # 4 — ochre
    colorant"#AE3030",  # 5 — matte red
    colorant"#2ABCCD",  # 6 — cyan
    colorant"#954477",  # 7 — rose
    colorant"#99B314",  # 8 — lime
]

# Data: Mean seedling height (cm) under 6 light intensity levels
# Standard deviation from 20 replicate seedlings per condition
light_levels = ["50 lux", "100 lux", "200 lux", "400 lux", "800 lux", "1600 lux"]
mean_height  = [1.2, 2.8, 4.5, 6.1, 7.3, 7.8]
std_height   = [0.35, 0.42, 0.51, 0.68, 0.72, 0.85]
n = length(light_levels)
x_pos = collect(1:n)

# Plot
fig = Figure(
    size            = (1600, 900),
    fontsize        = 14,
    backgroundcolor = PAGE_BG,
)

ax = Axis(
    fig[1, 1];
    title              = "errorbar-basic · julia · makie · anyplot.ai",
    titlesize          = 20,
    titlecolor         = INK,
    xlabel             = "Light Intensity",
    ylabel             = "Mean Seedling Height (cm)",
    xlabelsize         = 14,
    ylabelsize         = 14,
    xlabelcolor        = INK,
    ylabelcolor        = INK,
    xticklabelcolor    = INK_SOFT,
    yticklabelcolor    = INK_SOFT,
    xticklabelsize     = 12,
    yticklabelsize     = 12,
    xtickcolor         = INK_SOFT,
    ytickcolor         = INK_SOFT,
    backgroundcolor    = PAGE_BG,
    topspinevisible    = false,
    rightspinevisible  = false,
    leftspinecolor     = INK_SOFT,
    bottomspinecolor   = INK_SOFT,
    xgridvisible       = false,
    ygridvisible       = false,
    yminorgridvisible  = false,
    xticks             = (x_pos, light_levels),
)

# Highlight the growth saturation region (800–1600 lux = x positions 5–6)
c = IMPRINT_PALETTE[1]
vspan!(ax, [4.5], [6.5];
    color = RGBAf(Float32(c.r), Float32(c.g), Float32(c.b), 0.08f0),
)

errorbars!(ax, x_pos, mean_height, std_height;
    color        = IMPRINT_PALETTE[1],
    linewidth    = 2.5,
    whiskerwidth = 12,
)

lines!(ax, x_pos, mean_height;
    color     = IMPRINT_PALETTE[1],
    linewidth = 2.0,
)

scatter!(ax, x_pos, mean_height;
    color       = IMPRINT_PALETTE[1],
    markersize  = 14,
    strokewidth = 1.5,
    strokecolor = PAGE_BG,
)

# Annotate the saturation plateau to guide the reader to the key insight
text!(ax, 5.5, 8.4;
    text     = "growth plateau",
    color    = INK_MUTED,
    fontsize = 12,
    align    = (:center, :bottom),
)

# Save
save("plot-$(THEME).png", fig; px_per_unit = 2)
Runnable source as JSON, for any HTTP client: https://api.anyplot.ai/specs/errorbar-basic/makie/code. Any spec id and library id listed in llms-full.txt fit the same URL shape; every URL below is complete and callable.
{
  "spec_id": "errorbar-basic",
  "language": "julia",
  "library": "makie",
  "page": "https://anyplot.ai/errorbar-basic/julia/makie",
  "hub": "https://anyplot.ai/errorbar-basic",
  "code_json": "https://api.anyplot.ai/specs/errorbar-basic/makie/code",
  "spec_json": "https://api.anyplot.ai/specs/errorbar-basic",
  "render_light_png": "https://storage.googleapis.com/anyplot-images/plots/errorbar-basic/julia/makie/plot-light.png",
  "render_dark_png": "https://storage.googleapis.com/anyplot-images/plots/errorbar-basic/julia/makie/plot-dark.png",
  "quality_score": 88.0,
  "license": "MIT",
  "guide": "https://anyplot.ai/llms.txt"
}
Part of Basic Error Bar Plot on anyplot.ai.