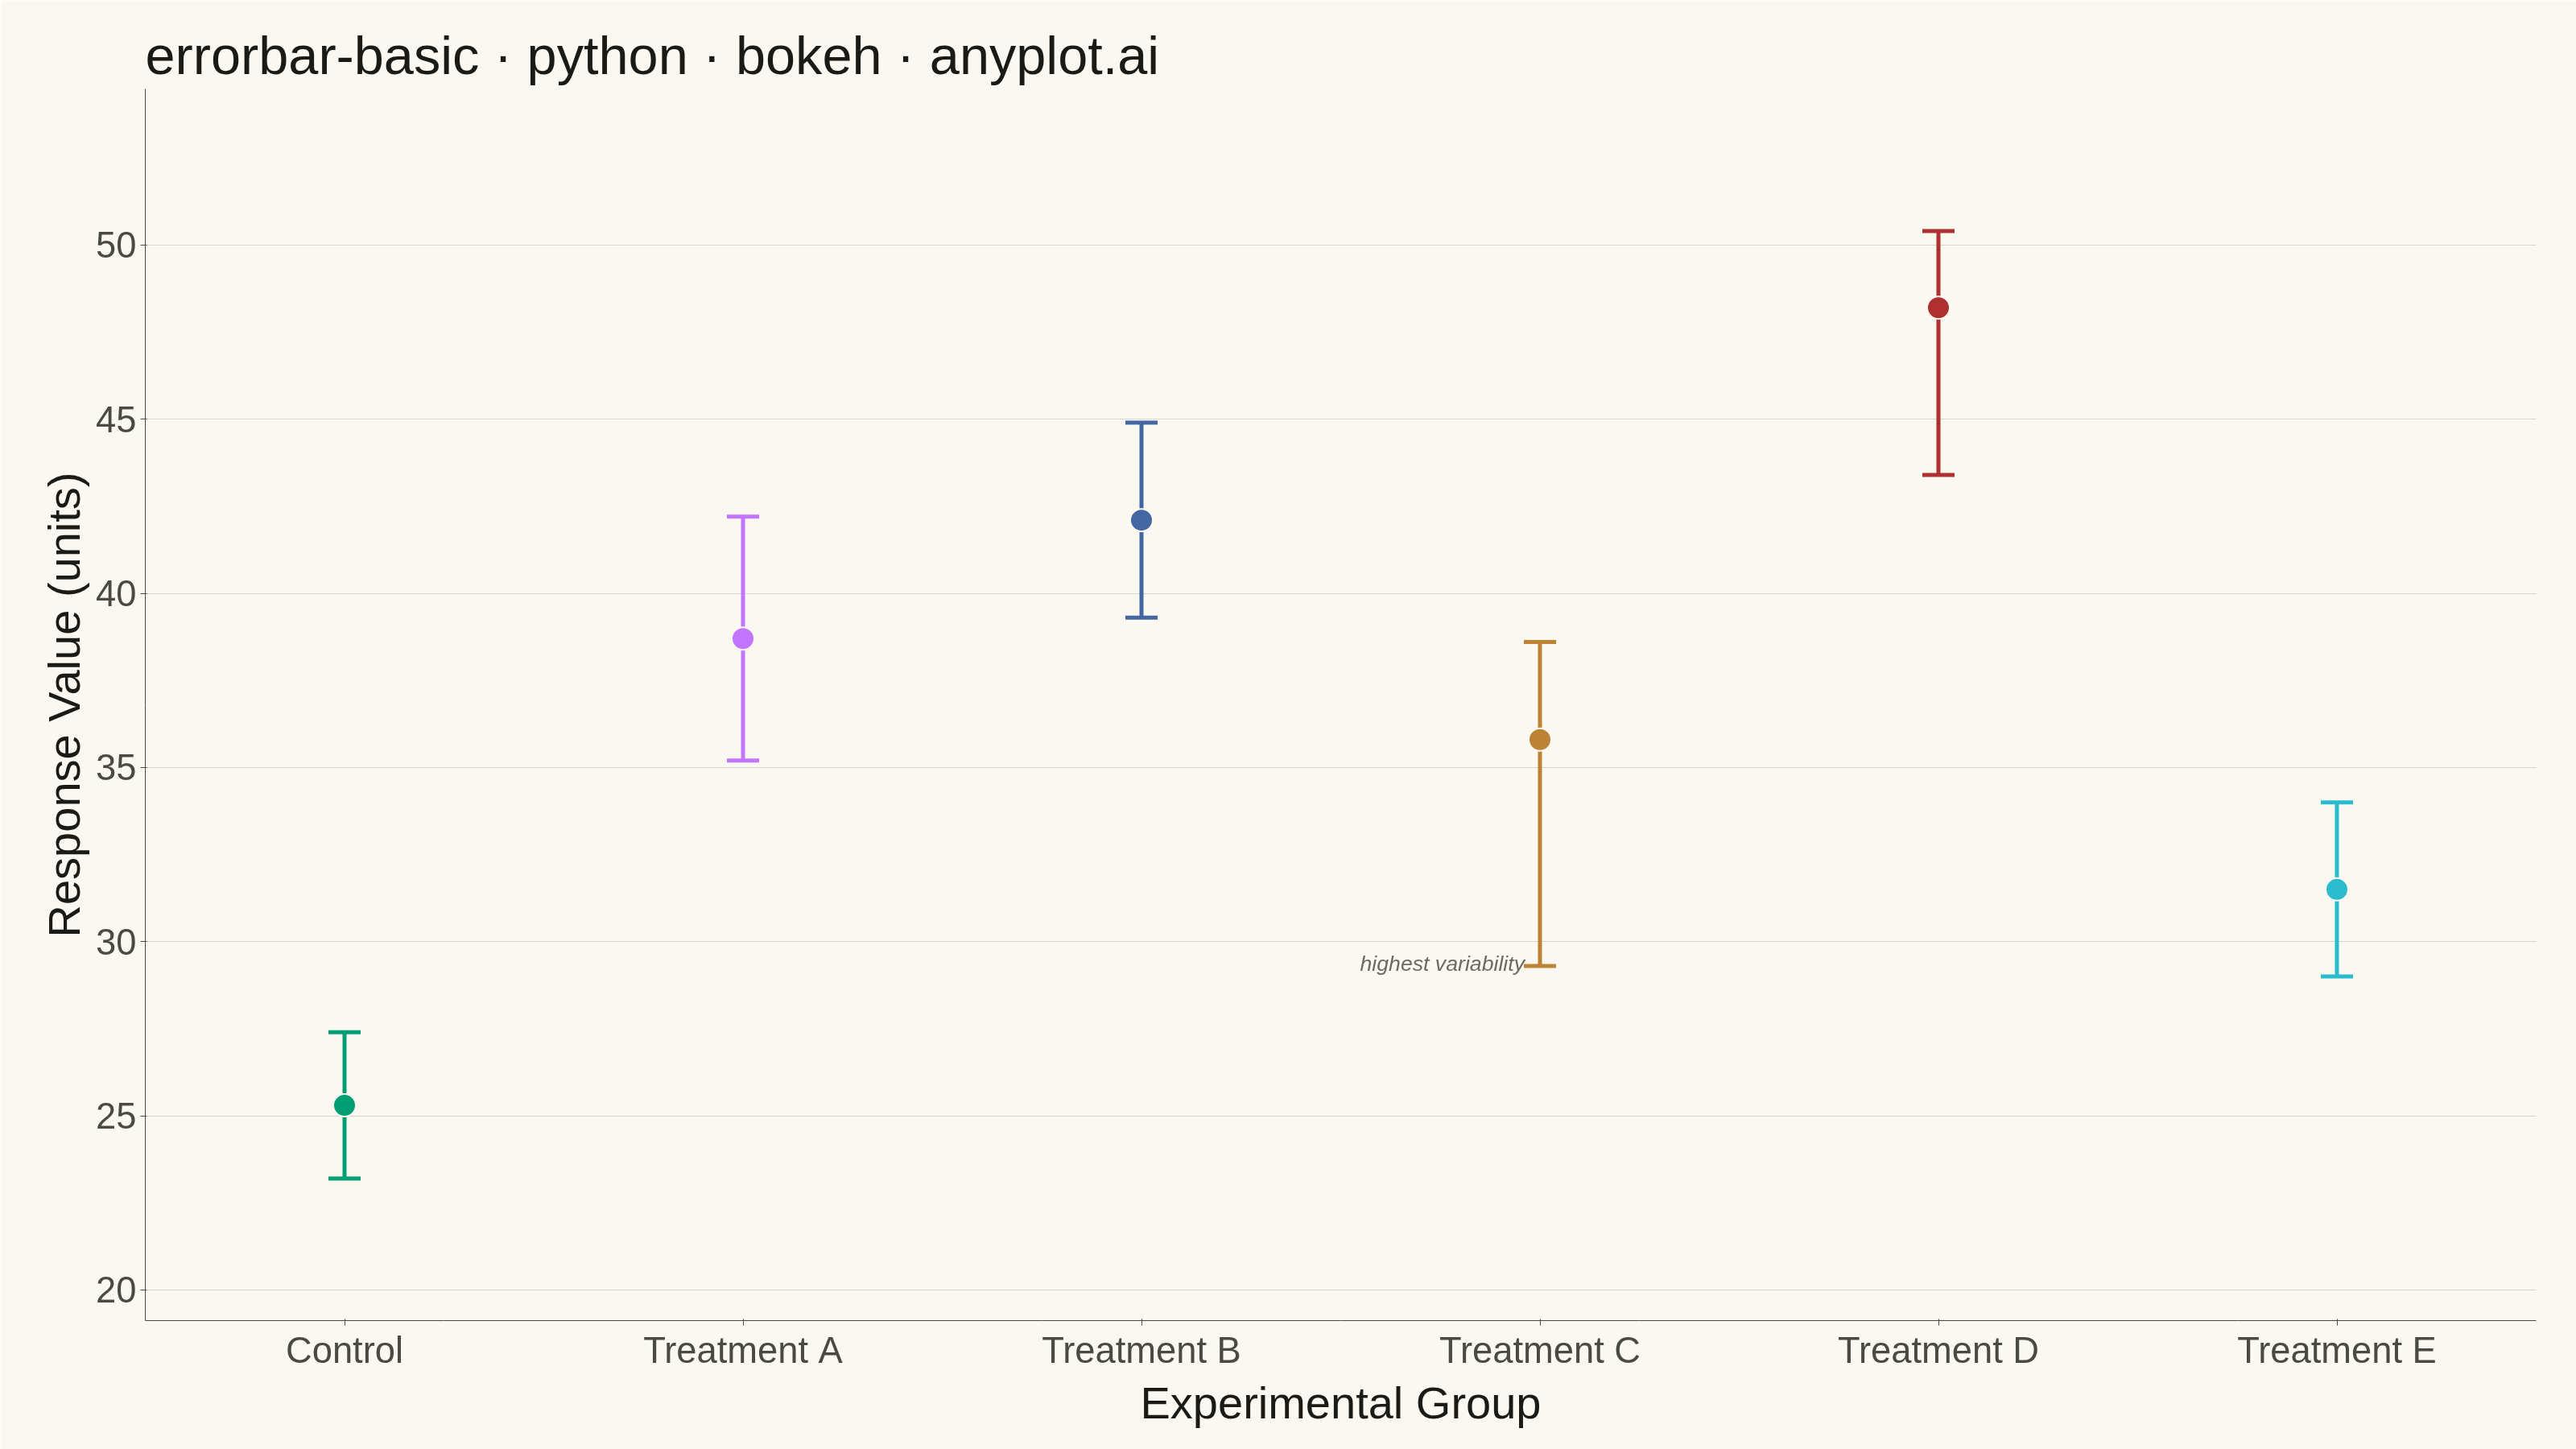
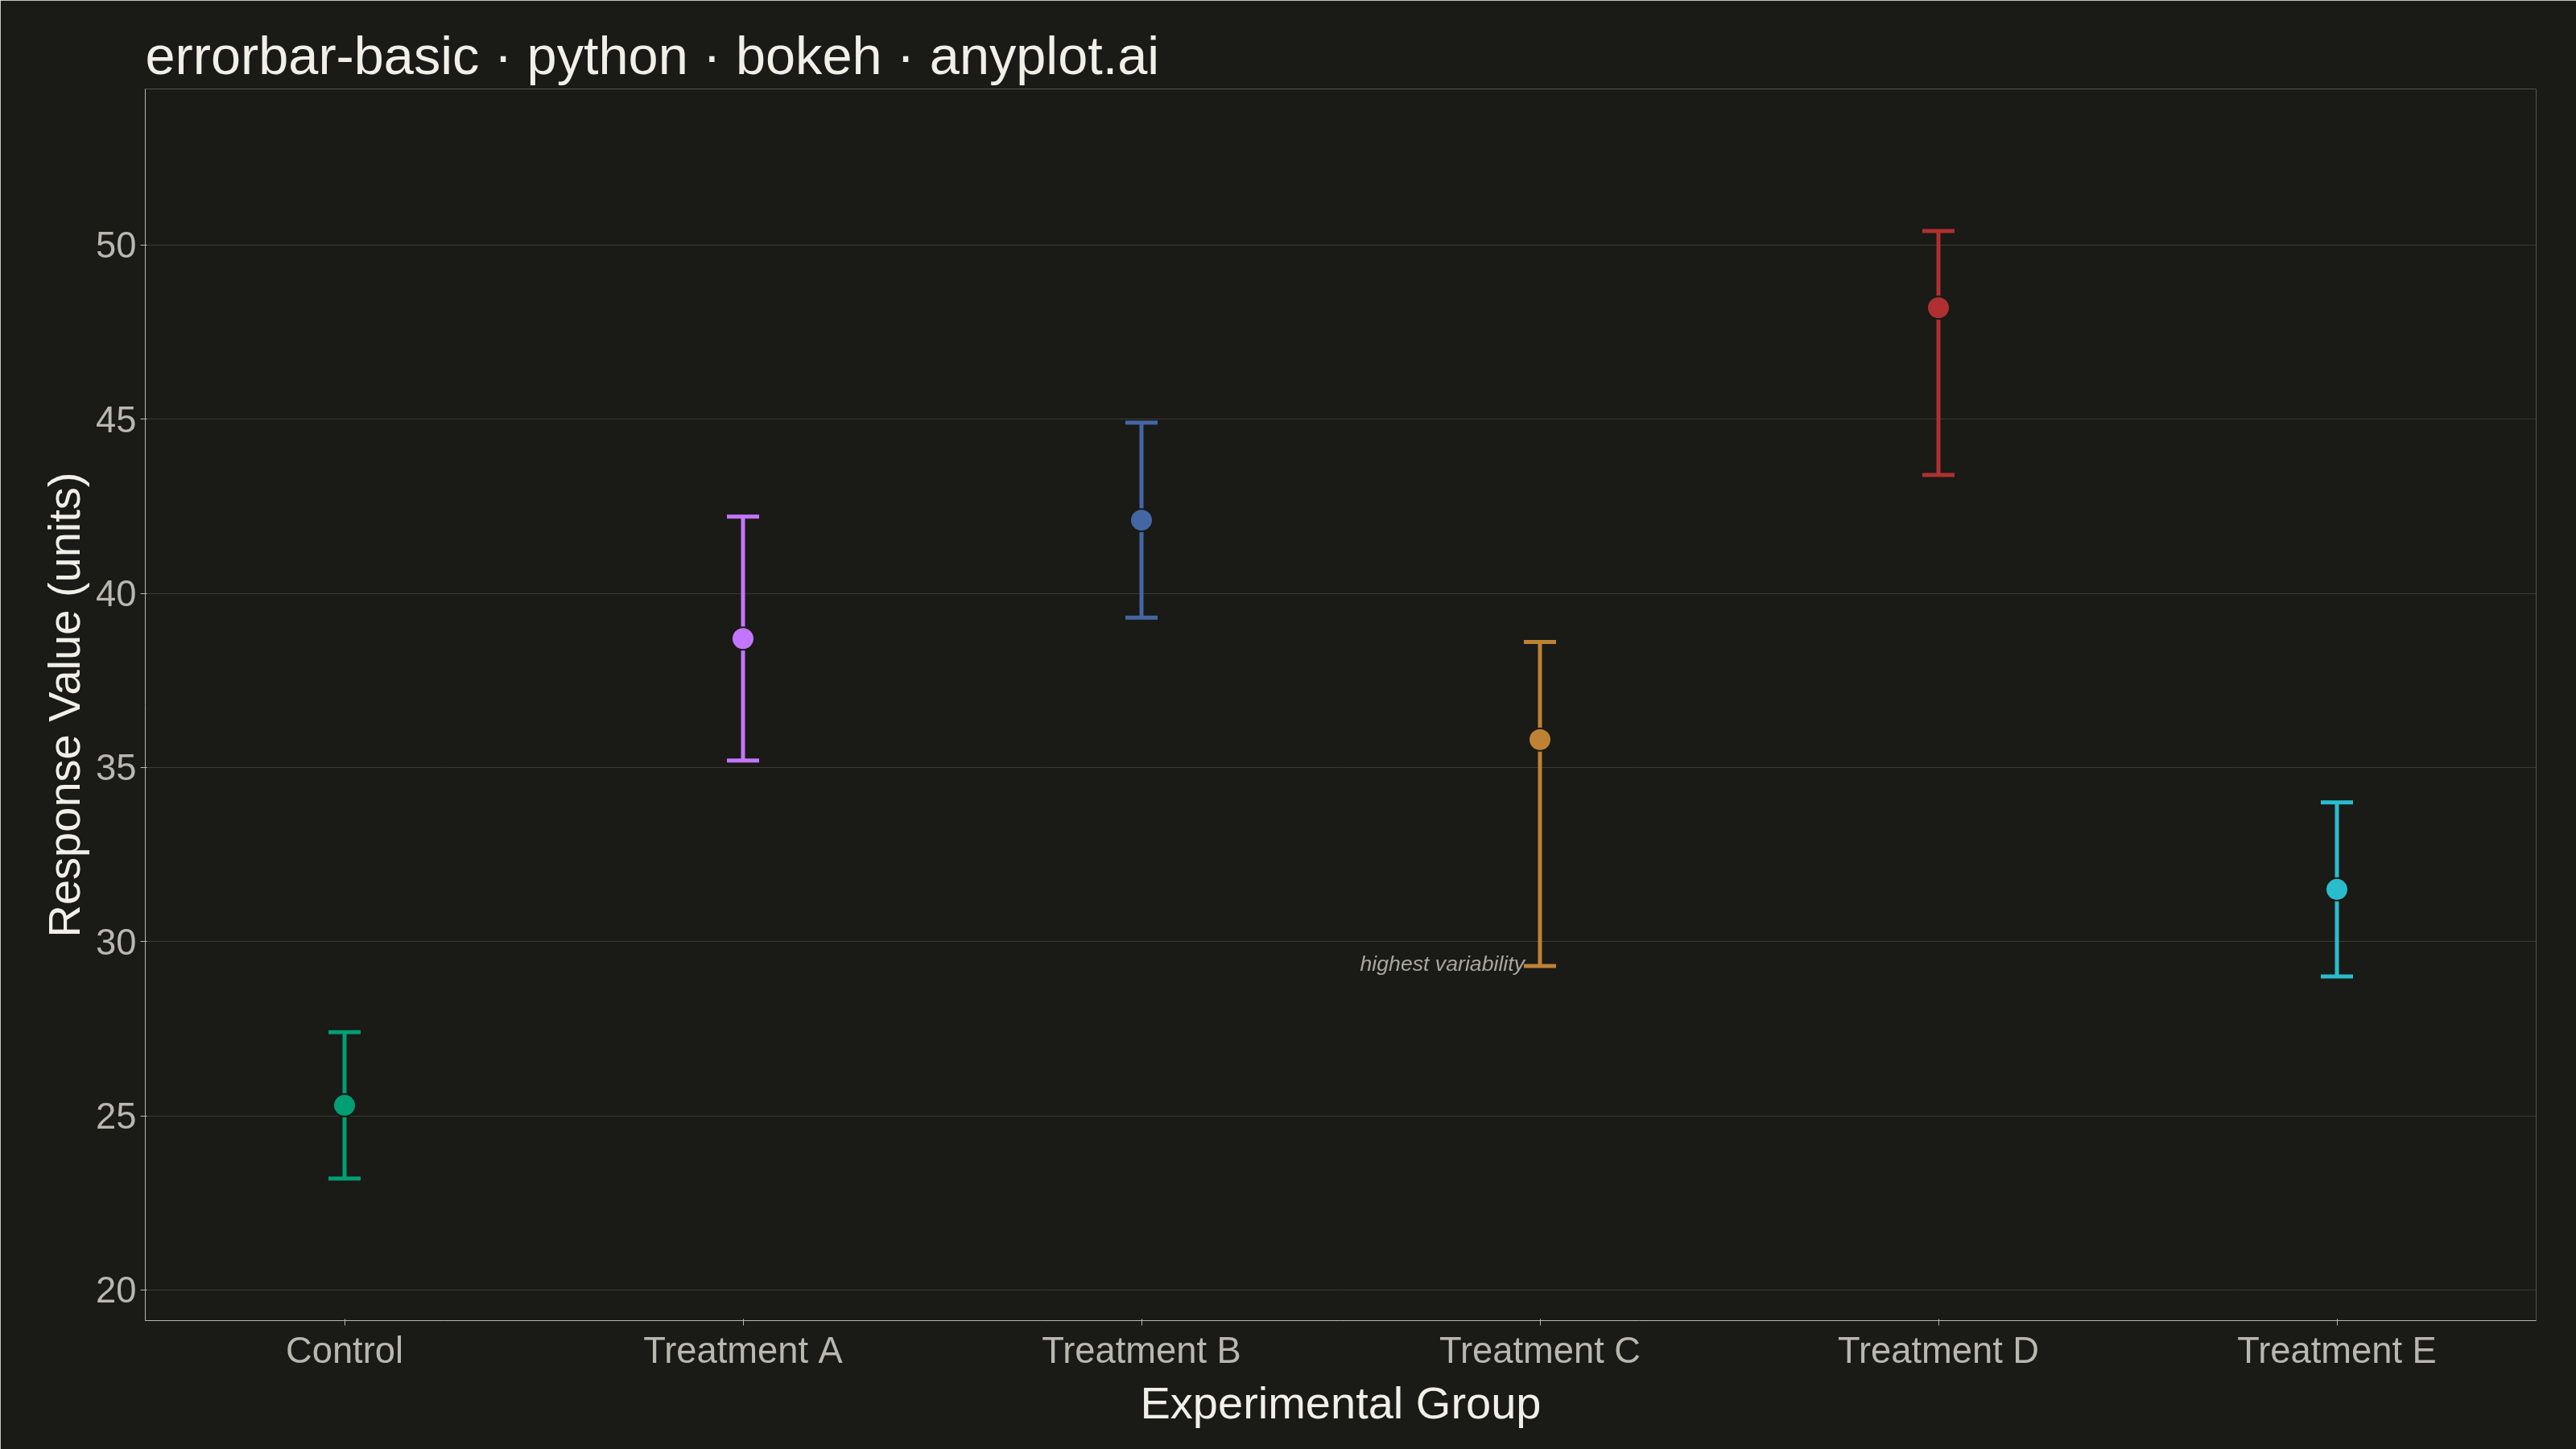
An error bar plot displays data points with associated uncertainty or variability represented by bars extending above and below (or left and right of) each point. Error bars commonly represent standard deviation, standard error, confidence intervals, or min/max ranges. This visualization is essential for communicating the reliability and precision of measurements or statistical estimates.
""" anyplot.ai
errorbar-basic: Basic Error Bar Plot
Library: bokeh 3.9.1 | Python 3.13.14
Quality: 92/100 | Updated: 2026-06-30
"""

import os
import sys
import time
from pathlib import Path


# Remove script dir from sys.path so 'bokeh.py' doesn't shadow the installed bokeh package
_here = os.path.dirname(os.path.abspath(__file__))
sys.path = [p for p in sys.path if p != _here]

import numpy as np
from bokeh.io import output_file, save
from bokeh.models import ColumnDataSource, Label, TeeHead, Whisker
from bokeh.plotting import figure
from selenium import webdriver
from selenium.webdriver.chrome.options import Options


# Theme tokens
THEME = os.getenv("ANYPLOT_THEME", "light")
PAGE_BG = "#FAF8F1" if THEME == "light" else "#1A1A17"
ELEVATED_BG = "#FFFDF6" if THEME == "light" else "#242420"
INK = "#1A1A17" if THEME == "light" else "#F0EFE8"
INK_SOFT = "#4A4A44" if THEME == "light" else "#B8B7B0"
INK_MUTED = "#6B6A63" if THEME == "light" else "#A8A79F"

# Imprint categorical palette (positions 1-6)
IMPRINT = ["#009E73", "#C475FD", "#4467A3", "#BD8233", "#AE3030", "#2ABCCD"]

# Data — experimental measurements with associated uncertainties
np.random.seed(42)
categories = ["Control", "Treatment A", "Treatment B", "Treatment C", "Treatment D", "Treatment E"]
means = np.array([25.3, 38.7, 42.1, 35.8, 48.2, 31.5])

# Asymmetric errors — Treatment C has highest variability, Treatment D has highest mean
lower_errors = np.array([2.1, 3.5, 2.8, 6.5, 4.8, 2.5])
upper_errors = np.array([2.1, 3.5, 2.8, 2.8, 2.2, 2.5])

upper = means + upper_errors
lower = means - lower_errors
colors = IMPRINT[: len(categories)]

source = ColumnDataSource(
    data={"categories": categories, "means": means, "upper": upper, "lower": lower, "colors": colors}
)

# Canvas: 3200×1800 (landscape) — hard rule, no deviation
W, H = 3200, 1800

p = figure(
    width=W,
    height=H,
    x_range=categories,
    title="errorbar-basic · python · bokeh · anyplot.ai",
    x_axis_label="Experimental Group",
    y_axis_label="Response Value (units)",
    toolbar_location=None,
    tools="",
    min_border_bottom=160,
    min_border_left=180,
    min_border_top=110,
    min_border_right=50,
)

# Error bars (Whisker with TeeHead caps) — one whisker per group so each can take its own color
for cat, up, lo, col in zip(categories, upper, lower, colors, strict=True):
    grp_source = ColumnDataSource(data={"x": [cat], "upper": [up], "lower": [lo]})
    whisker = Whisker(
        base="x",
        upper="upper",
        lower="lower",
        source=grp_source,
        line_color=col,
        line_width=5,
        upper_head=TeeHead(size=40, line_color=col, line_width=5),
        lower_head=TeeHead(size=40, line_color=col, line_width=5),
    )
    p.add_layout(whisker)

# Mean markers — colored per group
p.scatter(x="categories", y="means", source=source, size=28, color="colors", line_color=PAGE_BG, line_width=2)

# Annotation: highlight highest variability (Treatment C, index 3)
focus_idx = int(np.argmax(lower_errors + upper_errors))
focus_label = Label(
    x=focus_idx,
    y=float(lower[focus_idx]),
    x_units="data",
    y_units="data",
    x_offset=24,
    y_offset=-12,
    text="highest variability",
    text_color=INK_MUTED,
    text_font_size="20pt",
    text_font_style="italic",
)
p.add_layout(focus_label)

# Style — background and outline
p.background_fill_color = PAGE_BG
p.border_fill_color = PAGE_BG
p.outline_line_color = None

# Title
p.title.text_color = INK
p.title.text_font_size = "50pt"
p.title.text_font_style = "normal"
p.title.align = "left"

# Axis labels
p.xaxis.axis_label_text_color = INK
p.yaxis.axis_label_text_color = INK
p.xaxis.axis_label_text_font_size = "42pt"
p.yaxis.axis_label_text_font_size = "42pt"
p.xaxis.axis_label_text_font_style = "normal"
p.yaxis.axis_label_text_font_style = "normal"

# Tick labels
p.xaxis.major_label_text_color = INK_SOFT
p.yaxis.major_label_text_color = INK_SOFT
p.xaxis.major_label_text_font_size = "34pt"
p.yaxis.major_label_text_font_size = "34pt"

# Axis lines and ticks
p.xaxis.axis_line_color = INK_SOFT
p.yaxis.axis_line_color = INK_SOFT
p.xaxis.major_tick_line_color = INK_SOFT
p.yaxis.major_tick_line_color = INK_SOFT
p.xaxis.minor_tick_line_color = None
p.yaxis.minor_tick_line_color = None

# Subtle y-grid only
p.ygrid.grid_line_color = INK
p.ygrid.grid_line_alpha = 0.15
p.xgrid.grid_line_color = None

# Y-range trimmed to data — eliminates dead space below
y_min = float(min(lower))
y_max = float(max(upper))
y_pad = (y_max - y_min) * 0.15
p.y_range.start = max(0.0, y_min - y_pad)
p.y_range.end = y_max + y_pad

# Save HTML (required interactive artifact)
output_file(f"plot-{THEME}.html", title="errorbar-basic · python · bokeh · anyplot.ai")
save(p)

# Screenshot with headless Chrome via Selenium — export_png uses chromedriver snap shim which fails
opts = Options()
for arg in (
    "--headless=new",
    "--no-sandbox",
    "--disable-dev-shm-usage",
    "--disable-gpu",
    f"--window-size={W},{H}",
    "--hide-scrollbars",
):
    opts.add_argument(arg)
driver = webdriver.Chrome(options=opts)
# Use CDP to set exact viewport dimensions (--window-size alone can be 100-150px short due to browser chrome)
driver.execute_cdp_cmd(
    "Emulation.setDeviceMetricsOverride", {"width": W, "height": H, "deviceScaleFactor": 1, "mobile": False}
)
driver.get(f"file://{Path(f'plot-{THEME}.html').resolve()}")
time.sleep(3)
driver.save_screenshot(f"plot-{THEME}.png")
driver.quit()
Runnable source as JSON, for any HTTP client: https://api.anyplot.ai/specs/errorbar-basic/bokeh/code. Any spec id and library id listed in llms-full.txt fit the same URL shape; every URL below is complete and callable.
{
  "spec_id": "errorbar-basic",
  "language": "python",
  "library": "bokeh",
  "page": "https://anyplot.ai/errorbar-basic/python/bokeh",
  "hub": "https://anyplot.ai/errorbar-basic",
  "code_json": "https://api.anyplot.ai/specs/errorbar-basic/bokeh/code",
  "spec_json": "https://api.anyplot.ai/specs/errorbar-basic",
  "render_light_png": "https://storage.googleapis.com/anyplot-images/plots/errorbar-basic/python/bokeh/plot-light.png",
  "render_dark_png": "https://storage.googleapis.com/anyplot-images/plots/errorbar-basic/python/bokeh/plot-dark.png",
  "interactive_light_html": "https://storage.googleapis.com/anyplot-images/plots/errorbar-basic/python/bokeh/plot-light.html",
  "interactive_dark_html": "https://storage.googleapis.com/anyplot-images/plots/errorbar-basic/python/bokeh/plot-dark.html",
  "quality_score": 92.0,
  "license": "MIT",
  "guide": "https://anyplot.ai/llms.txt"
}
Part of Basic Error Bar Plot on anyplot.ai.