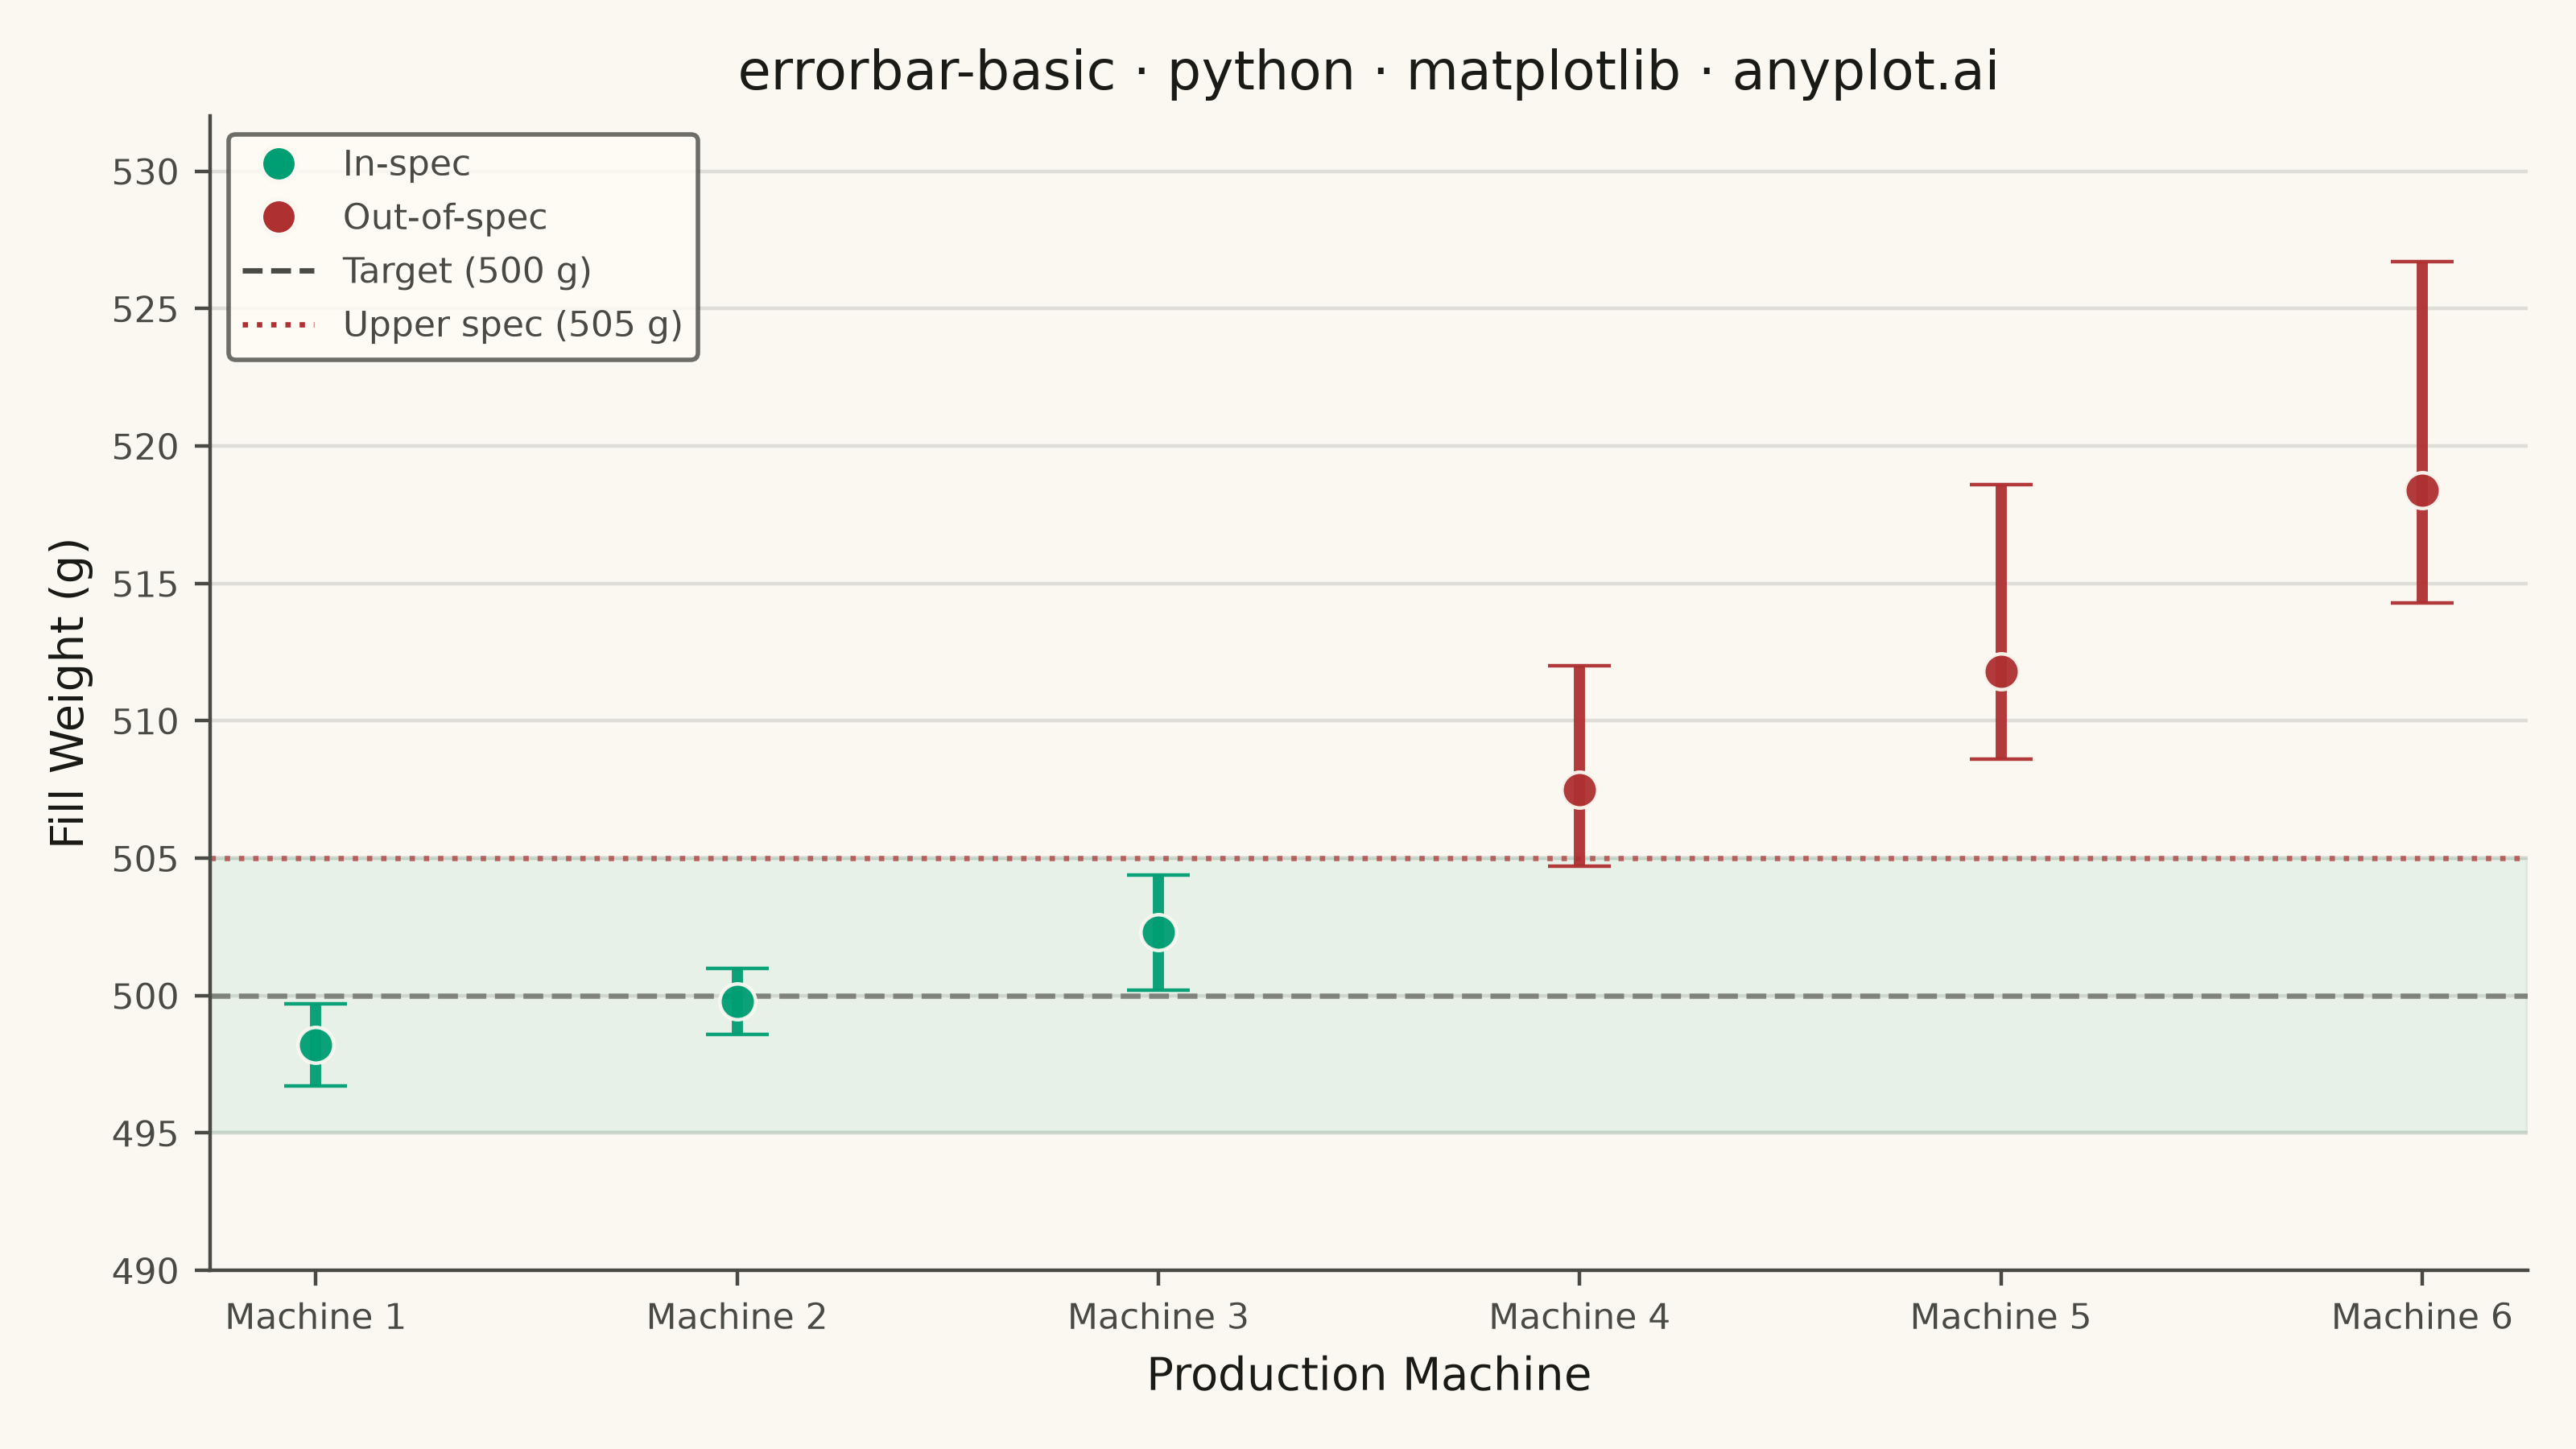
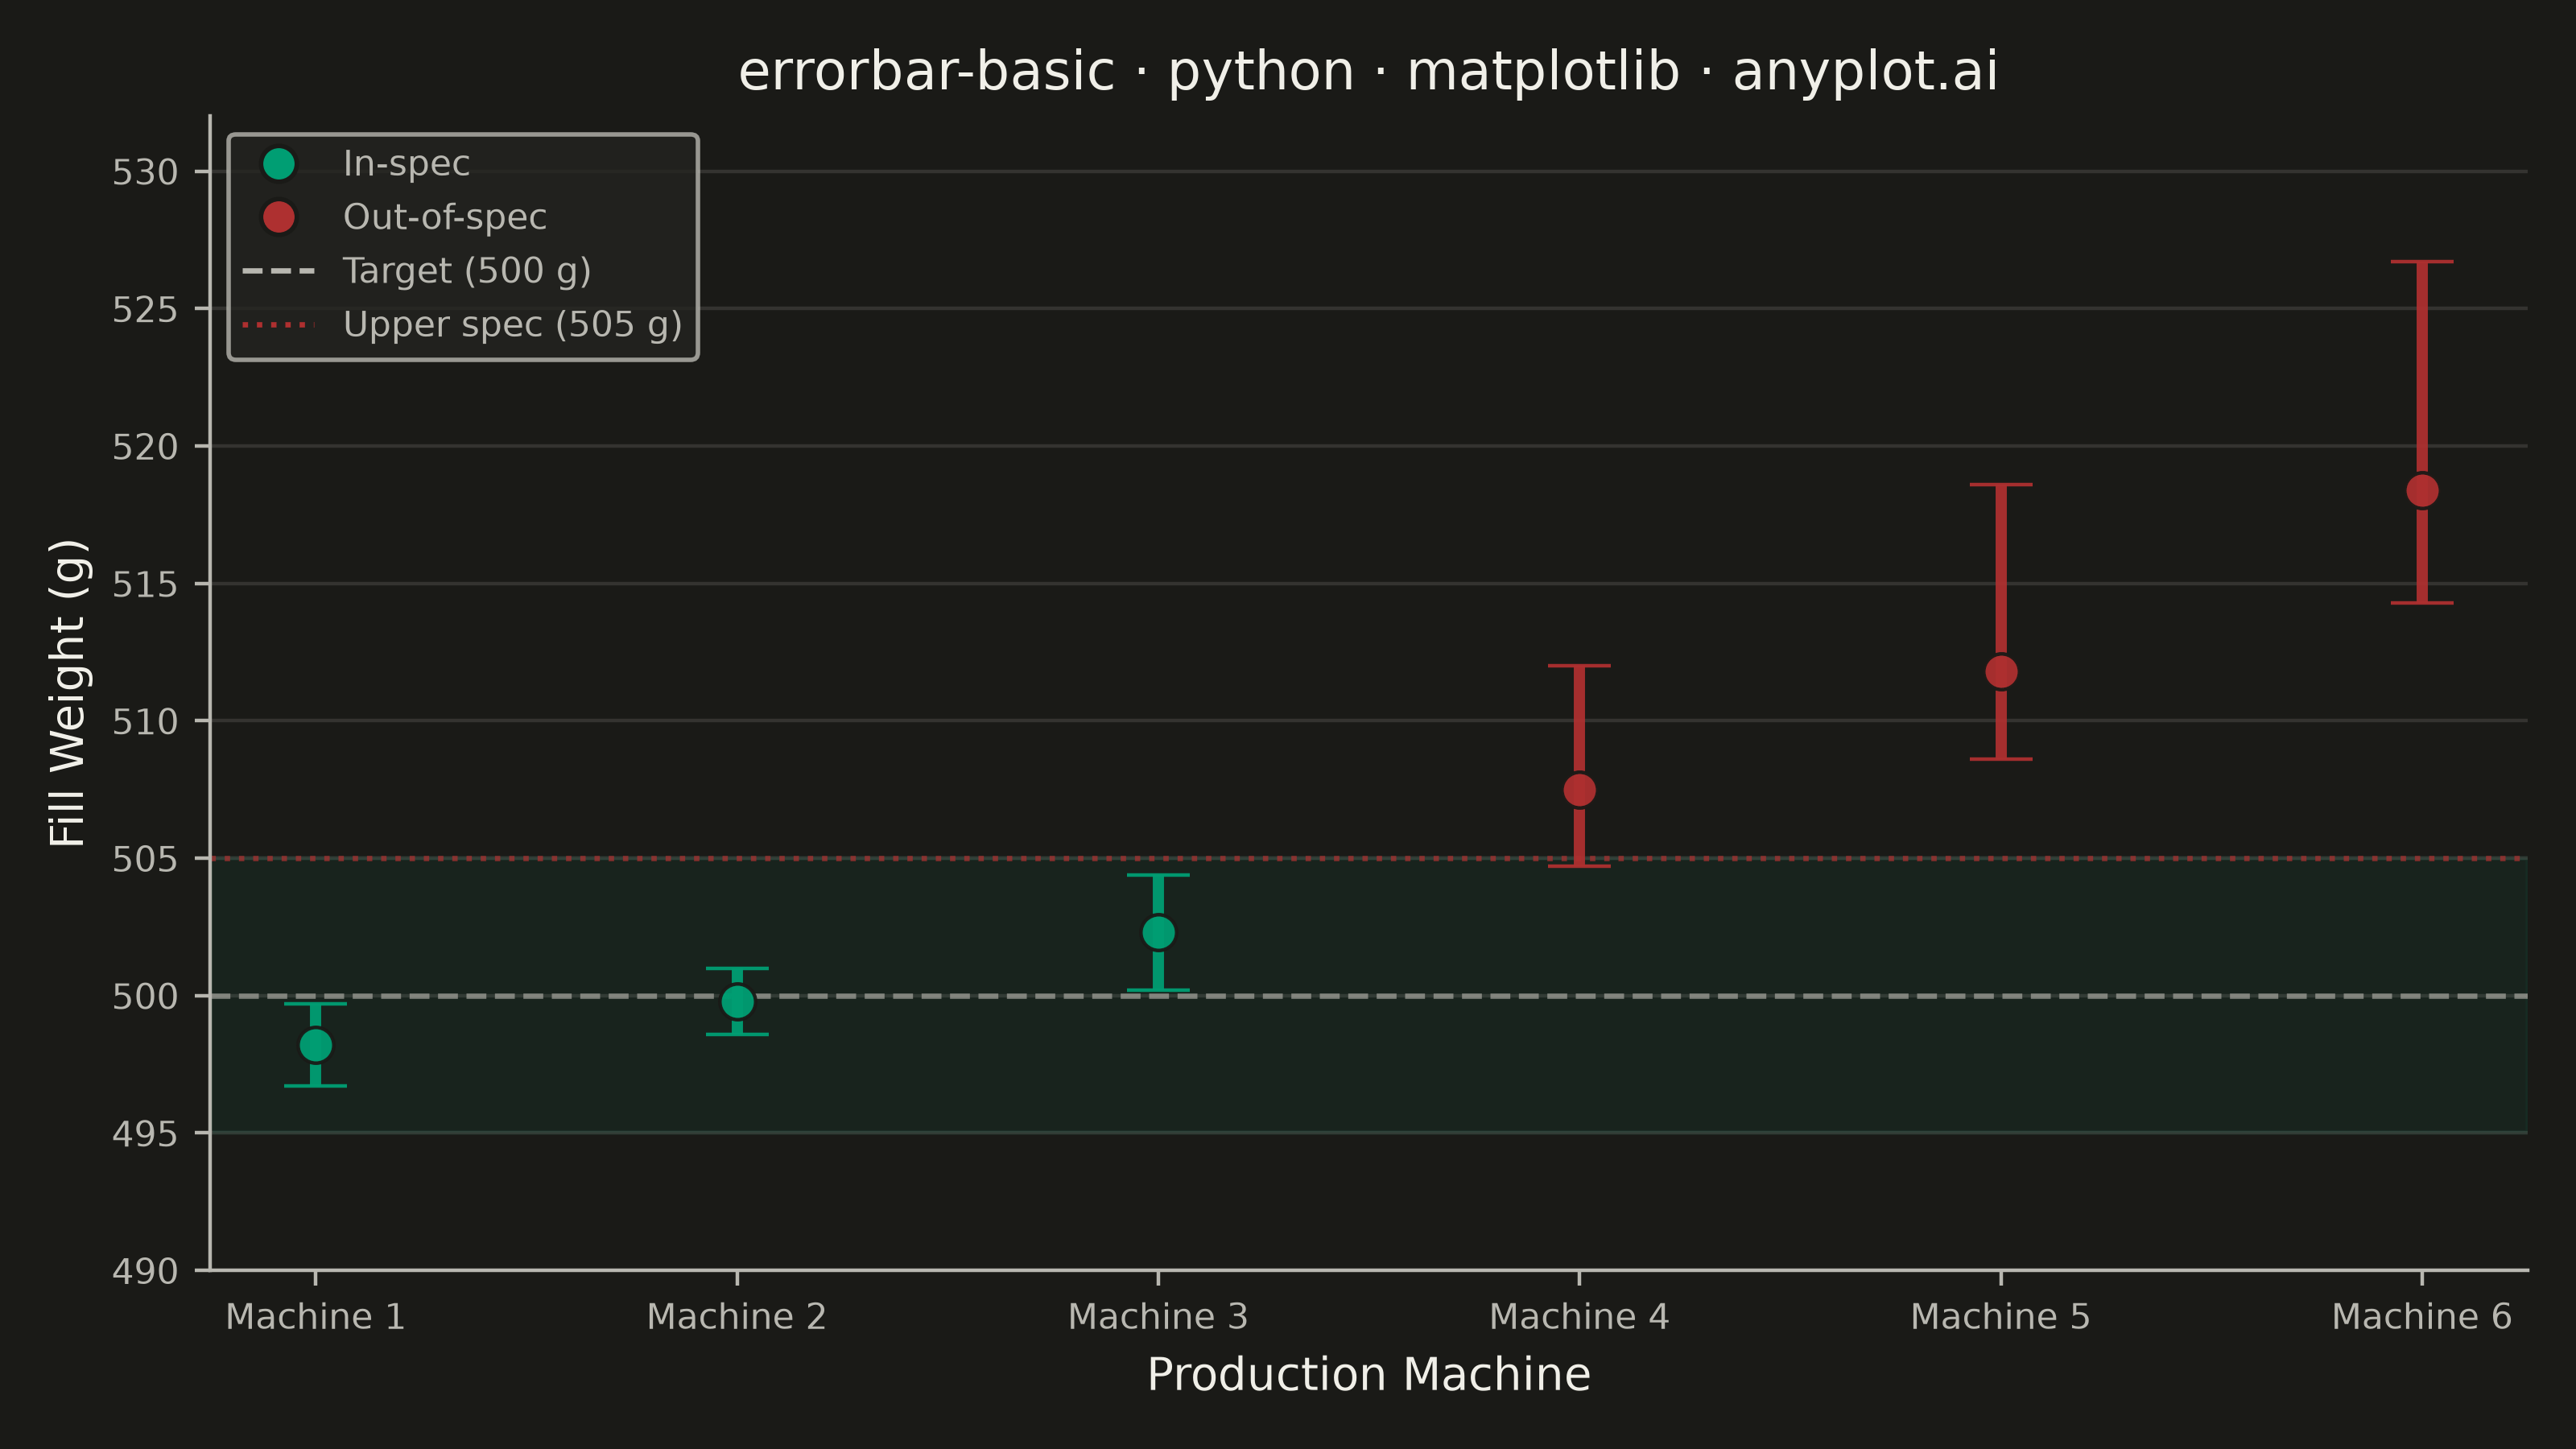
An error bar plot displays data points with associated uncertainty or variability represented by bars extending above and below (or left and right of) each point. Error bars commonly represent standard deviation, standard error, confidence intervals, or min/max ranges. This visualization is essential for communicating the reliability and precision of measurements or statistical estimates.
""" anyplot.ai
errorbar-basic: Basic Error Bar Plot
Library: matplotlib 3.11.0 | Python 3.13.14
Quality: 91/100 | Updated: 2026-06-30
"""

import os

import matplotlib.pyplot as plt
import numpy as np
from matplotlib.lines import Line2D


# Theme tokens
THEME = os.getenv("ANYPLOT_THEME", "light")
PAGE_BG = "#FAF8F1" if THEME == "light" else "#1A1A17"
ELEVATED_BG = "#FFFDF6" if THEME == "light" else "#242420"
INK = "#1A1A17" if THEME == "light" else "#F0EFE8"
INK_SOFT = "#4A4A44" if THEME == "light" else "#B8B7B0"
INK_MUTED = "#6B6A63" if THEME == "light" else "#A8A79F"
BRAND = "#009E73"  # Imprint palette position 1 — in-spec machines
IMPRINT_RED = "#AE3030"  # Imprint palette position 5 — out-of-spec machines

# Data: fill weight calibration across 6 production machines (target: 500 g, USL: 505 g)
# Machines 1-3 are well-calibrated (symmetric errors); machines 4-6 show process drift (asymmetric)
machines = ["Machine 1", "Machine 2", "Machine 3", "Machine 4", "Machine 5", "Machine 6"]
x = np.arange(len(machines))
weights = np.array([498.2, 499.8, 502.3, 507.5, 511.8, 518.4])
TARGET = 500.0
UPPER_SPEC = 505.0

# Symmetric errors for well-calibrated machines; asymmetric for drifting machines
errors_lower = np.array([1.5, 1.2, 2.1, 2.8, 3.2, 4.1])
errors_upper = np.array([1.5, 1.2, 2.1, 4.5, 6.8, 8.3])

# Color by compliance: in-spec = brand green, out-of-spec = Imprint red
point_colors = [BRAND if w <= UPPER_SPEC else IMPRINT_RED for w in weights]

# Plot
fig, ax = plt.subplots(figsize=(8, 4.5), dpi=400, facecolor=PAGE_BG)
ax.set_facecolor(PAGE_BG)

# Tolerance band and reference lines drawn first (below data)
ax.axhspan(TARGET - 5, UPPER_SPEC, color=BRAND, alpha=0.07, zorder=0)
ax.axhline(TARGET, color=INK_SOFT, linewidth=1.2, linestyle="--", alpha=0.6, zorder=1)
ax.axhline(UPPER_SPEC, color=IMPRINT_RED, linewidth=1.2, linestyle=":", alpha=0.7, zorder=1)

# One errorbar call per point to support per-machine color coding
for xi, yi, el, eu, col in zip(x, weights, errors_lower, errors_upper, point_colors, strict=True):
    ax.errorbar(
        xi,
        yi,
        yerr=[[el], [eu]],
        fmt="o",
        markersize=8,
        color=col,
        ecolor=col,
        elinewidth=2.5,
        capsize=7,
        capthick=2.5,
        markeredgecolor=PAGE_BG,
        markeredgewidth=0.8,
        alpha=0.95,
    )

# Style
title = "errorbar-basic · python · matplotlib · anyplot.ai"
ax.set_title(title, fontsize=12, fontweight="medium", color=INK)
ax.set_xlabel("Production Machine", fontsize=10, color=INK)
ax.set_ylabel("Fill Weight (g)", fontsize=10, color=INK)
ax.set_xticks(x)
ax.set_xticklabels(machines)
ax.tick_params(axis="both", labelsize=8, colors=INK_SOFT, labelcolor=INK_SOFT)
ax.spines["top"].set_visible(False)
ax.spines["right"].set_visible(False)
for s in ("left", "bottom"):
    ax.spines[s].set_color(INK_SOFT)
ax.yaxis.grid(True, alpha=0.12, linewidth=0.8, color=INK)
ax.set_axisbelow(True)
ax.set_ylim(490, 532)

# Legend — in-spec/out-of-spec groups plus reference lines
legend_elements = [
    Line2D(
        [0],
        [0],
        marker="o",
        color="none",
        markerfacecolor=BRAND,
        markeredgecolor=PAGE_BG,
        markersize=8,
        label="In-spec",
    ),
    Line2D(
        [0],
        [0],
        marker="o",
        color="none",
        markerfacecolor=IMPRINT_RED,
        markeredgecolor=PAGE_BG,
        markersize=8,
        label="Out-of-spec",
    ),
    Line2D([0], [0], color=INK_SOFT, linewidth=1.2, linestyle="--", label="Target (500 g)"),
    Line2D([0], [0], color=IMPRINT_RED, linewidth=1.2, linestyle=":", label="Upper spec (505 g)"),
]
leg = ax.legend(handles=legend_elements, fontsize=8, loc="upper left")
leg.get_frame().set_facecolor(ELEVATED_BG)
leg.get_frame().set_edgecolor(INK_SOFT)
plt.setp(leg.get_texts(), color=INK_SOFT)

# Save
plt.tight_layout()
plt.savefig(f"plot-{THEME}.png", dpi=400, facecolor=PAGE_BG)
Runnable source as JSON, for any HTTP client: https://api.anyplot.ai/specs/errorbar-basic/matplotlib/code. Any spec id and library id listed in llms-full.txt fit the same URL shape; every URL below is complete and callable.
{
  "spec_id": "errorbar-basic",
  "language": "python",
  "library": "matplotlib",
  "page": "https://anyplot.ai/errorbar-basic/python/matplotlib",
  "hub": "https://anyplot.ai/errorbar-basic",
  "code_json": "https://api.anyplot.ai/specs/errorbar-basic/matplotlib/code",
  "spec_json": "https://api.anyplot.ai/specs/errorbar-basic",
  "render_light_png": "https://storage.googleapis.com/anyplot-images/plots/errorbar-basic/python/matplotlib/plot-light.png",
  "render_dark_png": "https://storage.googleapis.com/anyplot-images/plots/errorbar-basic/python/matplotlib/plot-dark.png",
  "quality_score": 91.0,
  "license": "MIT",
  "guide": "https://anyplot.ai/llms.txt"
}
Part of Basic Error Bar Plot on anyplot.ai.