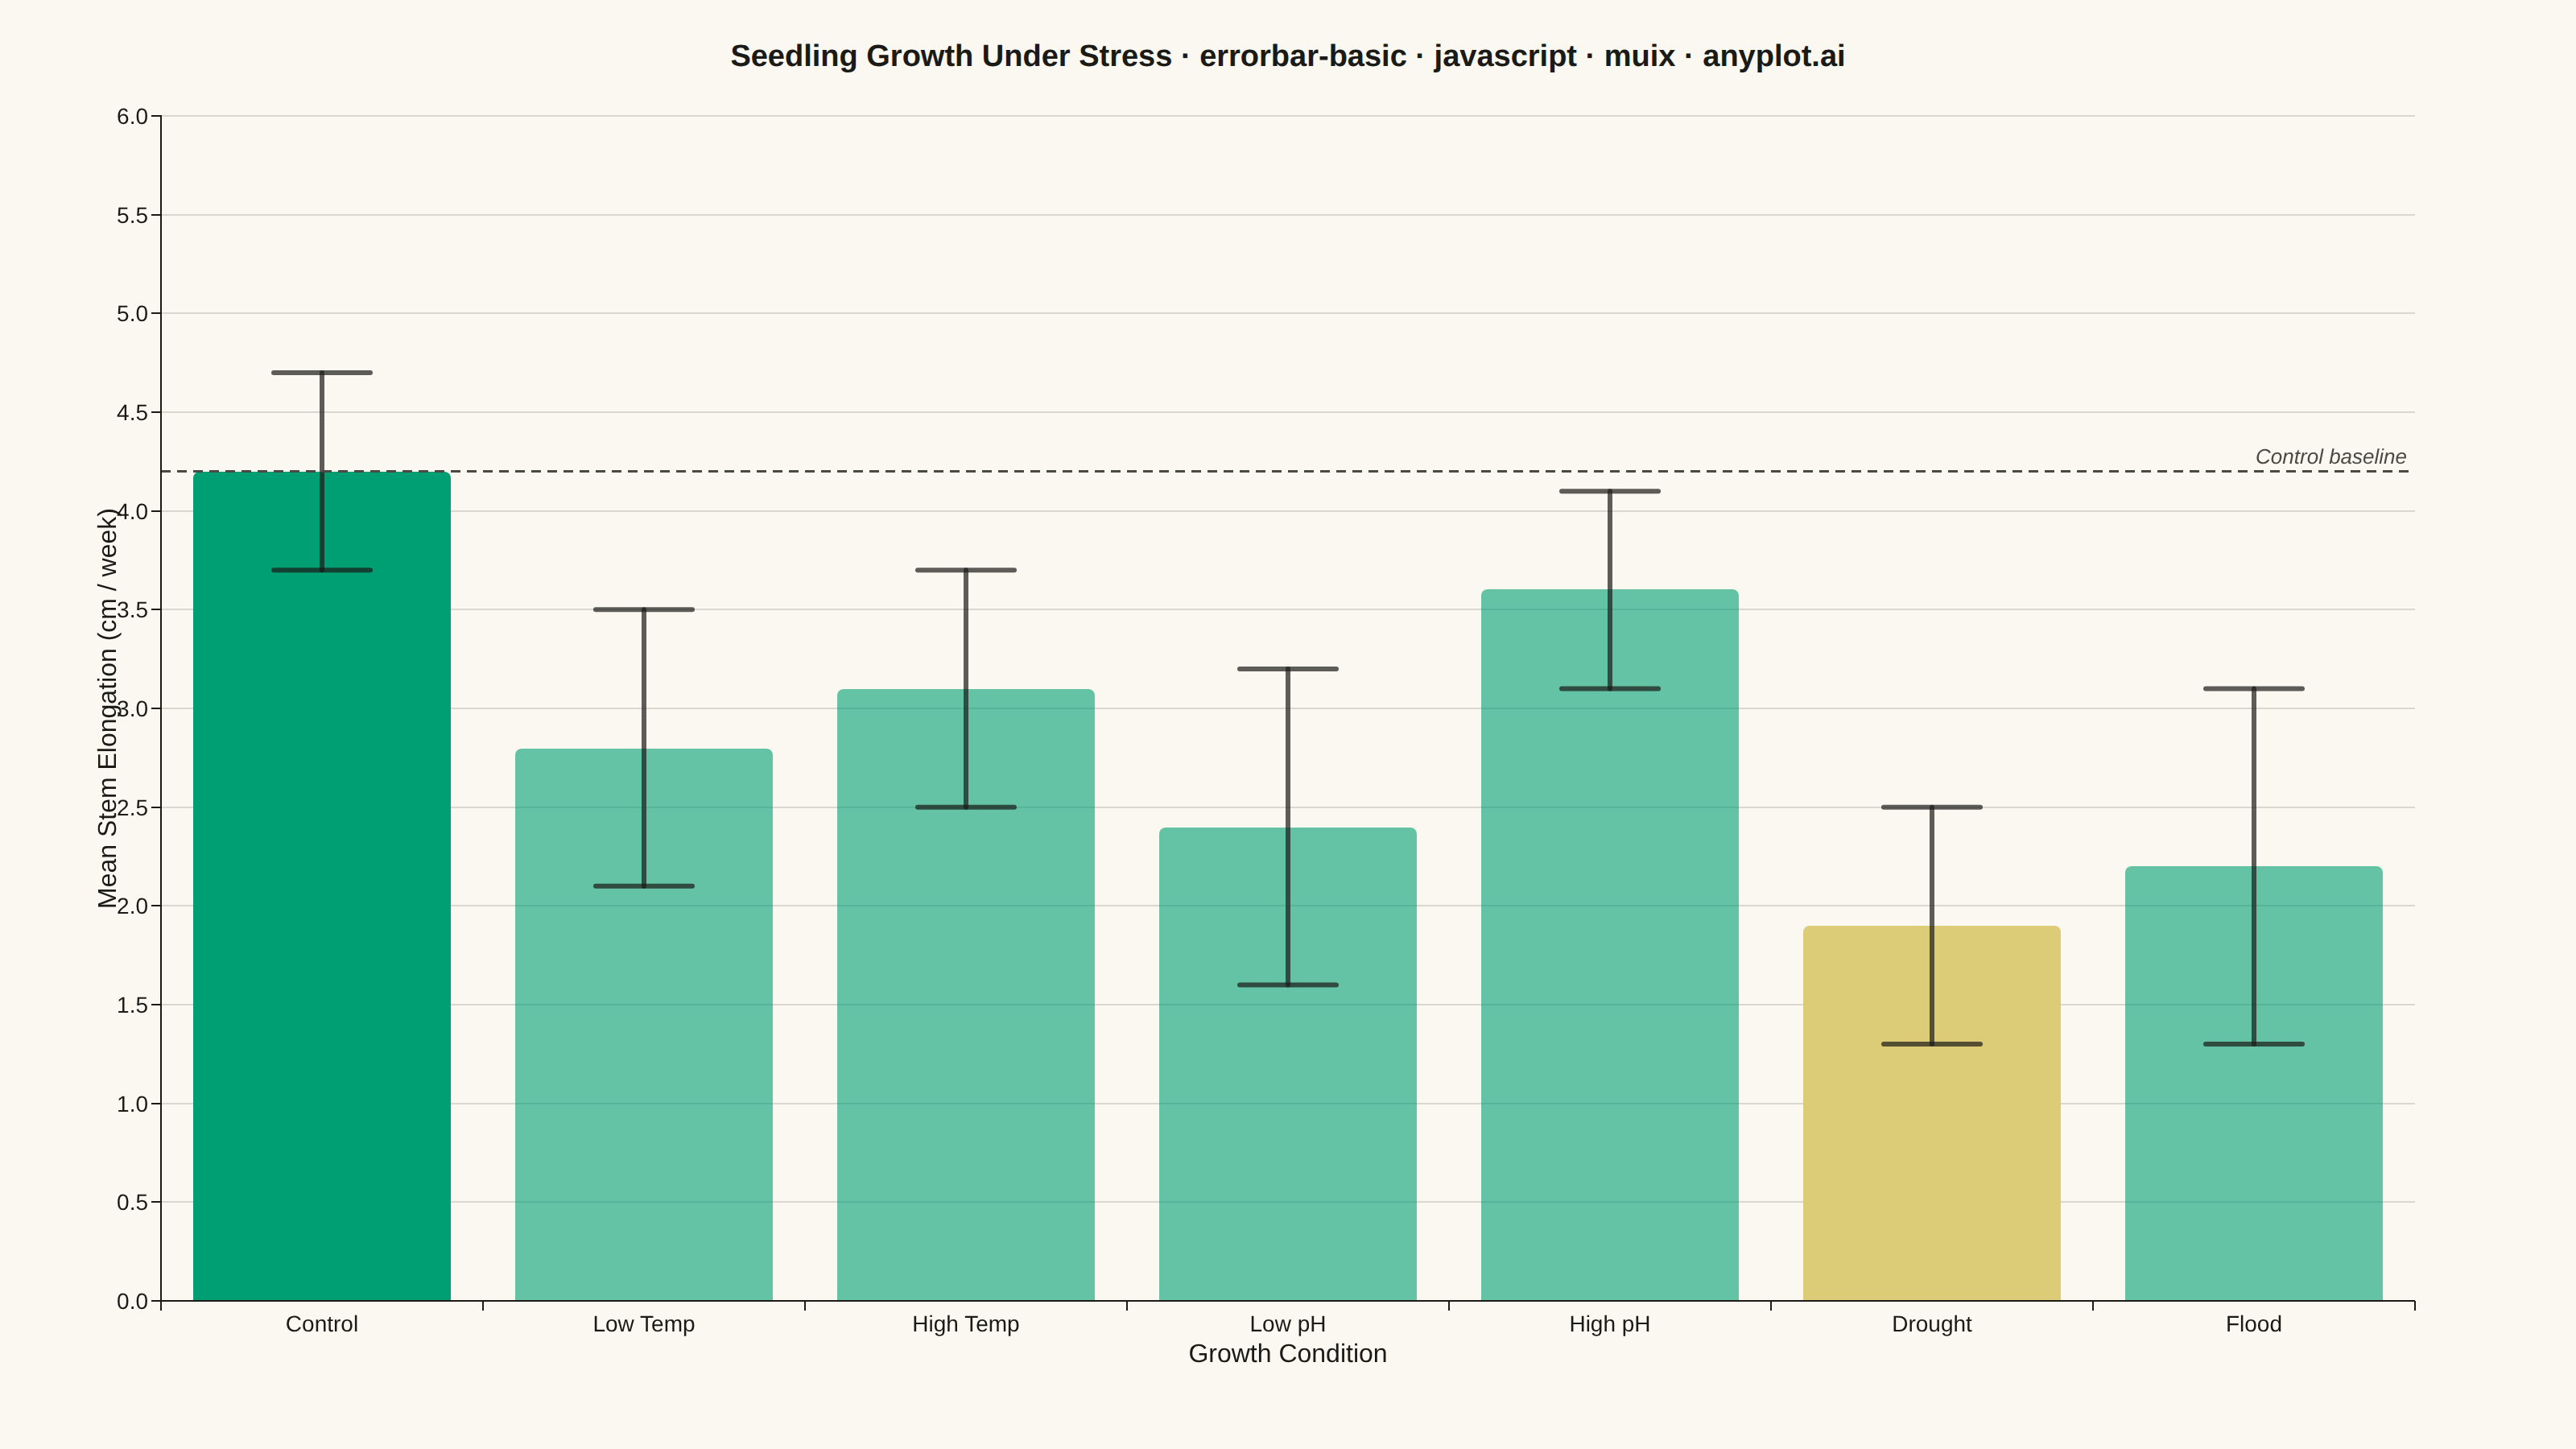
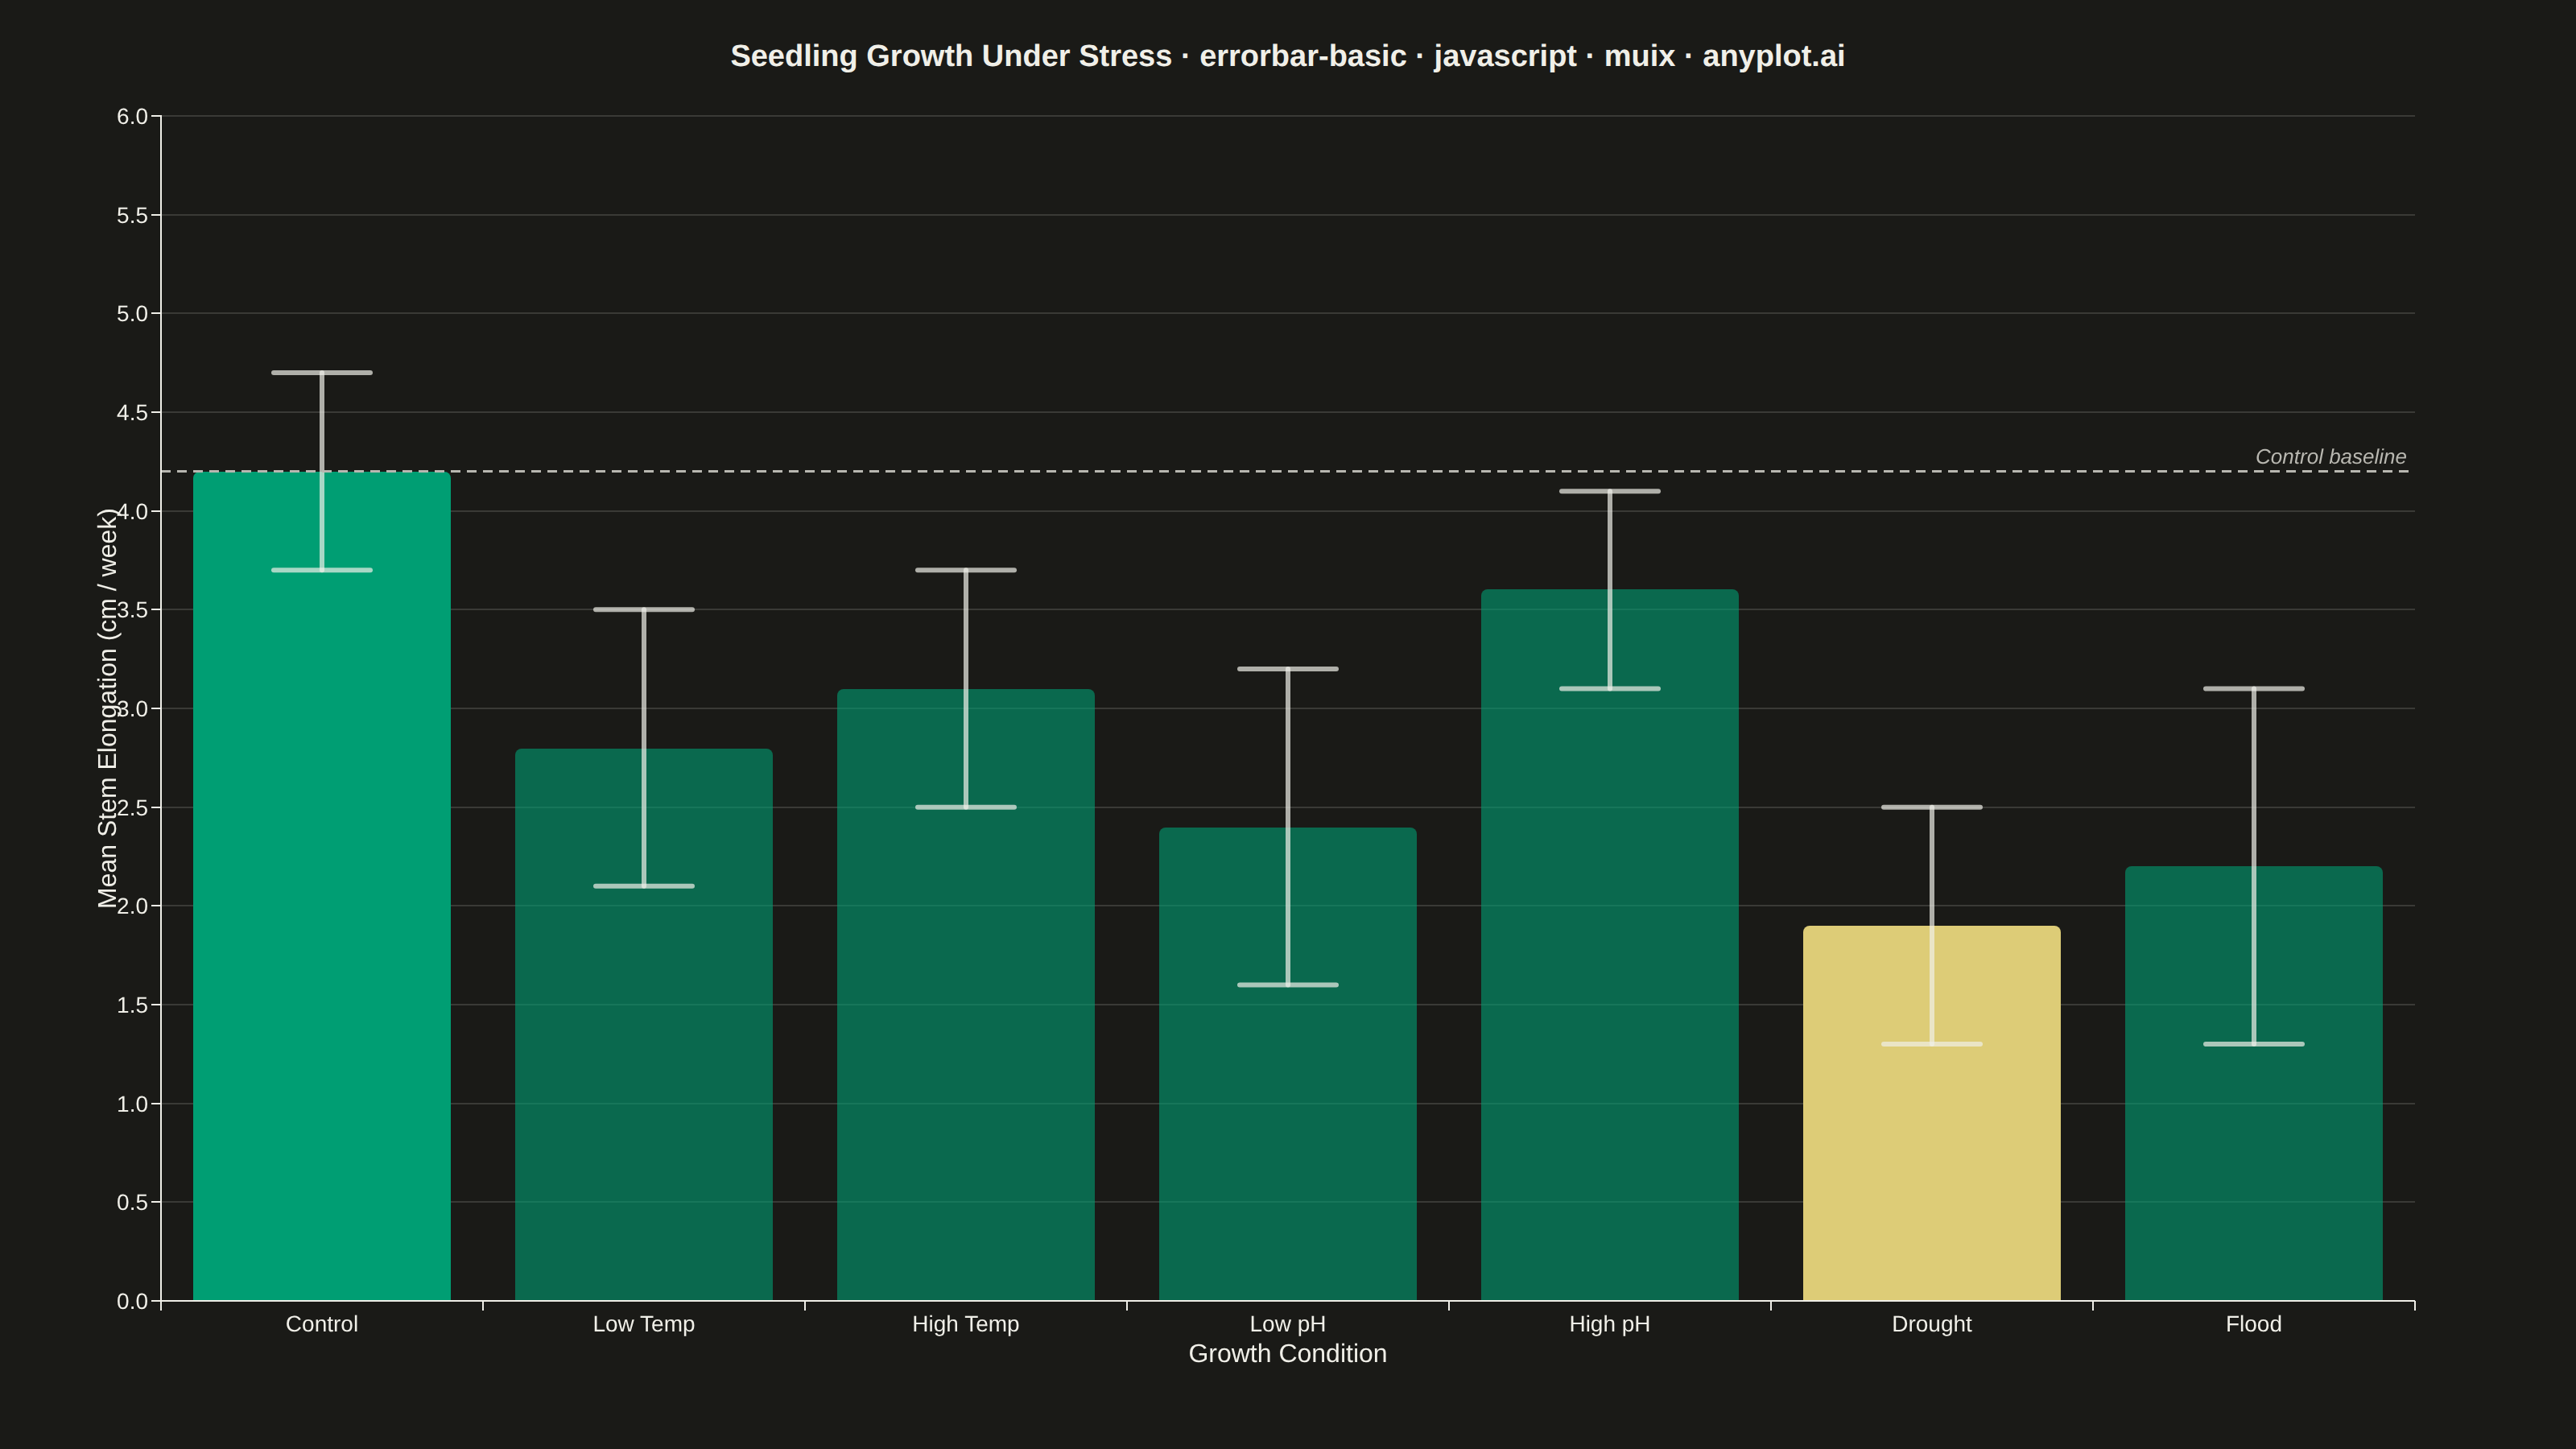
The same plot in 14 other libraries — JavaScript: Chart.js, D3.js, Apache ECharts, Highcharts; Python: Altair, Bokeh, lets-plot, Matplotlib, Plotly, plotnine, Pygal, Seaborn; R: ggplot2; Julia: Makie.jl. Compare all 15 side by side: Basic Error Bar Plot in Python, R, Julia and JavaScript.
An error bar plot displays data points with associated uncertainty or variability represented by bars extending above and below (or left and right of) each point. Error bars commonly represent standard deviation, standard error, confidence intervals, or min/max ranges. This visualization is essential for communicating the reliability and precision of measurements or statistical estimates.
// anyplot.ai
// errorbar-basic: Basic Error Bar Plot
// Library: muix 7.29.1 | JavaScript 22.23.0
// Quality: 88/100 | Created: 2026-06-30
//# anyplot-orientation: landscape
// anyplot.ai
// errorbar-basic: Basic Error Bar Plot
// Library: MUI X Charts | React | Node 22
// License: @mui/x-charts — MIT (community). Pro/Premium are out of scope.
// Quality: pending | Created: 2026-06-30

import { ChartContainer } from "@mui/x-charts/ChartContainer";
import { BarPlot } from "@mui/x-charts/BarChart";
import { ChartsXAxis } from "@mui/x-charts/ChartsXAxis";
import { ChartsYAxis } from "@mui/x-charts/ChartsYAxis";
import { ChartsGrid } from "@mui/x-charts/ChartsGrid";
import { ChartsReferenceLine } from "@mui/x-charts/ChartsReferenceLine";
import { useXScale, useYScale } from "@mui/x-charts/hooks";

const t = window.ANYPLOT_TOKENS;

// Plant stress experiment: mean stem elongation (cm/week) ± 1 SD across 7 growth conditions
const CONDITIONS = ["Control", "Low Temp", "High Temp", "Low pH", "High pH", "Drought", "Flood"];
const MEANS      = [4.2,       2.8,         3.1,         2.4,      3.6,       1.9,       2.2];
const ERRORS     = [0.5,       0.7,         0.6,         0.8,      0.5,       0.6,       0.9];

// Visual hierarchy: Control=full brand green (benchmark), Drought=amber (stress/caution),
// intermediate conditions=muted brand green to draw the eye to the key contrast
const BAR_COLORS = CONDITIONS.map((c) => {
  if (c === "Control") return t.palette[0];   // #009E73 — optimal/reference
  if (c === "Drought") return t.amber;         // #DDCC77 — peak stress (caution anchor)
  return t.palette[0] + "99";                 // ~60% opacity — intermediate conditions
});

// ErrorBars renders ±1 SD whiskers using the CartesianContext scale functions
function ErrorBars() {
  const xScale = useXScale("x");
  const yScale = useYScale("y");
  if (!xScale || !yScale) return null;

  const bw  = (xScale as any).bandwidth();
  const cap = Math.round(bw * 0.19);  // 19% of bandwidth for readable caps

  return (
    <g>
      {CONDITIONS.map((cond, i) => {
        const cx   = (xScale as any)(cond) + bw / 2;
        const yTop = (yScale as any)(MEANS[i] + ERRORS[i]);
        const yBot = (yScale as any)(MEANS[i] - ERRORS[i]);
        return (
          <g key={cond}>
            {/* Vertical whisker */}
            <line x1={cx} y1={yTop} x2={cx} y2={yBot}
                  stroke={t.ink} strokeWidth={3} strokeOpacity={0.7} strokeLinecap="round" />
            {/* Top cap */}
            <line x1={cx - cap} y1={yTop} x2={cx + cap} y2={yTop}
                  stroke={t.ink} strokeWidth={3} strokeOpacity={0.7} strokeLinecap="round" />
            {/* Bottom cap */}
            <line x1={cx - cap} y1={yBot} x2={cx + cap} y2={yBot}
                  stroke={t.ink} strokeWidth={3} strokeOpacity={0.7} strokeLinecap="round" />
          </g>
        );
      })}
    </g>
  );
}

export default function Chart() {
  const W = window.ANYPLOT_SIZE.width;
  const H = window.ANYPLOT_SIZE.height;

  const title = "Seedling Growth Under Stress · errorbar-basic · javascript · muix · anyplot.ai";
  const titleSize = title.length > 67 ? Math.round(22 * 67 / title.length) : 22;

  return (
    <ChartContainer
      width={W}
      height={H}
      series={[{
        type: "bar",
        data: MEANS,
        id: "growth",
        label: "Mean Stem Elongation (cm/week)",
        xAxisId: "x",
        yAxisId: "y",
      }]}
      xAxis={[{
        id: "x",
        scaleType: "band",
        data: CONDITIONS,
        colorMap: {
          type: "ordinal",
          values: CONDITIONS,
          colors: BAR_COLORS,
        },
      }]}
      yAxis={[{
        id: "y",
        min: 0,
        max: 6,
      }]}
      margin={{ top: 72, bottom: 92, left: 100, right: 100 }}
    >
      <ChartsGrid horizontal />
      <BarPlot skipAnimation borderRadius={4} />
      <ErrorBars />
      <ChartsReferenceLine
        y={MEANS[0]}
        axisId="y"
        label="Control baseline"
        labelAlign="end"
        lineStyle={{ stroke: t.inkSoft, strokeDasharray: "6 4", strokeWidth: 1.5 }}
        labelStyle={{ fontSize: 13, fill: t.inkSoft, fontStyle: "italic" }}
      />
      <ChartsXAxis
        axisId="x"
        label="Growth Condition"
        labelStyle={{ fontSize: 16 }}
        tickLabelStyle={{ fontSize: 14 }}
      />
      <ChartsYAxis
        axisId="y"
        label="Mean Stem Elongation (cm / week)"
        labelStyle={{ fontSize: 16 }}
        tickLabelStyle={{ fontSize: 14 }}
      />
      <text
        x={W / 2}
        y={36}
        textAnchor="middle"
        dominantBaseline="middle"
        fontSize={titleSize}
        fontWeight={600}
        fill={t.ink}
        fontFamily="-apple-system, BlinkMacSystemFont, 'Segoe UI', Roboto, Helvetica, Arial, sans-serif"
      >
        {title}
      </text>
    </ChartContainer>
  );
}
Runnable source as JSON, for any HTTP client: https://api.anyplot.ai/specs/errorbar-basic/muix/code. Any spec id and library id listed in llms-full.txt fit the same URL shape; every URL below is complete and callable.
{
  "spec_id": "errorbar-basic",
  "language": "javascript",
  "library": "muix",
  "page": "https://anyplot.ai/errorbar-basic/javascript/muix",
  "hub": "https://anyplot.ai/errorbar-basic",
  "code_json": "https://api.anyplot.ai/specs/errorbar-basic/muix/code",
  "spec_json": "https://api.anyplot.ai/specs/errorbar-basic",
  "render_light_png": "https://storage.googleapis.com/anyplot-images/plots/errorbar-basic/javascript/muix/plot-light.png",
  "render_dark_png": "https://storage.googleapis.com/anyplot-images/plots/errorbar-basic/javascript/muix/plot-dark.png",
  "interactive_light_html": "https://storage.googleapis.com/anyplot-images/plots/errorbar-basic/javascript/muix/plot-light.html",
  "interactive_dark_html": "https://storage.googleapis.com/anyplot-images/plots/errorbar-basic/javascript/muix/plot-dark.html",
  "quality_score": 88.0,
  "license": "MIT",
  "guide": "https://anyplot.ai/llms.txt"
}
Part of Basic Error Bar Plot on anyplot.ai.