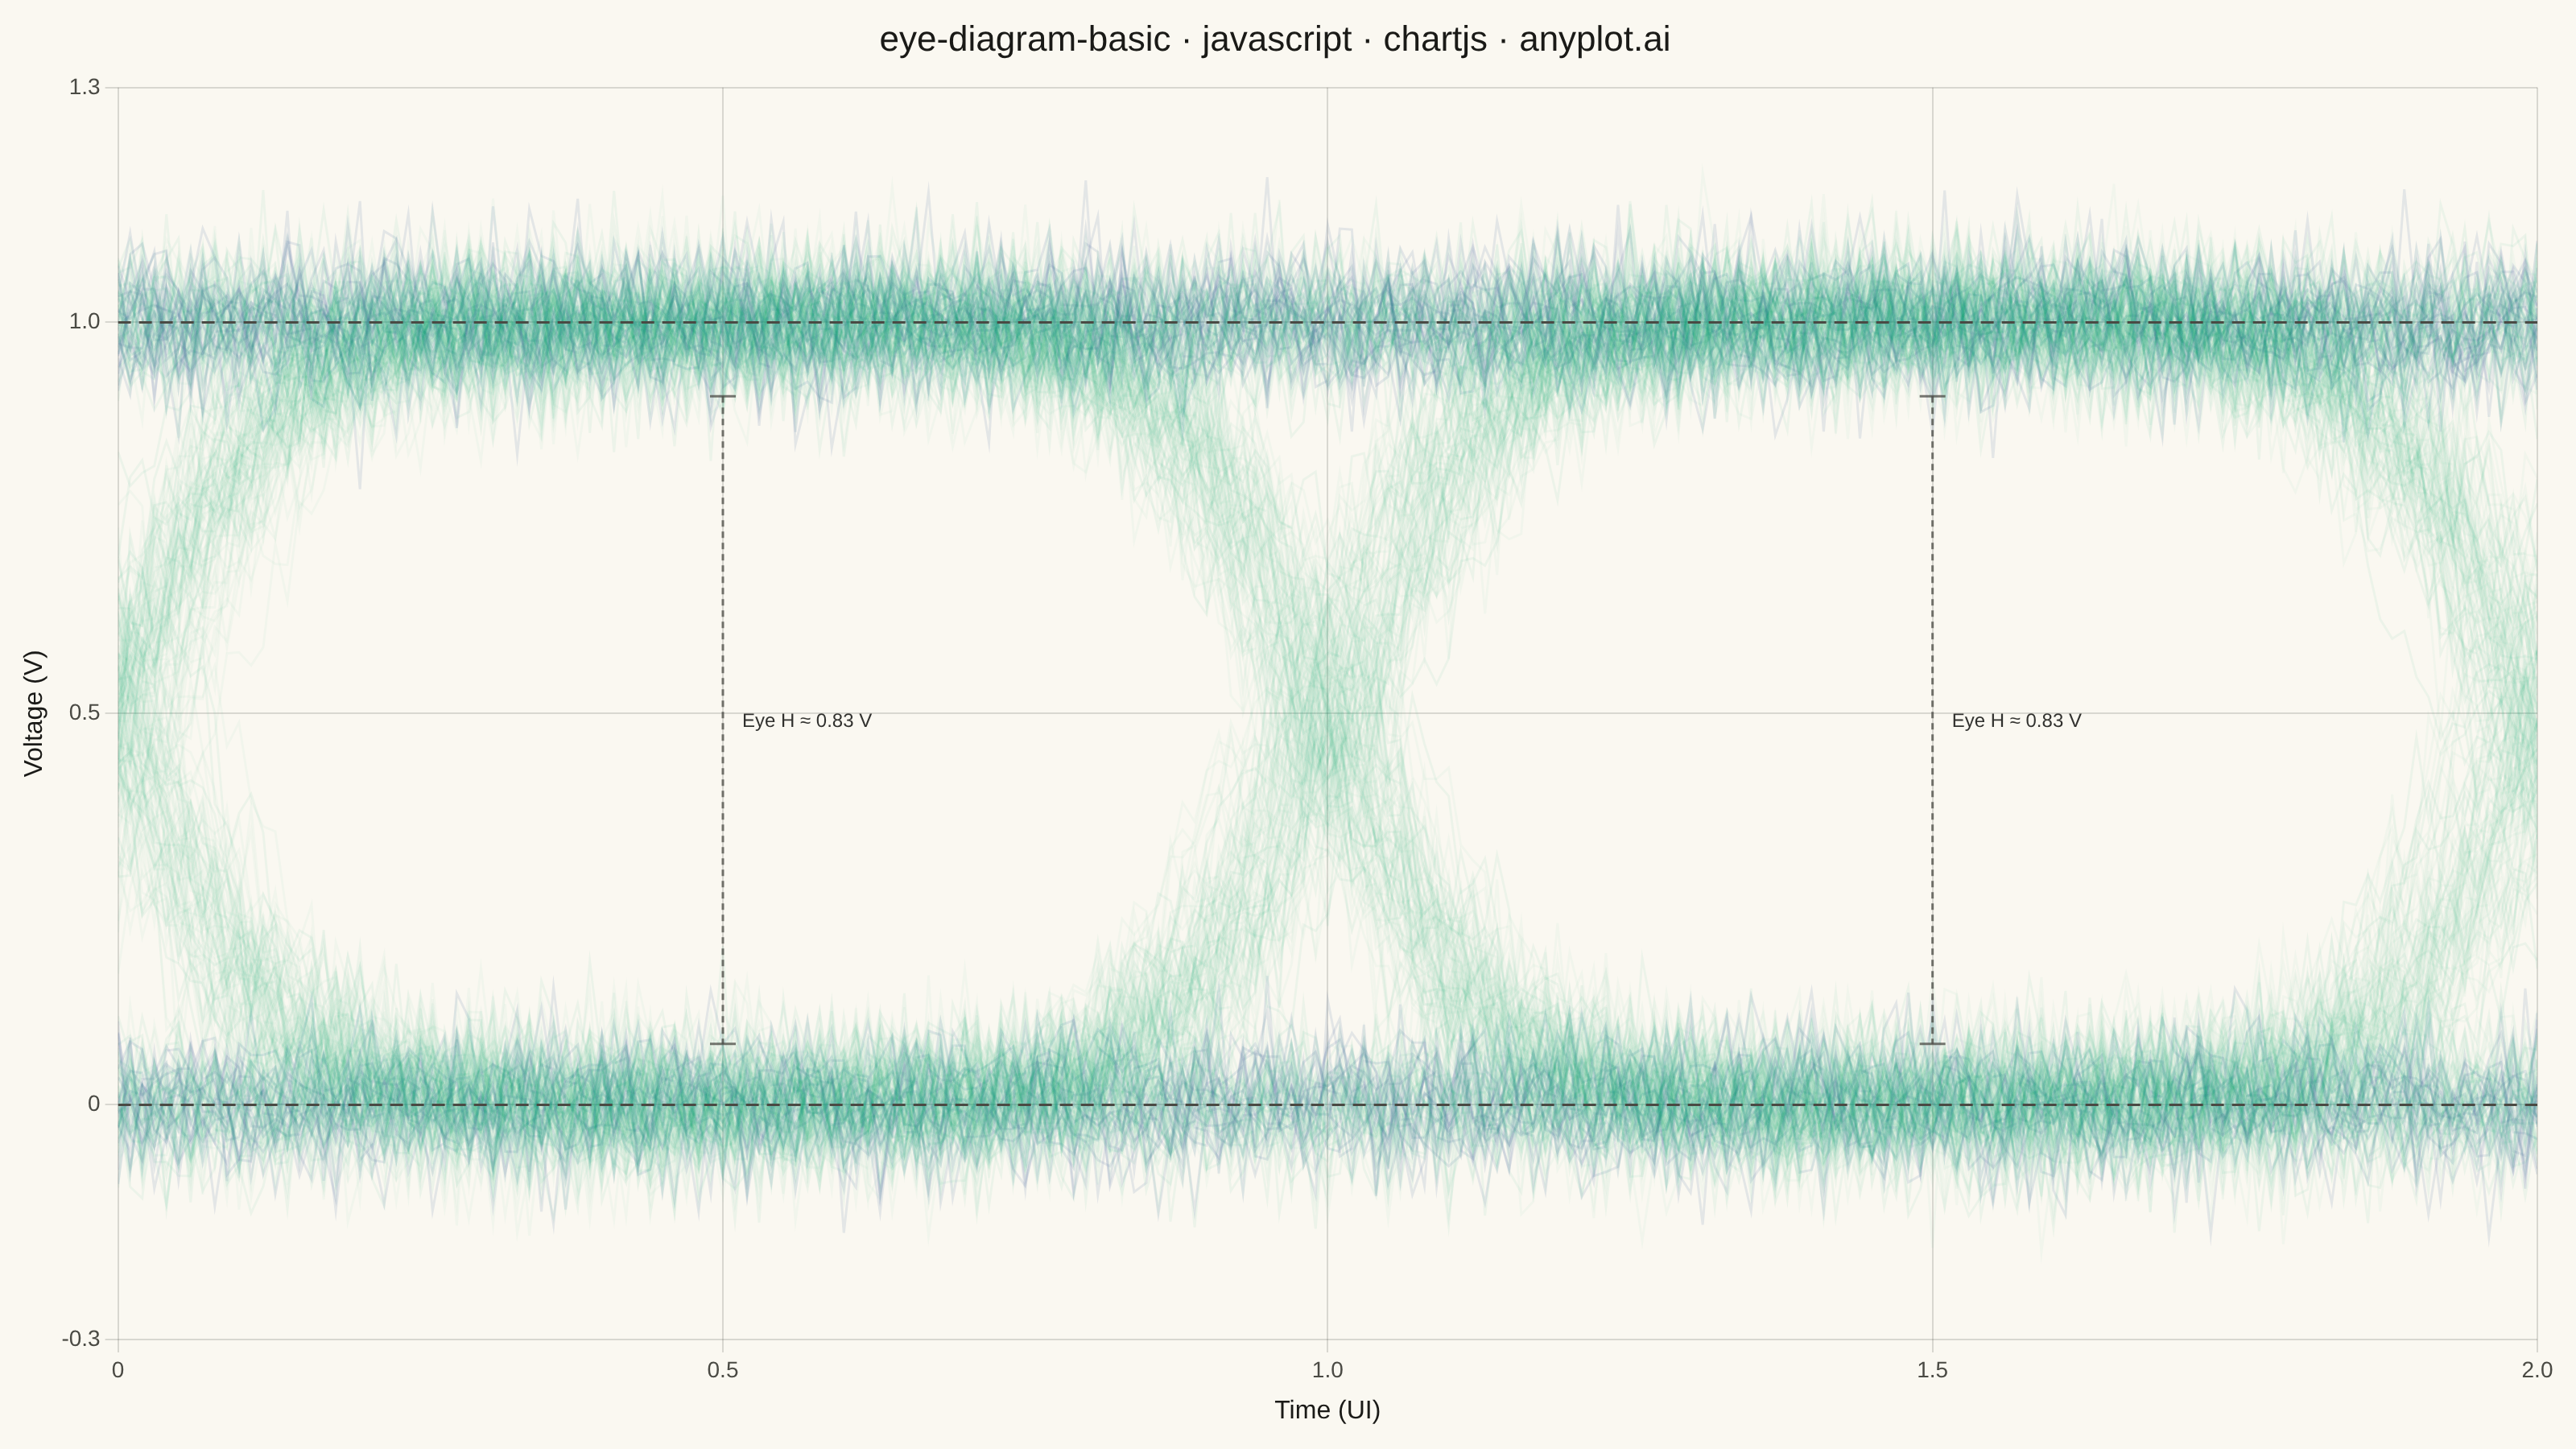
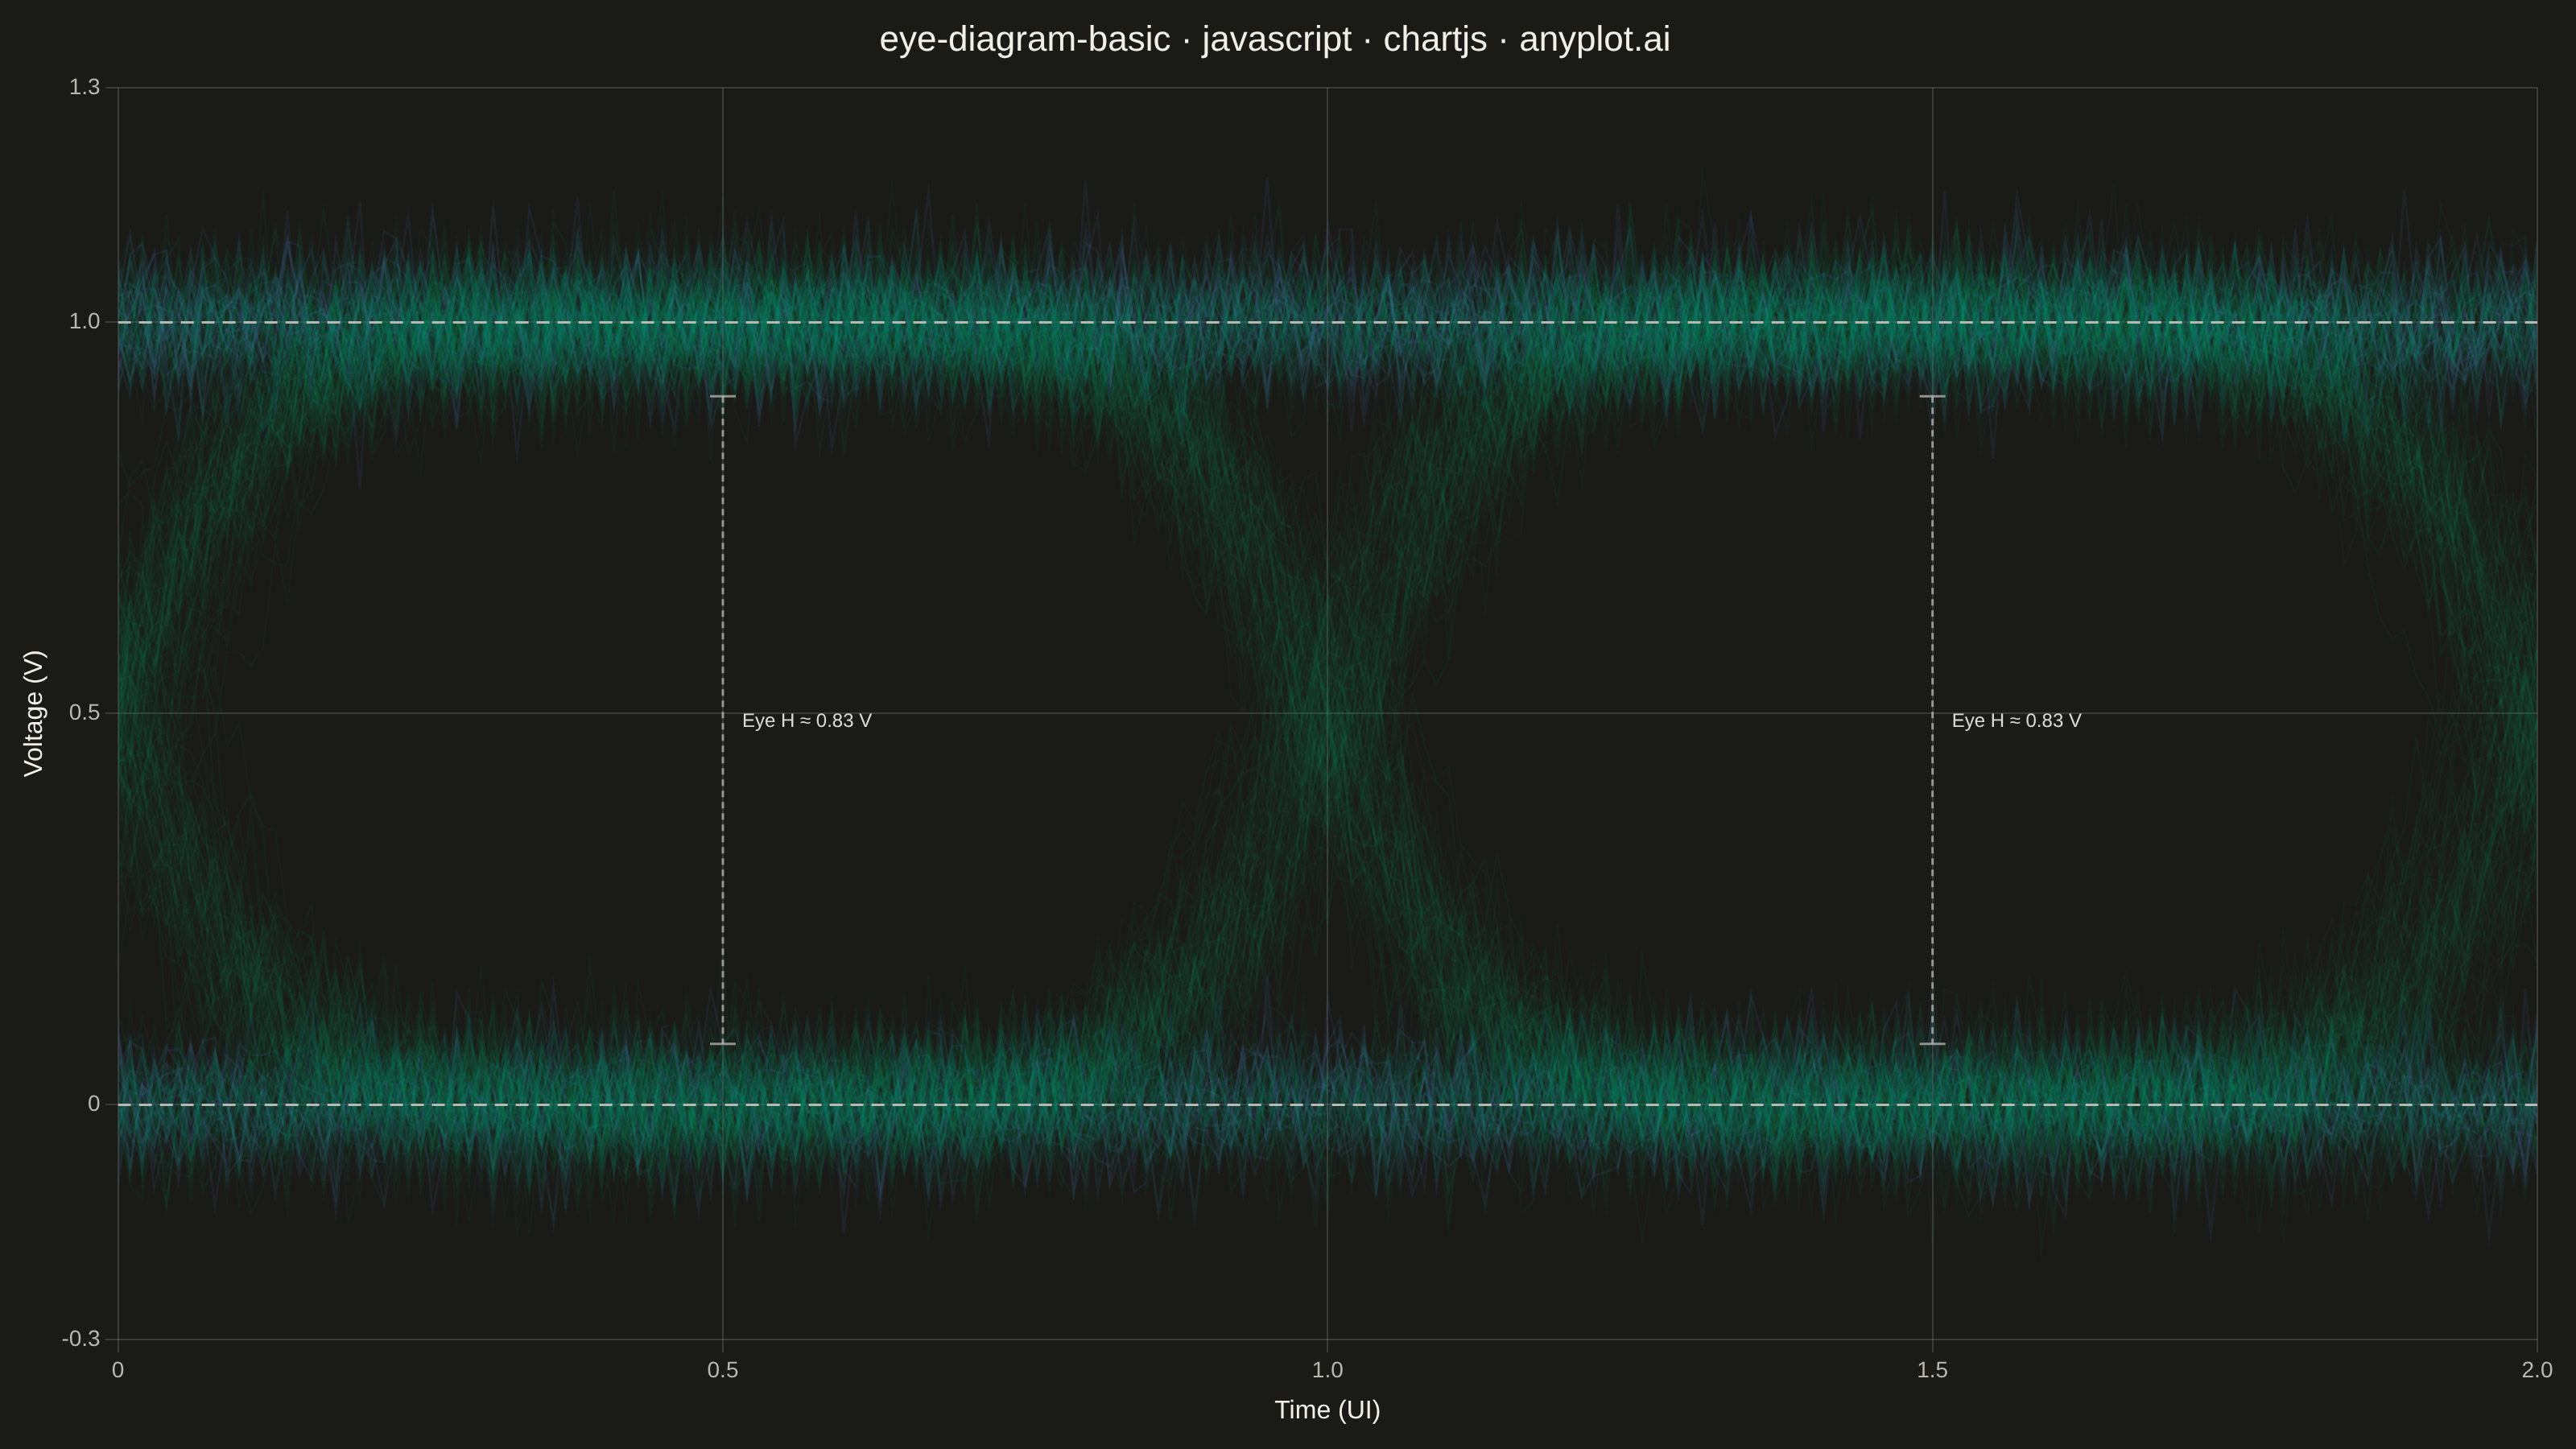
An eye diagram visualizes signal integrity by overlaying many periods of a digital signal onto a single time window spanning 1-2 unit intervals (UI). The overlapping traces form a characteristic eye-shaped opening whose height, width, and clarity reveal signal quality metrics such as jitter, noise, and inter-symbol interference (ISI). A wide-open eye indicates clean signal transmission, while a closed or blurred eye signals degradation.
// anyplot.ai
// eye-diagram-basic: Signal Integrity Eye Diagram
// Library: chartjs 4.4.7 | JavaScript 22.22.3
// Quality: 90/100 | Created: 2026-06-18

//# anyplot-orientation: landscape
const t = window.ANYPLOT_TOKENS;

// Deterministic LCG — no seeded Math.random in the browser
let _s = 42;
function rand() {
  _s = (_s * 1664525 + 1013904223) >>> 0;
  return _s / 4294967296;
}

// Box-Muller transform for Gaussian samples
function randn() {
  const u = Math.max(rand(), 1e-12);
  return Math.sqrt(-2 * Math.log(u)) * Math.cos(2 * Math.PI * rand());
}

// Bandwidth-limited sigmoid transition (models realistic rise/fall)
function sigmoid(x) {
  return 1 / (1 + Math.exp(-x));
}

const NUM_TRACES = 300;
const SAMPLES_PER_UI = 100;
const NOISE_SIGMA = 0.05;
const JITTER_SIGMA = 0.03;
const BW = 15;

// Dashed reference lines at nominal NRZ bit levels (0 V and 1 V)
const refLine = (yVal) => ({
  data: [{ x: 0, y: yVal }, { x: 2, y: yVal }],
  borderColor: t.inkSoft,
  borderWidth: 1.5,
  borderDash: [8, 5],
  pointRadius: 0,
  fill: false,
  tension: 0,
});

// Generate all 300 NRZ traces and tag each with its bit-transition count.
// Transition count determines density tier for the color ramp:
//   0 transitions = trace always at 0 V or 1 V rail (highest local density) → t.seq[1] blue
//   1 transition  = one level crossing (moderate density)                   → palette[0] green mid-alpha
//   2-3 transitions = frequent crossing (lower point density)               → palette[0] green low-alpha
const rawTraces = [];
for (let tr = 0; tr < NUM_TRACES; tr++) {
  const b = [rand(), rand(), rand(), rand()].map(v => (v > 0.5 ? 1 : 0));
  const j = [randn() * JITTER_SIGMA, randn() * JITTER_SIGMA, randn() * JITTER_SIGMA];
  const nTrans = Math.abs(b[1] - b[0]) + Math.abs(b[2] - b[1]) + Math.abs(b[3] - b[2]);

  const pts = [];
  for (let i = 0; i <= SAMPLES_PER_UI * 2; i++) {
    const time = i / SAMPLES_PER_UI;
    let v = b[0];
    v += (b[1] - b[0]) * sigmoid(BW * (time - j[0]));
    v += (b[2] - b[1]) * sigmoid(BW * (time - 1 - j[1]));
    v += (b[3] - b[2]) * sigmoid(BW * (time - 2 - j[2]));
    v += randn() * NOISE_SIGMA;
    pts.push({ x: time, y: v });
  }
  rawTraces.push({ pts, nTrans });
}

// Measure eye opening at t = 0.5 UI (first sampling point, pts index 50).
// 5th percentile of the 1 V group − 95th percentile of the 0 V group = practical eye height.
const voltagesAt05 = rawTraces.map(({ pts }) => pts[50].y);
const lowRailVs = voltagesAt05.filter(v => v < 0.5).sort((a, b) => a - b);
const highRailVs = voltagesAt05.filter(v => v >= 0.5).sort((a, b) => a - b);
const eyeLow  = lowRailVs[Math.floor(lowRailVs.length * 0.95)]  ?? 0.1;
const eyeHigh = highRailVs[Math.floor(highRailVs.length * 0.05)] ?? 0.9;
const eyeHeightVal = Math.max(0, eyeHigh - eyeLow);

// Sort traces: high-transition (sparse, background) first → stable rail (dense) last.
// This ensures dense rail regions accumulate the blue t.seq[1] color on top of the green base.
rawTraces.sort((ra, rb) => rb.nTrans - ra.nTrans);

// Density-to-color ramp: green (sparse) → blue (dense rail regions).
// Stable traces (0 transitions) rendered last in t.seq[1] to accent high-density rails.
const traceDatasets = rawTraces.map(({ pts, nTrans }) => {
  const color = nTrans === 0 ? t.seq[1] + "20"       // #4467A3 ~12.5% alpha — stable rail (dense)
              : nTrans === 1 ? t.palette[0] + "0e"   // #009E73 ~5.5% alpha — one crossing
              :                t.palette[0] + "09";  // #009E73 ~3.5% alpha — frequent crossing
  return { data: pts, borderColor: color, borderWidth: 1.5, pointRadius: 0, fill: false, tension: 0 };
});

// afterDraw plugin: bracket annotations marking eye height at both sampling points (t = 0.5 and 1.5 UI).
// Demonstrates Chart.js's custom plugin API; fulfills the spec's optional eye-metrics annotation.
const eyeAnnotationPlugin = {
  id: "eyeAnnotation",
  afterDraw(chart) {
    const ctx = chart.ctx;
    const xs = chart.scales.x;
    const ys = chart.scales.y;
    // Canvas y-coordinates: yTop < yBot because pixel origin is top-left
    const yTop = ys.getPixelForValue(eyeHigh); // bottom edge of 1 V rail (high on screen)
    const yBot = ys.getPixelForValue(eyeLow);  // top edge of 0 V rail (low on screen)
    const tick = 8; // px half-width of bracket crossbars

    ctx.save();
    ctx.globalAlpha = 0.75;
    ctx.strokeStyle = t.inkSoft;
    ctx.lineWidth = 1.5;

    [0.5, 1.5].forEach(tUI => {
      const xC = xs.getPixelForValue(tUI);
      // Dashed vertical span
      ctx.setLineDash([4, 3]);
      ctx.beginPath(); ctx.moveTo(xC, yTop); ctx.lineTo(xC, yBot); ctx.stroke();
      // Solid horizontal crossbars
      ctx.setLineDash([]);
      ctx.beginPath(); ctx.moveTo(xC - tick, yTop); ctx.lineTo(xC + tick, yTop); ctx.stroke();
      ctx.beginPath(); ctx.moveTo(xC - tick, yBot); ctx.lineTo(xC + tick, yBot); ctx.stroke();
    });

    ctx.setLineDash([]);
    ctx.globalAlpha = 0.90;
    ctx.fillStyle = t.ink;
    ctx.font = "500 12px sans-serif";
    ctx.textAlign = "left";
    const label = `Eye H ≈ ${eyeHeightVal.toFixed(2)} V`;
    [0.5, 1.5].forEach(tUI => {
      const xC = xs.getPixelForValue(tUI);
      ctx.fillText(label, xC + tick + 4, (yTop + yBot) / 2 + 4);
    });

    ctx.restore();
  },
};

// Mount
const canvas = document.createElement("canvas");
document.getElementById("container").appendChild(canvas);

// Chart
new Chart(canvas, {
  type: "line",
  data: {
    datasets: [refLine(0), refLine(1), ...traceDatasets],
  },
  plugins: [eyeAnnotationPlugin],
  options: {
    responsive: true,
    maintainAspectRatio: false,
    animation: false,
    parsing: false,
    layout: { padding: { top: 4, right: 24, bottom: 10, left: 8 } },
    plugins: {
      title: {
        display: true,
        text: "eye-diagram-basic · javascript · chartjs · anyplot.ai",
        color: t.ink,
        font: { size: 22, weight: "500" },
        padding: { top: 8, bottom: 16 },
      },
      legend: { display: false },
      tooltip: { enabled: false },
    },
    scales: {
      x: {
        type: "linear",
        min: 0,
        max: 2,
        title: {
          display: true,
          text: "Time (UI)",
          color: t.ink,
          font: { size: 16, weight: "500" },
        },
        ticks: {
          color: t.inkSoft,
          font: { size: 14 },
          stepSize: 0.5,
        },
        grid: { color: t.grid },
        border: { display: false },
      },
      y: {
        min: -0.3,
        max: 1.3,
        title: {
          display: true,
          text: "Voltage (V)",
          color: t.ink,
          font: { size: 16, weight: "500" },
        },
        ticks: {
          color: t.inkSoft,
          font: { size: 14 },
          stepSize: 0.5,
        },
        grid: { color: t.grid },
        border: { display: false },
      },
    },
  },
});
Runnable source as JSON, for any HTTP client: https://api.anyplot.ai/specs/eye-diagram-basic/chartjs/code. Any spec id and library id listed in llms-full.txt fit the same URL shape; every URL below is complete and callable.
{
  "spec_id": "eye-diagram-basic",
  "language": "javascript",
  "library": "chartjs",
  "page": "https://anyplot.ai/eye-diagram-basic/javascript/chartjs",
  "hub": "https://anyplot.ai/eye-diagram-basic",
  "code_json": "https://api.anyplot.ai/specs/eye-diagram-basic/chartjs/code",
  "spec_json": "https://api.anyplot.ai/specs/eye-diagram-basic",
  "render_light_png": "https://storage.googleapis.com/anyplot-images/plots/eye-diagram-basic/javascript/chartjs/plot-light.png",
  "render_dark_png": "https://storage.googleapis.com/anyplot-images/plots/eye-diagram-basic/javascript/chartjs/plot-dark.png",
  "interactive_light_html": "https://storage.googleapis.com/anyplot-images/plots/eye-diagram-basic/javascript/chartjs/plot-light.html",
  "interactive_dark_html": "https://storage.googleapis.com/anyplot-images/plots/eye-diagram-basic/javascript/chartjs/plot-dark.html",
  "quality_score": 90.0,
  "license": "MIT",
  "guide": "https://anyplot.ai/llms.txt"
}
Part of Signal Integrity Eye Diagram on anyplot.ai.