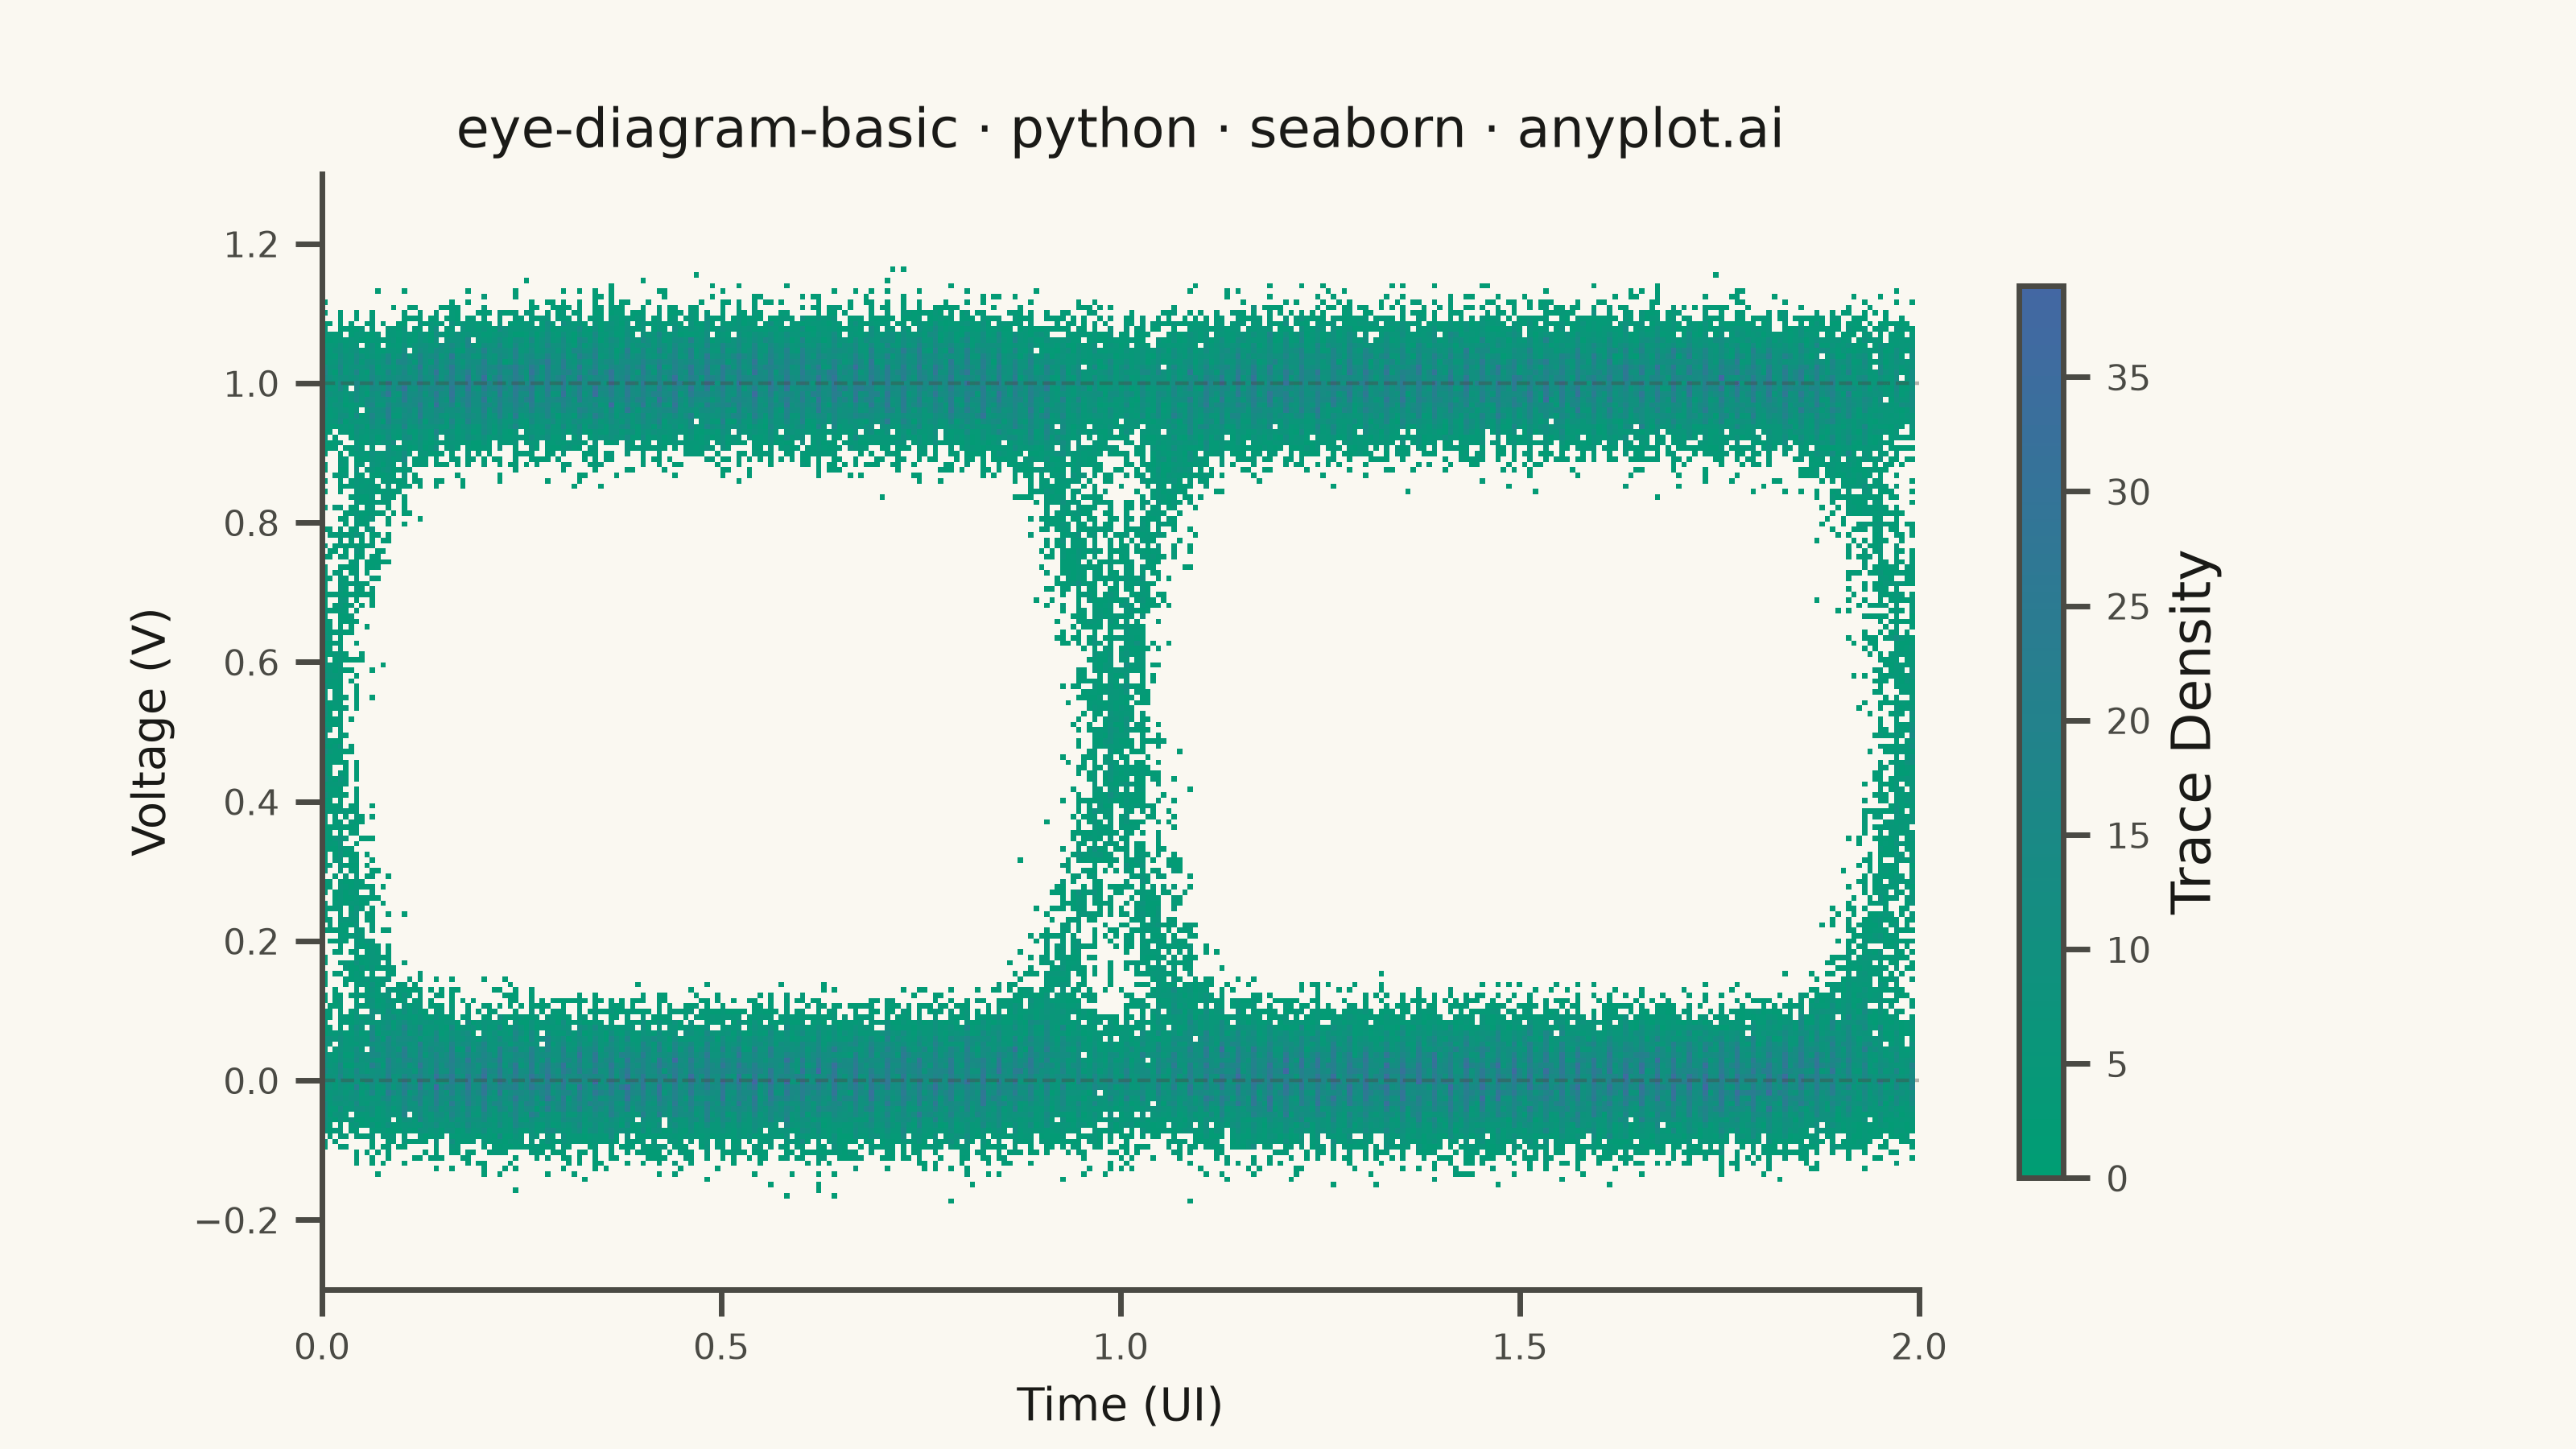
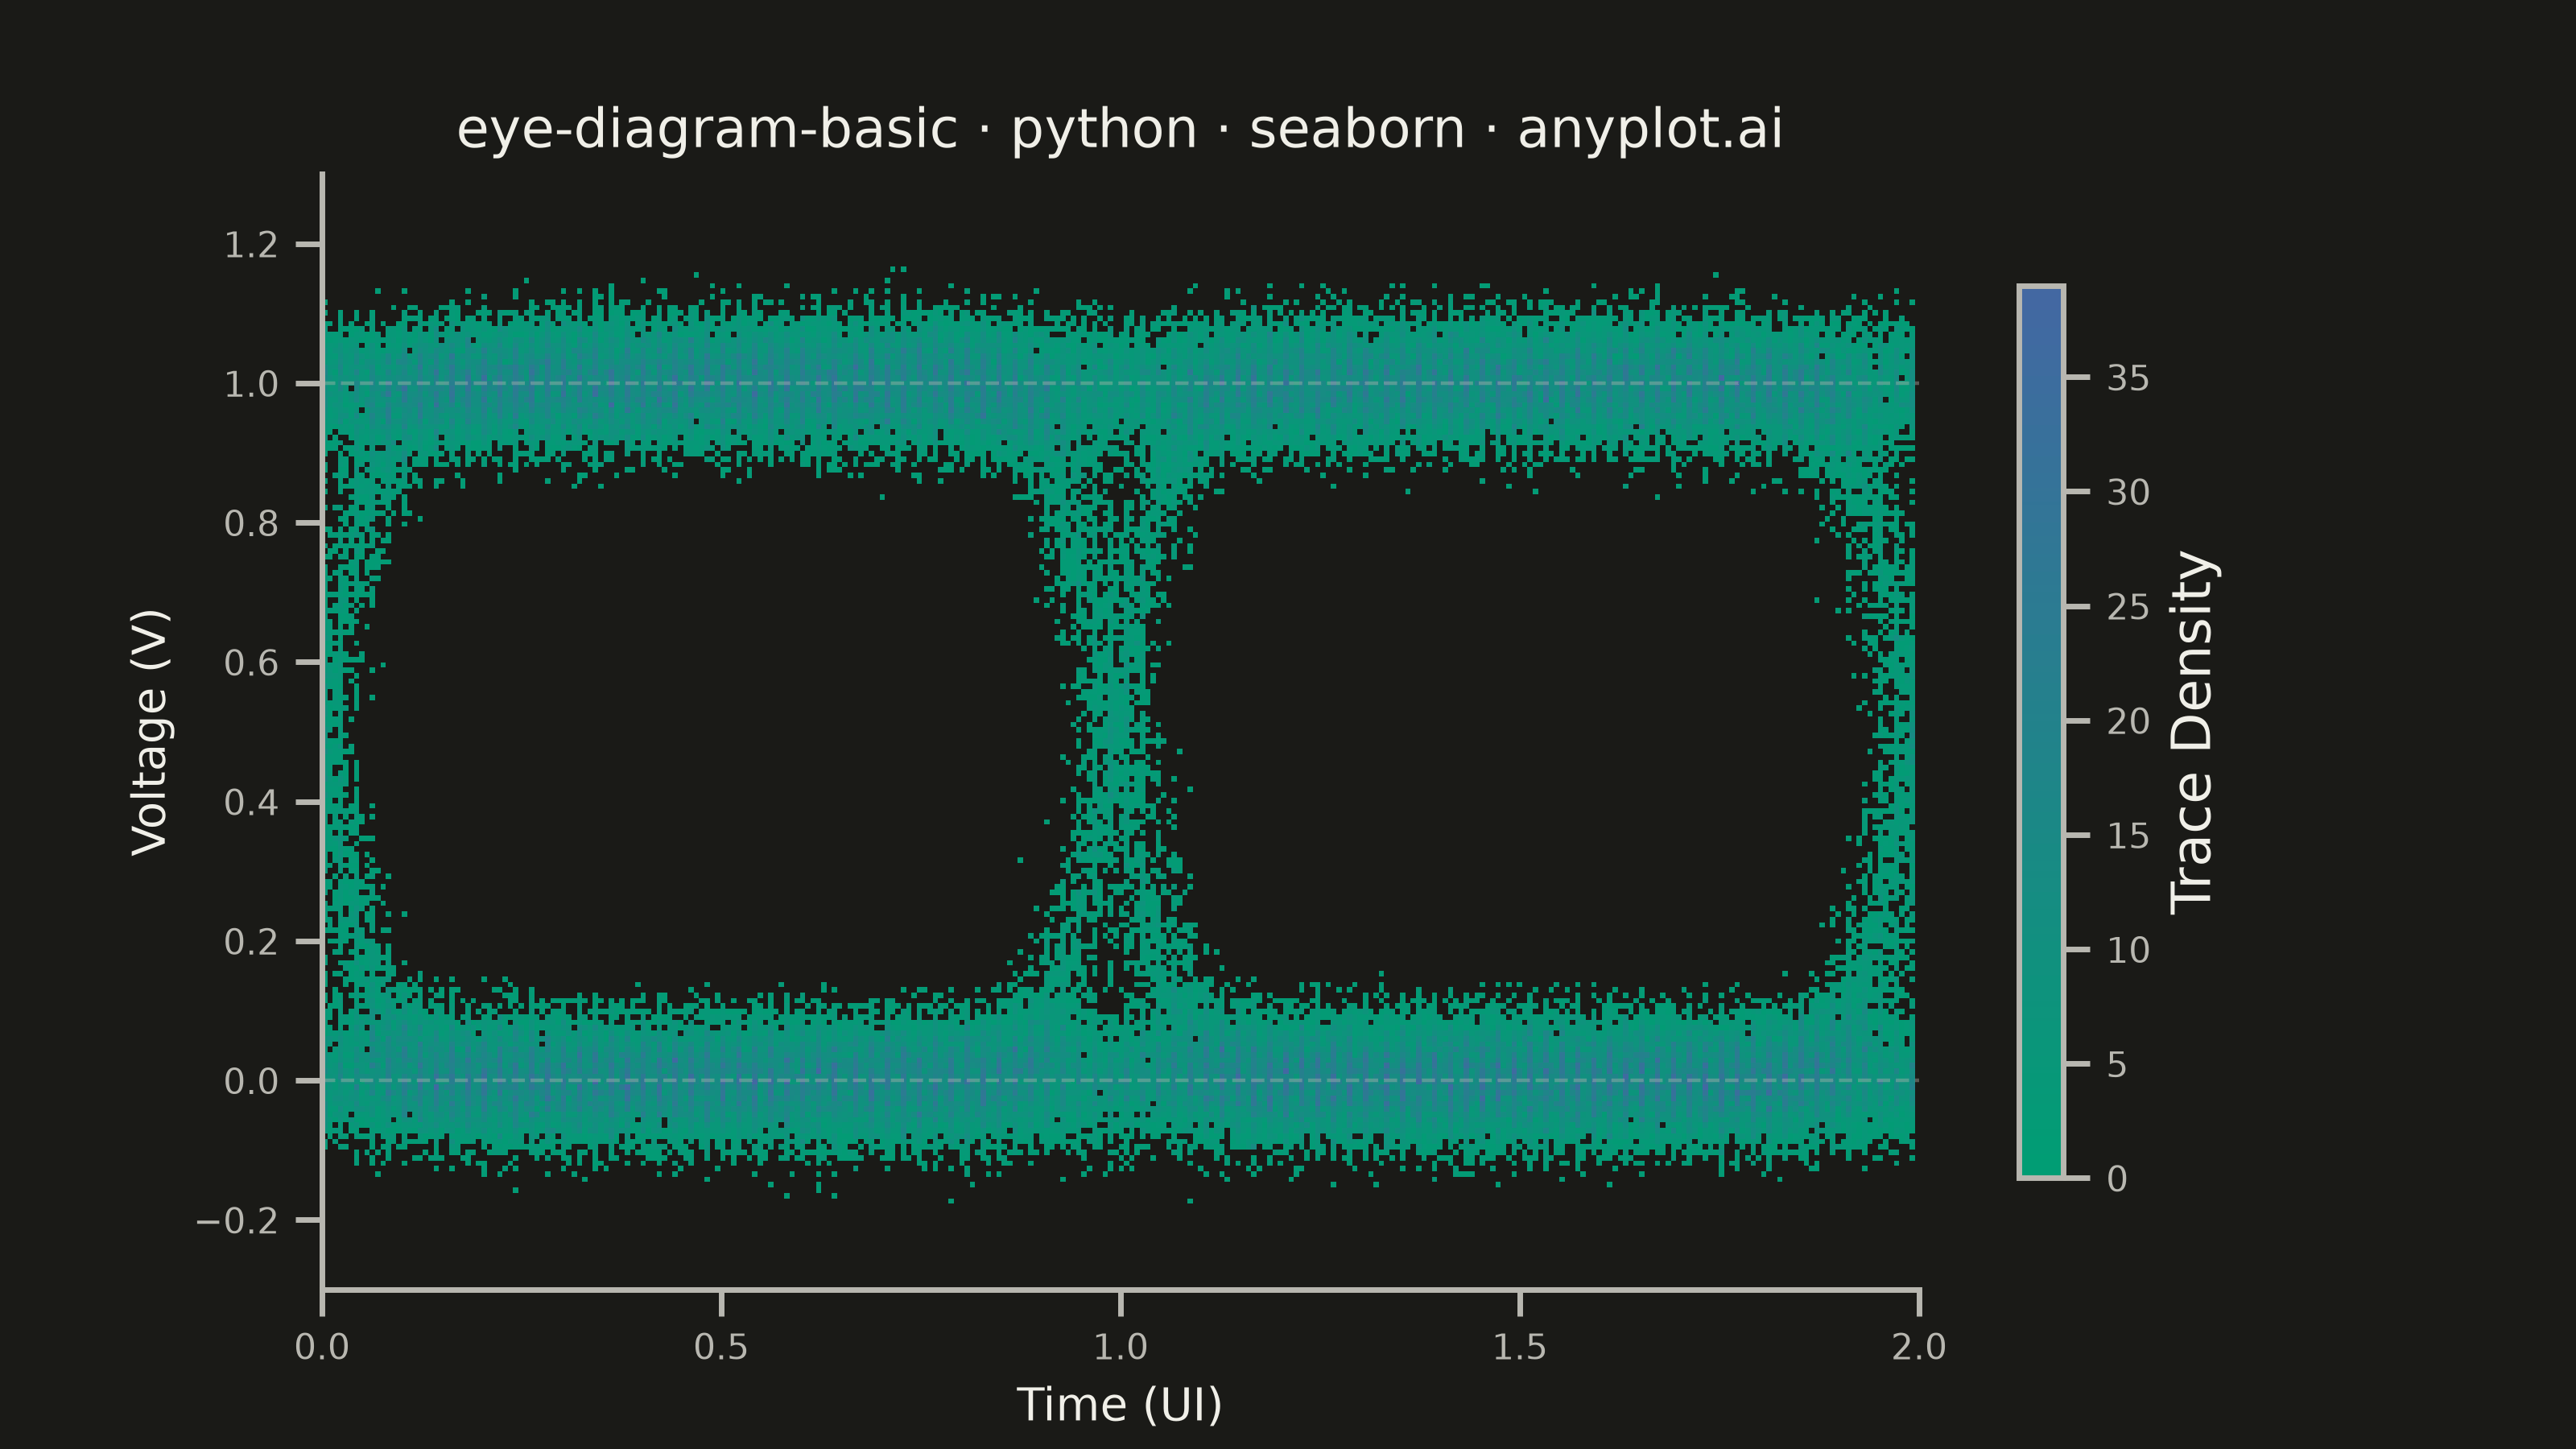
An eye diagram visualizes signal integrity by overlaying many periods of a digital signal onto a single time window spanning 1-2 unit intervals (UI). The overlapping traces form a characteristic eye-shaped opening whose height, width, and clarity reveal signal quality metrics such as jitter, noise, and inter-symbol interference (ISI). A wide-open eye indicates clean signal transmission, while a closed or blurred eye signals degradation.
""" anyplot.ai
eye-diagram-basic: Signal Integrity Eye Diagram
Library: seaborn 0.13.2 | Python 3.13.14
Quality: 88/100 | Updated: 2026-06-18
"""

import os

import matplotlib.pyplot as plt
import numpy as np
import pandas as pd
import seaborn as sns
from matplotlib.colors import LinearSegmentedColormap
from matplotlib.patches import Rectangle
from scipy.ndimage import gaussian_filter1d


# Theme tokens — Imprint palette chrome
THEME = os.getenv("ANYPLOT_THEME", "light")
PAGE_BG = "#FAF8F1" if THEME == "light" else "#1A1A17"
ELEVATED_BG = "#FFFDF6" if THEME == "light" else "#242420"
INK = "#1A1A17" if THEME == "light" else "#F0EFE8"
INK_SOFT = "#4A4A44" if THEME == "light" else "#B8B7B0"
ANYPLOT_AMBER = "#DDCC77"

# Seaborn theme — warm cream/near-black surfaces with Imprint chrome
sns.set_theme(
    style="ticks",
    rc={
        "figure.facecolor": PAGE_BG,
        "axes.facecolor": PAGE_BG,
        "axes.edgecolor": INK_SOFT,
        "axes.labelcolor": INK,
        "text.color": INK,
        "xtick.color": INK_SOFT,
        "ytick.color": INK_SOFT,
        "grid.color": INK,
        "grid.alpha": 0.15,
        "legend.facecolor": ELEVATED_BG,
        "legend.edgecolor": INK_SOFT,
    },
)

# Imprint sequential colormap — green → blue for trace density
imprint_seq = LinearSegmentedColormap.from_list("imprint_seq", ["#009E73", "#4467A3"])

# Data — NRZ signal with bandwidth-limited transitions, jitter, and noise
np.random.seed(42)
n_traces = 400
samples_per_ui = 200
ui_span = 2
n_display = samples_per_ui * ui_span
noise_sigma = 0.05
jitter_sigma = 0.03
bw_filter_sigma = 12

all_time = []
all_voltage = []
t_ui = np.linspace(0, ui_span, n_display, endpoint=False)

for _ in range(n_traces):
    n_bits = 8
    bits = np.random.randint(0, 2, size=n_bits)
    samples_total = samples_per_ui * n_bits

    signal_raw = np.repeat(bits.astype(float), samples_per_ui)
    signal_smooth = gaussian_filter1d(signal_raw, sigma=bw_filter_sigma)

    jitter_shift = int(np.random.normal(0, jitter_sigma * samples_per_ui))
    signal_smooth = np.roll(signal_smooth, jitter_shift)
    signal_smooth += np.random.normal(0, noise_sigma, samples_total)

    start_bit = 3
    start_idx = start_bit * samples_per_ui
    end_idx = start_idx + n_display
    segment = signal_smooth[start_idx:end_idx]

    all_time.extend(t_ui.tolist())
    all_voltage.extend(segment.tolist())

df = pd.DataFrame({"time": all_time, "voltage": all_voltage})

# Eye measurements — first eye center at t ≈ 0.5 UI (between transitions at t=0 and t=1)
eye_center_t = 0.5
center_mask = (df["time"] >= 0.35) & (df["time"] <= 0.65)
center_v = df.loc[center_mask, "voltage"]
logic0_center = center_v[center_v < 0.5]
logic1_center = center_v[center_v >= 0.5]
eye_floor = float(np.percentile(logic0_center, 99))
eye_ceiling = float(np.percentile(logic1_center, 1))
eye_height_v = max(eye_ceiling - eye_floor, 0.01)

# Eye width: find the transition-free horizontal zone at mid-voltage
n_tbins = 200
bins_time = np.linspace(0, 2, n_tbins + 1)
bin_centers = (bins_time[:-1] + bins_time[1:]) / 2
near_threshold = (df["voltage"] > 0.3) & (df["voltage"] < 0.7)
crossing_hist, _ = np.histogram(df.loc[near_threshold, "time"], bins=bins_time)
in_eye = crossing_hist < crossing_hist.max() * 0.08
center_bin = int(np.argmin(np.abs(bin_centers - eye_center_t)))
left = center_bin
right = center_bin
while left > 0 and in_eye[left - 1]:
    left -= 1
while right < len(in_eye) - 1 and in_eye[right + 1]:
    right += 1
eye_t_left = float(bin_centers[left])
eye_t_right = float(bin_centers[right])
eye_width_ui = max(eye_t_right - eye_t_left, 0.01)
eye_mid_t = (eye_t_left + eye_t_right) / 2

# Plot
fig, ax = plt.subplots(figsize=(8, 4.5), dpi=400)

# Seaborn 2D histogram — density heatmap; thresh=1 makes zero-count bins transparent
sns.histplot(
    data=df,
    x="time",
    y="voltage",
    bins=[300, 180],
    stat="count",
    thresh=1,
    cbar=True,
    cbar_kws={"label": "Trace Density", "shrink": 0.8},
    cmap=imprint_seq,
    ax=ax,
)

# NRZ reference levels — labeled for engineering context
ax.axhline(y=0.0, color=INK_SOFT, linewidth=0.8, linestyle="--", alpha=0.4)
ax.axhline(y=1.0, color=INK_SOFT, linewidth=0.8, linestyle="--", alpha=0.4)
ax.text(1.93, 0.04, "Logic 0", fontsize=7, color=INK_SOFT, va="bottom", ha="right")
ax.text(1.93, 0.96, "Logic 1", fontsize=7, color=INK_SOFT, va="top", ha="right")

# Eye opening outline — dashed rectangle highlights the clear region
eye_rect = Rectangle(
    (eye_t_left, eye_floor),
    eye_width_ui,
    eye_height_v,
    linewidth=0.9,
    edgecolor=ANYPLOT_AMBER,
    facecolor="none",
    linestyle="--",
    alpha=0.8,
)
ax.add_patch(eye_rect)

# Eye height annotation — vertical double arrow at eye center
ax.annotate(
    "",
    xy=(eye_mid_t, eye_floor),
    xytext=(eye_mid_t, eye_ceiling),
    arrowprops={"arrowstyle": "<->", "color": ANYPLOT_AMBER, "lw": 1.0},
)
ax.text(
    eye_mid_t + 0.03,
    (eye_floor + eye_ceiling) / 2,
    f"H: {eye_height_v:.2f} V",
    fontsize=6.5,
    color=ANYPLOT_AMBER,
    va="center",
    ha="left",
)

# Eye width annotation — horizontal double arrow at mid-eye
v_arrow = eye_floor + eye_height_v * 0.28
ax.annotate(
    "",
    xy=(eye_t_left, v_arrow),
    xytext=(eye_t_right, v_arrow),
    arrowprops={"arrowstyle": "<->", "color": ANYPLOT_AMBER, "lw": 1.0},
)
ax.text(
    eye_mid_t, v_arrow - 0.06, f"W: {eye_width_ui:.2f} UI", fontsize=6.5, color=ANYPLOT_AMBER, va="top", ha="center"
)

ax.set_xlim(0, 2)
ax.set_ylim(-0.3, 1.3)
ax.set_xticks([0, 0.5, 1.0, 1.5, 2.0])

# Style
title = "eye-diagram-basic · python · seaborn · anyplot.ai"
ax.set_title(title, fontsize=12, fontweight="medium", color=INK)
ax.set_xlabel("Time (UI)", fontsize=10, color=INK)
ax.set_ylabel("Voltage (V)", fontsize=10, color=INK)
ax.tick_params(axis="both", labelsize=8, colors=INK_SOFT)

sns.despine(ax=ax, top=True, right=True)

# Style colorbar text
if len(fig.axes) > 1:
    cbar_ax = fig.axes[-1]
    cbar_ax.tick_params(colors=INK_SOFT, labelsize=8)
    cbar_ax.yaxis.label.set_color(INK)
    for spine in cbar_ax.spines.values():
        spine.set_color(INK_SOFT)

# Save
plt.savefig(f"plot-{THEME}.png", dpi=400, facecolor=PAGE_BG)
plt.close()
Runnable source as JSON, for any HTTP client: https://api.anyplot.ai/specs/eye-diagram-basic/seaborn/code. Any spec id and library id listed in llms-full.txt fit the same URL shape; every URL below is complete and callable.
{
  "spec_id": "eye-diagram-basic",
  "language": "python",
  "library": "seaborn",
  "page": "https://anyplot.ai/eye-diagram-basic/python/seaborn",
  "hub": "https://anyplot.ai/eye-diagram-basic",
  "code_json": "https://api.anyplot.ai/specs/eye-diagram-basic/seaborn/code",
  "spec_json": "https://api.anyplot.ai/specs/eye-diagram-basic",
  "render_light_png": "https://storage.googleapis.com/anyplot-images/plots/eye-diagram-basic/python/seaborn/plot-light.png",
  "render_dark_png": "https://storage.googleapis.com/anyplot-images/plots/eye-diagram-basic/python/seaborn/plot-dark.png",
  "quality_score": 88.0,
  "license": "MIT",
  "guide": "https://anyplot.ai/llms.txt"
}
Part of Signal Integrity Eye Diagram on anyplot.ai.