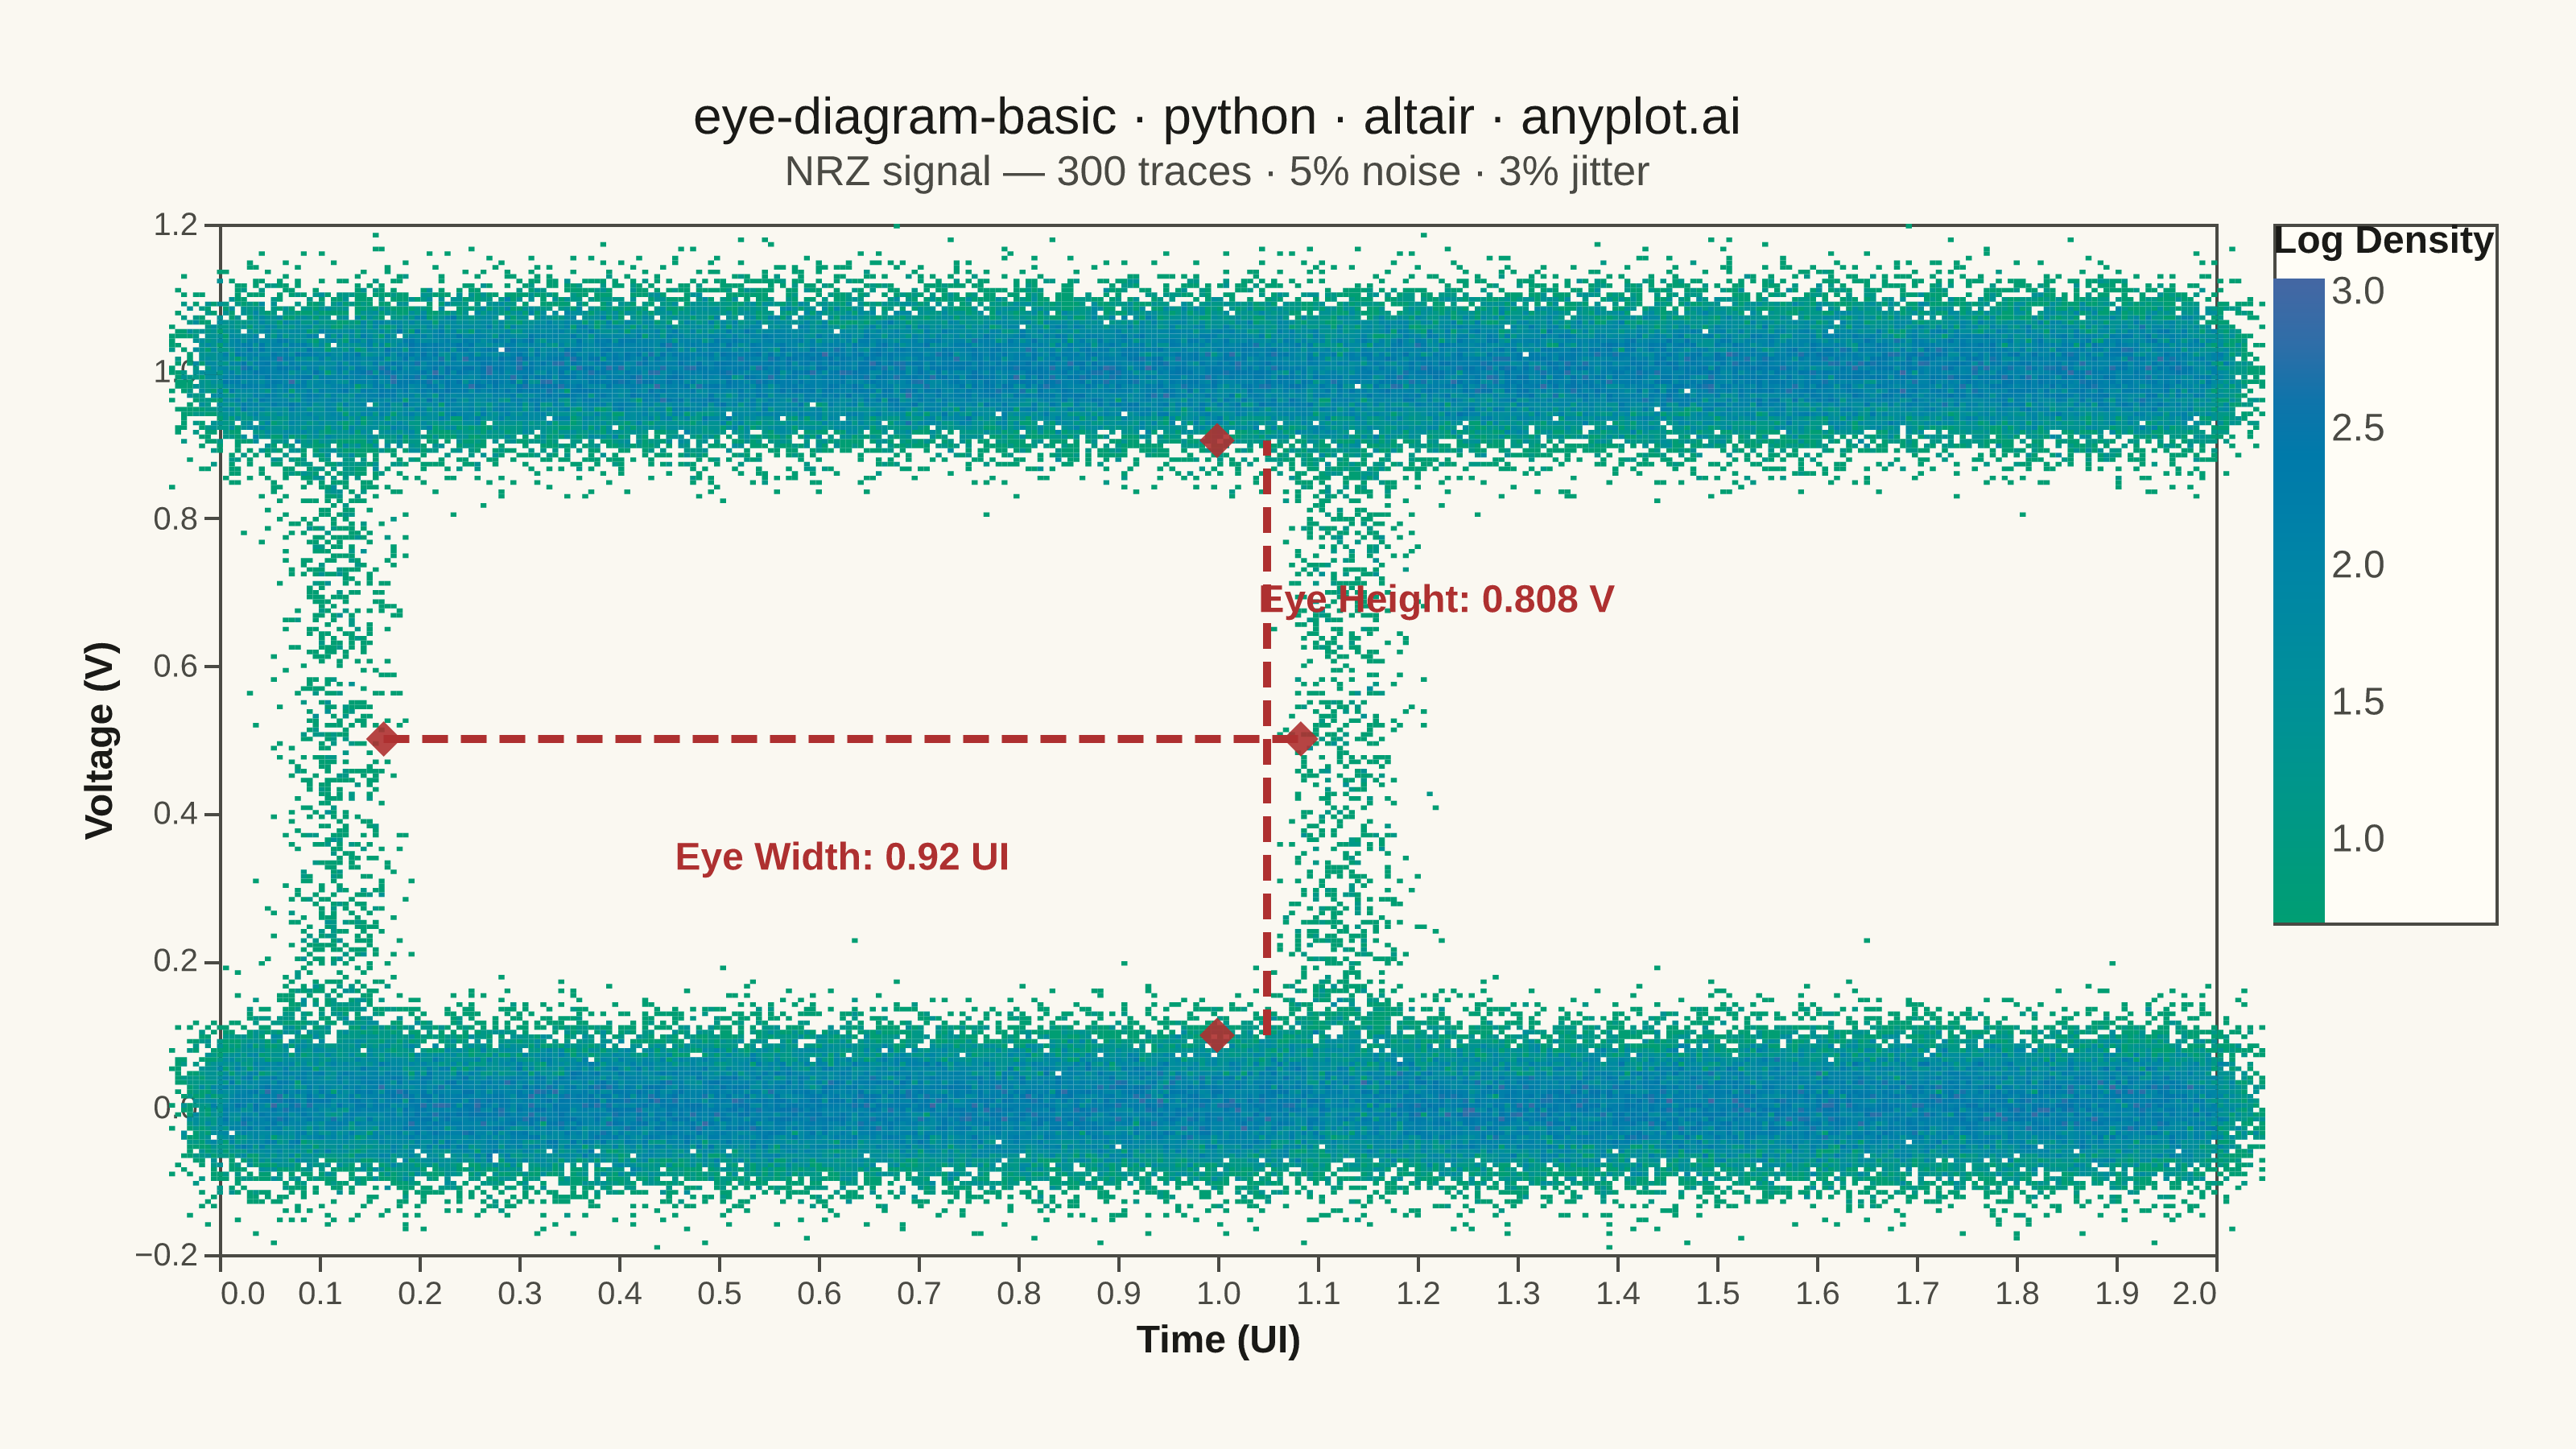
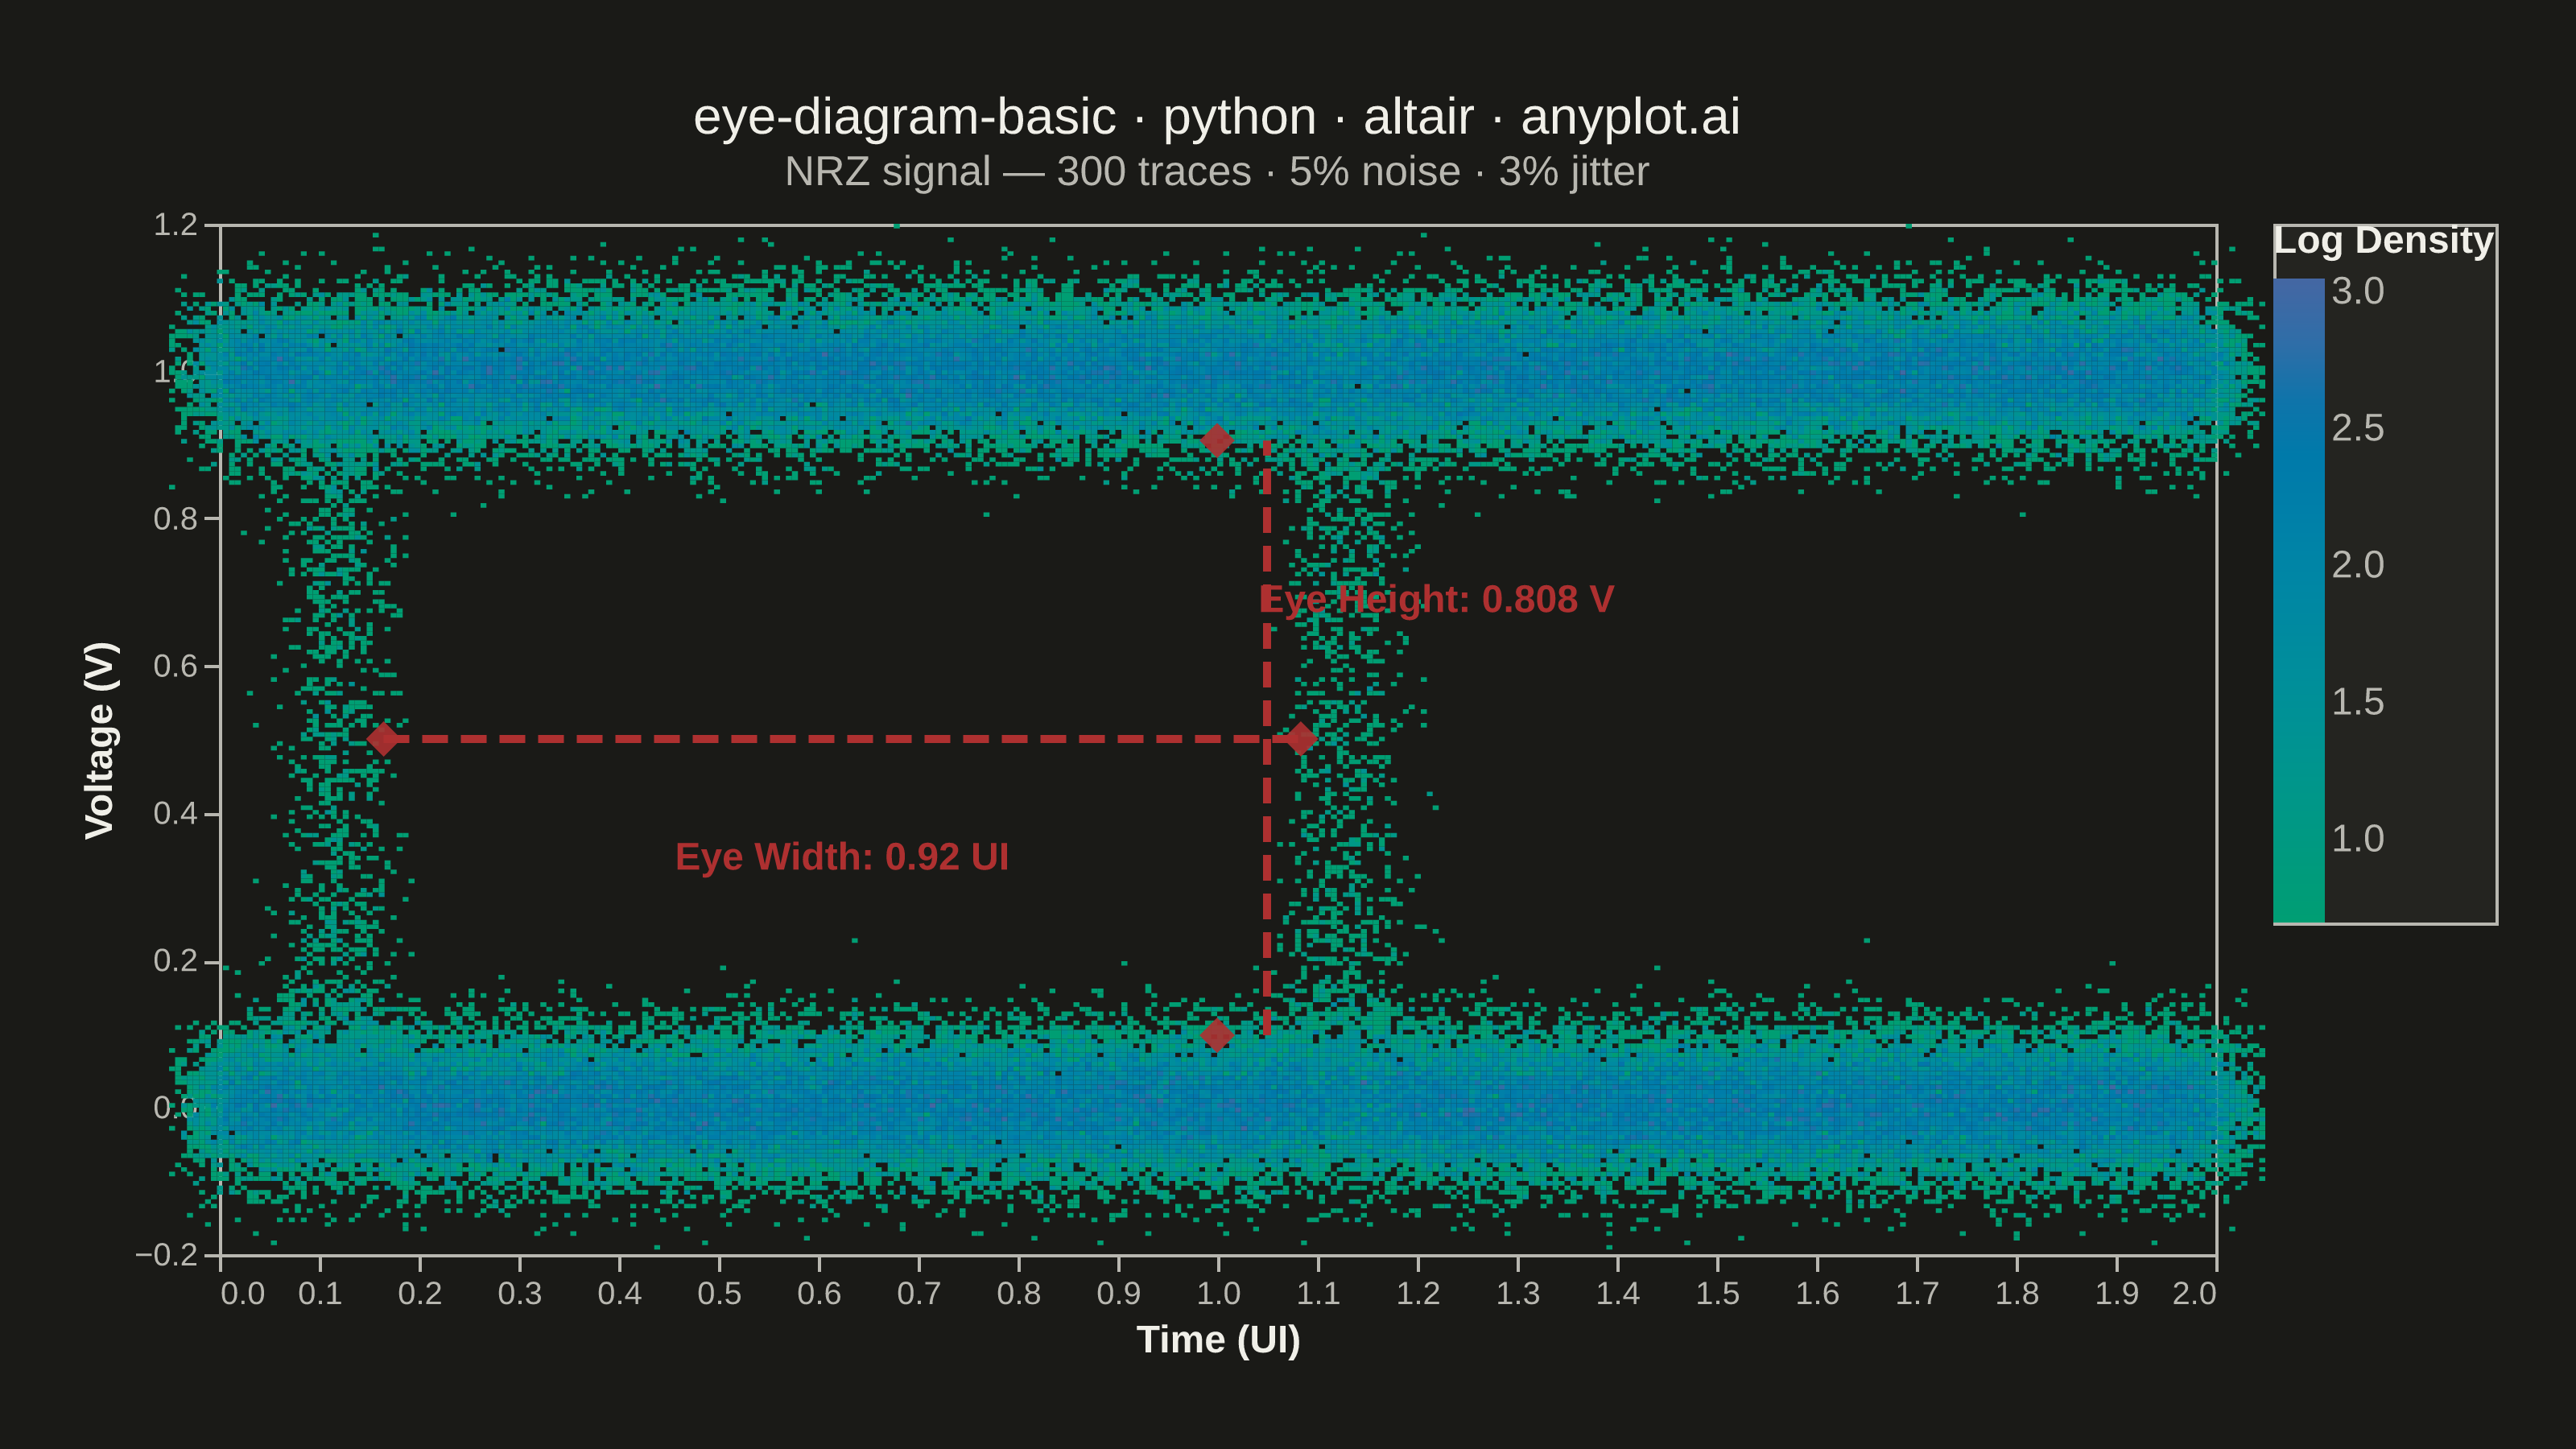
An eye diagram visualizes signal integrity by overlaying many periods of a digital signal onto a single time window spanning 1-2 unit intervals (UI). The overlapping traces form a characteristic eye-shaped opening whose height, width, and clarity reveal signal quality metrics such as jitter, noise, and inter-symbol interference (ISI). A wide-open eye indicates clean signal transmission, while a closed or blurred eye signals degradation.
""" anyplot.ai
eye-diagram-basic: Signal Integrity Eye Diagram
Library: altair 6.2.1 | Python 3.13.13
Quality: 90/100 | Updated: 2026-06-18
"""

import os
import sys


# Prevent this file from shadowing the installed altair package on sys.path
_here = os.path.dirname(os.path.abspath(__file__))
sys.path = [p for p in sys.path if os.path.abspath(p) != _here]
del _here

import altair as alt
import numpy as np
import pandas as pd
from PIL import Image


# Theme tokens
THEME = os.getenv("ANYPLOT_THEME", "light")
PAGE_BG = "#FAF8F1" if THEME == "light" else "#1A1A17"
ELEVATED_BG = "#FFFDF6" if THEME == "light" else "#242420"
INK = "#1A1A17" if THEME == "light" else "#F0EFE8"
INK_SOFT = "#4A4A44" if THEME == "light" else "#B8B7B0"
ANNOTATION_COLOR = "#AE3030"  # Imprint matte-red for measurement indicators

# Data
np.random.seed(42)

n_traces = 300
samples_per_ui = 200
amplitude = 1.0
noise_sigma = 0.05 * amplitude
jitter_sigma = 0.03

n_bits = n_traces + 4
bits = np.random.randint(0, 2, n_bits)

samples_per_bit = samples_per_ui
total_signal_len = n_bits * samples_per_bit
t_full = np.arange(total_signal_len) / samples_per_bit

signal_full = np.zeros(total_signal_len)
for i in range(total_signal_len):
    bit_idx = int(t_full[i])
    if bit_idx >= n_bits:
        bit_idx = n_bits - 1
    frac = t_full[i] - bit_idx

    current_level = bits[bit_idx] * amplitude
    prev_level = bits[bit_idx - 1] * amplitude if bit_idx > 0 else bits[0] * amplitude

    transition_width = 0.12
    blend = 1.0 / (1.0 + np.exp(-14 * (frac - transition_width) / transition_width))
    signal_full[i] = prev_level + (current_level - prev_level) * blend

signal_full += np.random.normal(0, noise_sigma, total_signal_len)

all_time = []
all_voltage = []
window_samples = 2 * samples_per_ui

for trace in range(n_traces):
    start_bit = trace + 1
    start_sample = start_bit * samples_per_bit
    end_sample = start_sample + window_samples

    if end_sample > total_signal_len:
        break

    jitter_offset = np.random.normal(0, jitter_sigma)
    trace_time = np.linspace(0, 2, window_samples) + jitter_offset
    trace_voltage = signal_full[start_sample:end_sample]

    all_time.extend(trace_time.tolist())
    all_voltage.extend(trace_voltage.tolist())

# Pre-bin into 2D histogram for density heatmap
time_bins = 350
voltage_bins = 225
time_edges = np.linspace(-0.05, 2.05, time_bins + 1)
voltage_edges = np.linspace(-0.2, 1.2, voltage_bins + 1)

hist, _, _ = np.histogram2d(all_time, all_voltage, bins=[time_edges, voltage_edges])

# Use exact bin edges (x/x2/y/y2) for seamless tiling — no pixel arithmetic needed
rows = []
for i in range(time_bins):
    for j in range(voltage_bins):
        if hist[i, j] > 0:
            rows.append(
                {
                    "t_left": round(float(time_edges[i]), 5),
                    "t_right": round(float(time_edges[i + 1]), 5),
                    "v_bottom": round(float(voltage_edges[j]), 5),
                    "v_top": round(float(voltage_edges[j + 1]), 5),
                    "density": float(hist[i, j]),
                }
            )

df = pd.DataFrame(rows)
df["log_density"] = np.log1p(df["density"])

# Eye measurements for annotations
all_time_arr = np.array(all_time)
all_voltage_arr = np.array(all_voltage)
mid_time = 1.0
eye_center_v = amplitude / 2

mid_mask = (all_time_arr > 0.9) & (all_time_arr < 1.1)
mid_voltages = all_voltage_arr[mid_mask]
high_voltages = mid_voltages[mid_voltages > eye_center_v]
low_voltages = mid_voltages[mid_voltages <= eye_center_v]
eye_top = float(np.percentile(high_voltages, 5)) if len(high_voltages) > 0 else 0.9
eye_bottom = float(np.percentile(low_voltages, 95)) if len(low_voltages) > 0 else 0.1
eye_height_val = eye_top - eye_bottom

mid_v_mask = (all_voltage_arr > 0.4) & (all_voltage_arr < 0.6)
transition_times = all_time_arr[mid_v_mask]
left_transitions = transition_times[transition_times < 1.0]
right_transitions = transition_times[transition_times >= 1.0]
eye_left = float(np.percentile(left_transitions, 95)) if len(left_transitions) > 0 else 0.3
eye_right = float(np.percentile(right_transitions, 5)) if len(right_transitions) > 0 else 1.7
eye_width_val = eye_right - eye_left

# Title scaling: 67-char baseline at 16px default for altair
title_str = "eye-diagram-basic · python · altair · anyplot.ai"
title_fontsize = max(11, round(16 * 67 / max(len(title_str), 67)))

# Heatmap using exact bin edges (x2/y2) — eliminates tiling gaps
heatmap = (
    alt.Chart(df)
    .mark_rect()
    .encode(
        x=alt.X("t_left:Q", title="Time (UI)", scale=alt.Scale(domain=[0, 2])),
        x2=alt.X2("t_right:Q"),
        y=alt.Y("v_bottom:Q", title="Voltage (V)", scale=alt.Scale(domain=[-0.15, 1.15])),
        y2=alt.Y2("v_top:Q"),
        color=alt.Color(
            "log_density:Q",
            scale=alt.Scale(range=["#009E73", "#4467A3"]),  # Imprint sequential
            legend=alt.Legend(title="Log Density", gradientLength=200, orient="right"),
        ),
        tooltip=[
            alt.Tooltip("t_left:Q", title="Time (UI)", format=".3f"),
            alt.Tooltip("v_bottom:Q", title="Voltage (V)", format=".3f"),
            alt.Tooltip("density:Q", title="Trace Count", format=".0f"),
        ],
    )
)

# Eye height annotation (vertical dashed line)
height_rule = (
    alt.Chart(pd.DataFrame([{"x": mid_time + 0.05, "y": eye_bottom, "y2": eye_top}]))
    .mark_rule(color=ANNOTATION_COLOR, strokeWidth=2.5, strokeDash=[8, 4])
    .encode(x="x:Q", y="y:Q", y2="y2:Q")
)

# Eye width annotation (horizontal dashed line)
width_rule = (
    alt.Chart(pd.DataFrame([{"x": eye_left, "x2": eye_right, "y": eye_center_v}]))
    .mark_rule(color=ANNOTATION_COLOR, strokeWidth=2.5, strokeDash=[8, 4])
    .encode(x="x:Q", x2="x2:Q", y="y:Q")
)

# Measurement labels
ann_labels = pd.DataFrame(
    [
        {"x": mid_time + 0.22, "y": eye_center_v + 0.19, "text": f"Eye Height: {eye_height_val:.3f} V"},
        {"x": (eye_left + eye_right) / 2, "y": eye_center_v - 0.16, "text": f"Eye Width: {eye_width_val:.2f} UI"},
    ]
)
labels = (
    alt.Chart(ann_labels)
    .mark_text(color=ANNOTATION_COLOR, fontSize=12, fontWeight="bold", align="center", baseline="middle")
    .encode(x="x:Q", y="y:Q", text="text:N")
)

# Diamond markers at eye opening corners
eye_markers = pd.DataFrame(
    [
        {"x": mid_time, "y": eye_top},
        {"x": mid_time, "y": eye_bottom},
        {"x": eye_left, "y": eye_center_v},
        {"x": eye_right, "y": eye_center_v},
    ]
)
markers = (
    alt.Chart(eye_markers)
    .mark_point(shape="diamond", color=ANNOTATION_COLOR, size=120, filled=True, opacity=0.9)
    .encode(x="x:Q", y="y:Q")
)

# Compose layers and configure
chart = (
    (heatmap + height_rule + width_rule + labels + markers)
    .properties(
        width=620,
        height=320,
        background=PAGE_BG,
        title=alt.Title(
            title_str,
            fontSize=title_fontsize,
            fontWeight=500,
            color=INK,
            subtitle="NRZ signal — 300 traces · 5% noise · 3% jitter",
            subtitleFontSize=13,
            subtitleColor=INK_SOFT,
        ),
    )
    .configure_view(fill=PAGE_BG, stroke=INK_SOFT)
    .configure_axis(
        labelFontSize=10,
        titleFontSize=12,
        labelColor=INK_SOFT,
        titleColor=INK,
        tickColor=INK_SOFT,
        domainColor=INK_SOFT,
        grid=False,
    )
    .configure_legend(
        fillColor=ELEVATED_BG,
        strokeColor=INK_SOFT,
        labelColor=INK_SOFT,
        titleColor=INK,
        labelFontSize=12,
        titleFontSize=12,
    )
    .configure_title(color=INK)
)

# Save PNG
chart.save(f"plot-{THEME}.png", scale_factor=4.0)

# Pad to exact 3200×1800
TW, TH = 3200, 1800
_img = Image.open(f"plot-{THEME}.png").convert("RGB")
_w, _h = _img.size
if _w > TW or _h > TH:
    raise SystemExit(
        f"altair vl-convert produced {_w}×{_h}, exceeds target {TW}×{TH}. "
        f"Shrink chart .properties(width=, height=) values and re-render."
    )
if _w < TW or _h < TH:
    _canvas = Image.new("RGB", (TW, TH), PAGE_BG)
    _canvas.paste(_img, ((TW - _w) // 2, (TH - _h) // 2))
    _canvas.save(f"plot-{THEME}.png")

# Save HTML
chart.save(f"plot-{THEME}.html")
Runnable source as JSON, for any HTTP client: https://api.anyplot.ai/specs/eye-diagram-basic/altair/code. Any spec id and library id listed in llms-full.txt fit the same URL shape; every URL below is complete and callable.
{
  "spec_id": "eye-diagram-basic",
  "language": "python",
  "library": "altair",
  "page": "https://anyplot.ai/eye-diagram-basic/python/altair",
  "hub": "https://anyplot.ai/eye-diagram-basic",
  "code_json": "https://api.anyplot.ai/specs/eye-diagram-basic/altair/code",
  "spec_json": "https://api.anyplot.ai/specs/eye-diagram-basic",
  "render_light_png": "https://storage.googleapis.com/anyplot-images/plots/eye-diagram-basic/python/altair/plot-light.png",
  "render_dark_png": "https://storage.googleapis.com/anyplot-images/plots/eye-diagram-basic/python/altair/plot-dark.png",
  "interactive_light_html": "https://storage.googleapis.com/anyplot-images/plots/eye-diagram-basic/python/altair/plot-light.html",
  "interactive_dark_html": "https://storage.googleapis.com/anyplot-images/plots/eye-diagram-basic/python/altair/plot-dark.html",
  "quality_score": 90.0,
  "license": "MIT",
  "guide": "https://anyplot.ai/llms.txt"
}
Part of Signal Integrity Eye Diagram on anyplot.ai.