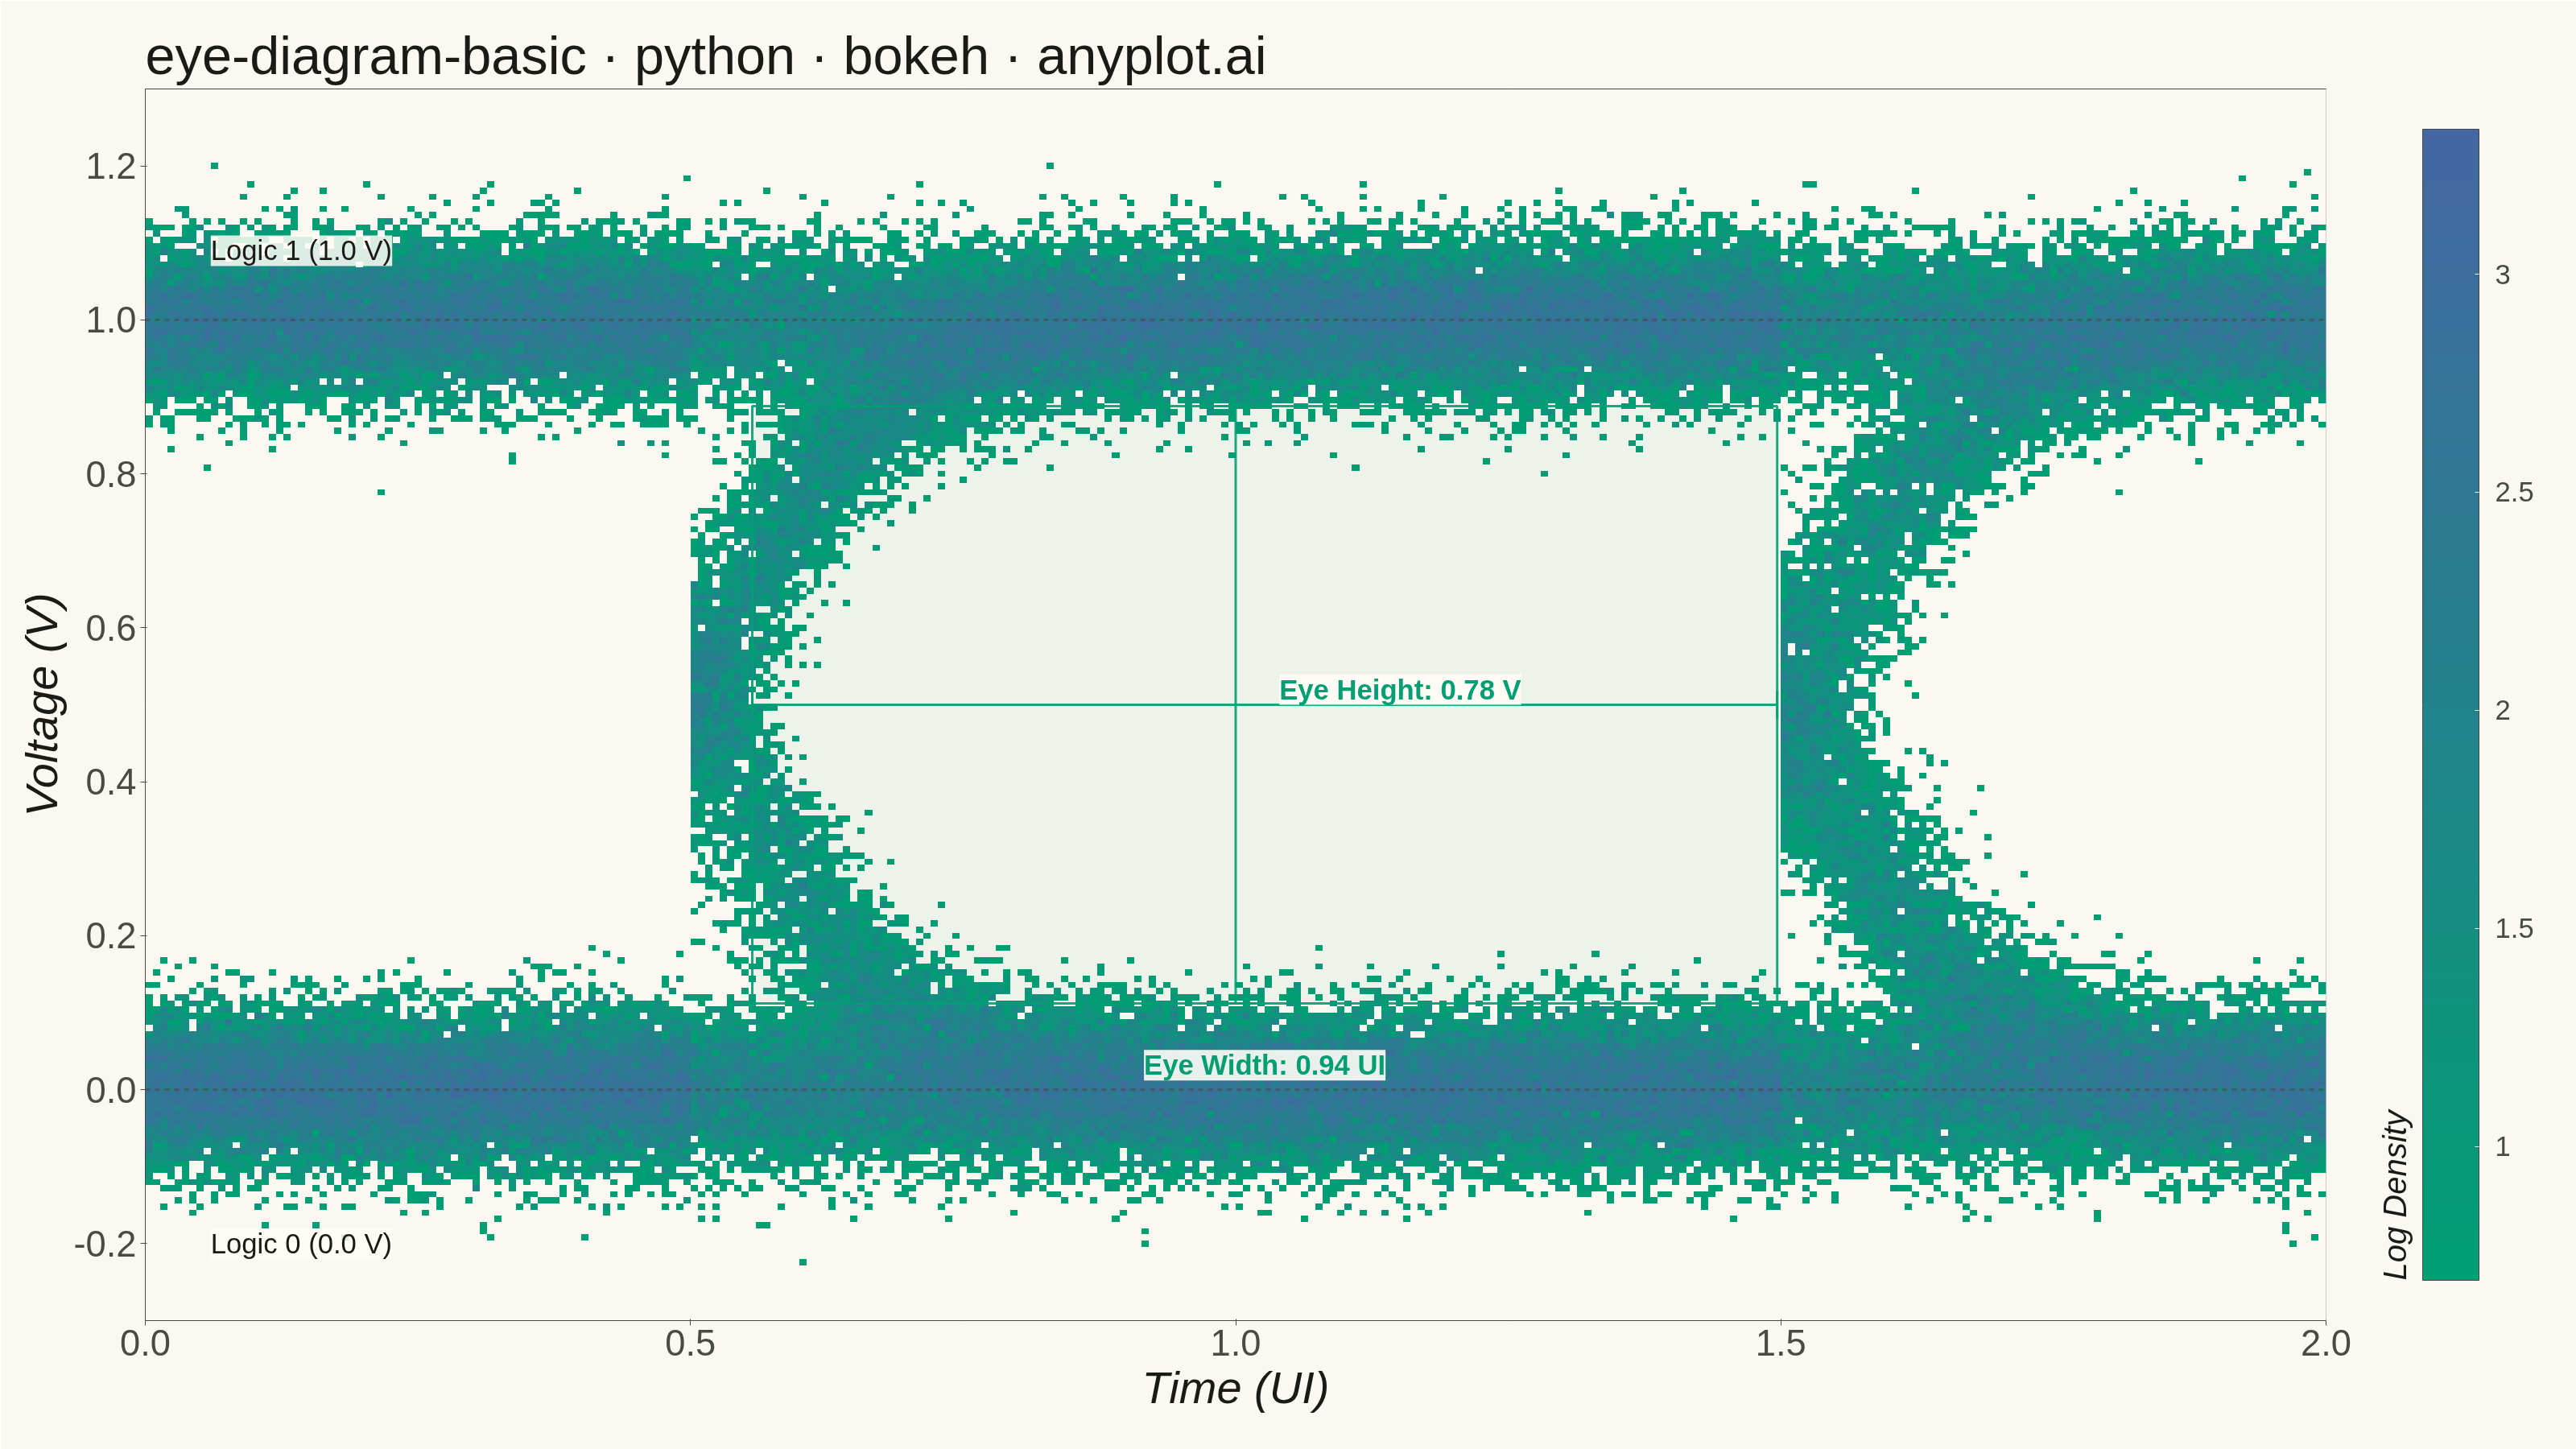
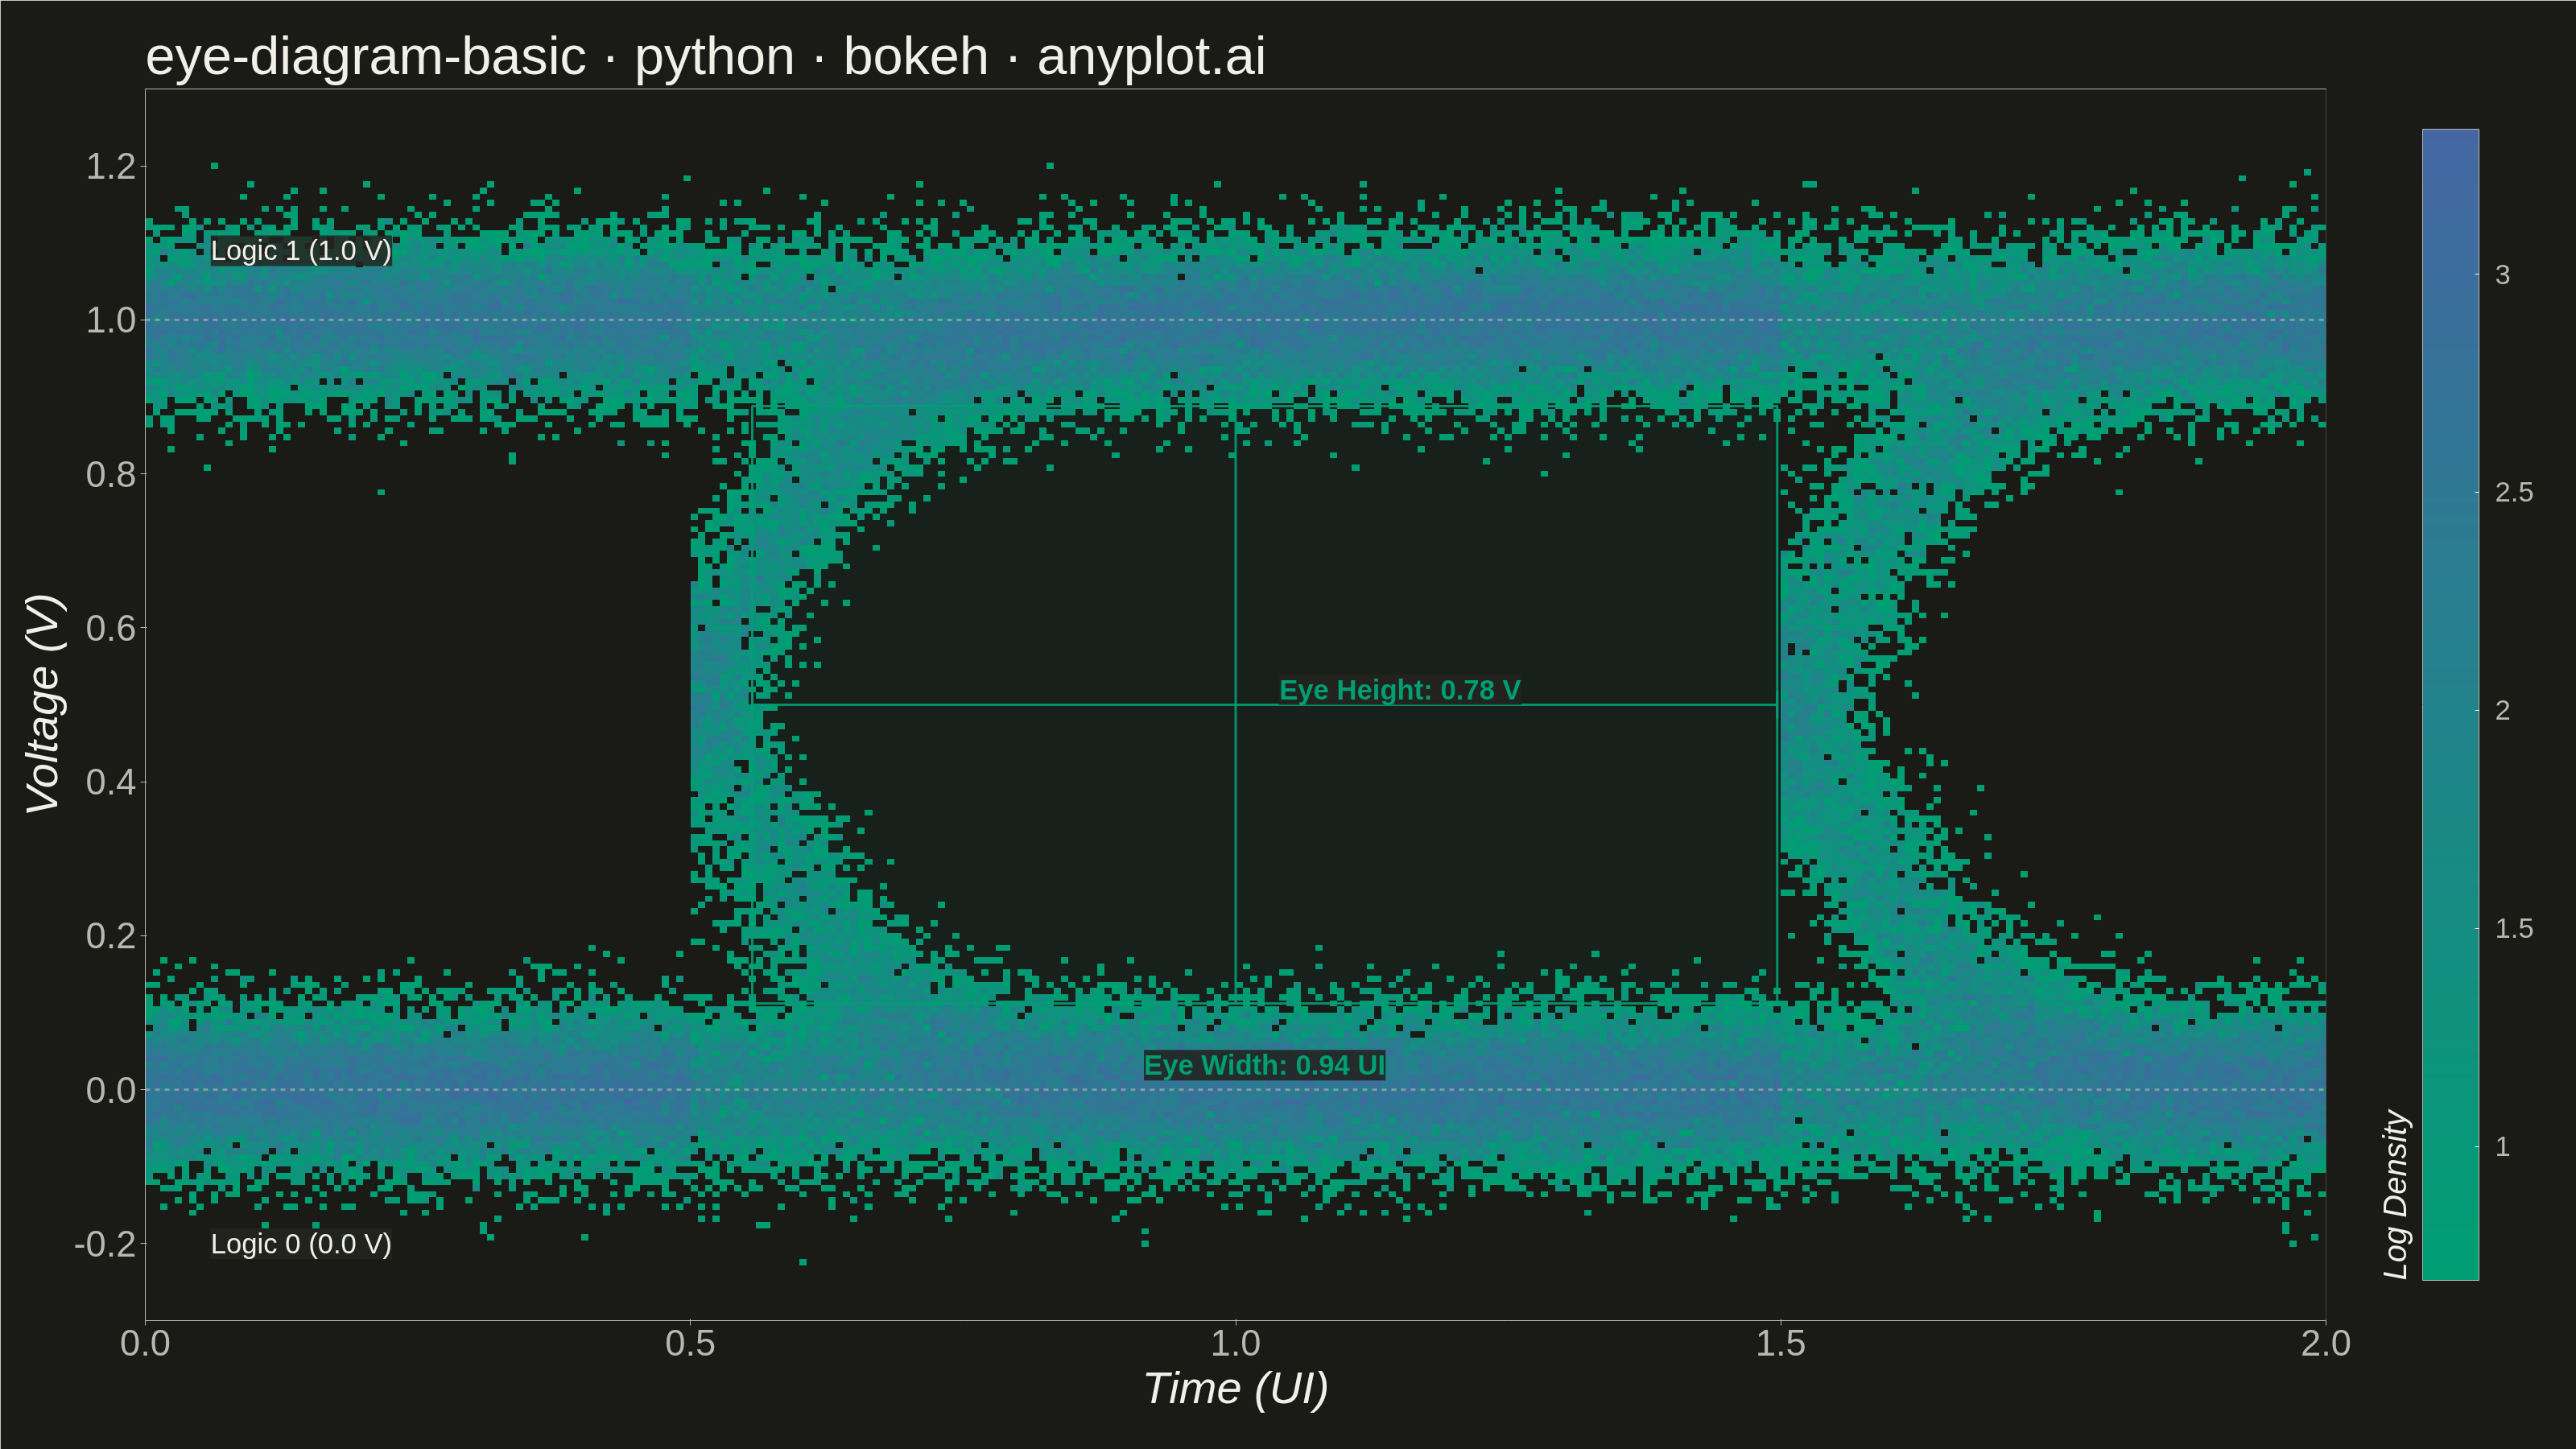
An eye diagram visualizes signal integrity by overlaying many periods of a digital signal onto a single time window spanning 1-2 unit intervals (UI). The overlapping traces form a characteristic eye-shaped opening whose height, width, and clarity reveal signal quality metrics such as jitter, noise, and inter-symbol interference (ISI). A wide-open eye indicates clean signal transmission, while a closed or blurred eye signals degradation.
""" anyplot.ai
eye-diagram-basic: Signal Integrity Eye Diagram
Library: bokeh 3.9.1 | Python 3.13.14
Quality: 90/100 | Updated: 2026-06-18
"""

import os
import time
from pathlib import Path

import numpy as np
from bokeh.io import output_file, save
from bokeh.models import BoxAnnotation, ColorBar, Label, LinearColorMapper, NumeralTickFormatter, Span
from bokeh.plotting import figure
from selenium import webdriver
from selenium.webdriver.chrome.options import Options


# Theme tokens (Imprint palette — theme-adaptive chrome)
THEME = os.getenv("ANYPLOT_THEME", "light")
PAGE_BG = "#FAF8F1" if THEME == "light" else "#1A1A17"
ELEVATED_BG = "#FFFDF6" if THEME == "light" else "#242420"
INK = "#1A1A17" if THEME == "light" else "#F0EFE8"
INK_SOFT = "#4A4A44" if THEME == "light" else "#B8B7B0"
BRAND = "#009E73"  # Imprint palette position 1 — first series / eye-opening highlight

# Imprint sequential palette for continuous density (green → blue)
_c0 = np.array([0x00, 0x9E, 0x73])  # #009E73
_c1 = np.array([0x44, 0x67, 0xA3])  # #4467A3
ANYPLOT_SEQ256 = ["#{:02X}{:02X}{:02X}".format(*np.round(_c0 + (_c1 - _c0) * t / 255).astype(int)) for t in range(256)]

# Data — simulate NRZ eye diagram
np.random.seed(42)
n_traces = 400
samples_per_ui = 150
n_bits = 3
total_samples = samples_per_ui * n_bits
noise_sigma = 0.05
jitter_sigma = 0.03

all_time = []
all_voltage = []

for _ in range(n_traces):
    bits = np.random.randint(0, 2, n_bits + 2)
    signal = np.zeros(total_samples)

    for i in range(n_bits):
        prev_bit = bits[i]
        curr_bit = bits[i + 1]
        t_local = np.linspace(0, 1, samples_per_ui)
        jitter = np.random.normal(0, jitter_sigma)

        if prev_bit != curr_bit:
            transition_point = 0.0 + jitter
            steepness = 12
            transition = 1 / (1 + np.exp(-steepness * (t_local - transition_point)))
            if prev_bit > curr_bit:
                segment = 1 - transition
            else:
                segment = transition
        else:
            segment = np.full(samples_per_ui, float(curr_bit))

        signal[i * samples_per_ui : (i + 1) * samples_per_ui] = segment

    signal += np.random.normal(0, noise_sigma, total_samples)

    # Extract 2-UI window centered on the middle bit
    start = samples_per_ui // 2
    end = start + 2 * samples_per_ui
    window_time = np.linspace(0, 2, end - start)
    window_voltage = signal[start:end]

    all_time.append(window_time)
    all_voltage.append(window_voltage)

all_time = np.array(all_time)
all_voltage = np.array(all_voltage)

# Build 2D histogram for density heatmap
time_bins = 300
voltage_bins = 200
time_edges = np.linspace(0, 2, time_bins + 1)
voltage_edges = np.linspace(-0.3, 1.3, voltage_bins + 1)

histogram, _, _ = np.histogram2d(all_time.ravel(), all_voltage.ravel(), bins=[time_edges, voltage_edges])

# Log-scale for contrast; mask empty bins so background shows through
histogram = np.log1p(histogram).T
histogram = np.where(histogram > 0, histogram, np.nan)

# Measure eye opening from the density data
voltage_centers = 0.5 * (voltage_edges[:-1] + voltage_edges[1:])
time_centers = 0.5 * (time_edges[:-1] + time_edges[1:])

# Eye height — vertical slice at center UI
center_col = time_bins // 2
center_slice = np.where(np.isnan(histogram[:, center_col]), 0.0, histogram[:, center_col])
threshold = 0.3 * center_slice.max()

mid_idx = voltage_bins // 2
low_mask = center_slice < threshold
low_indices = np.where(low_mask)[0]
eye_region = low_indices[(low_indices >= mid_idx - voltage_bins // 4) & (low_indices <= mid_idx + voltage_bins // 4)]
lower_eye = voltage_centers[eye_region[0]] if len(eye_region) > 0 else voltage_centers[mid_idx - 10]
upper_eye = voltage_centers[eye_region[-1]] if len(eye_region) > 0 else voltage_centers[mid_idx + 10]
eye_height = upper_eye - lower_eye

# Eye width — horizontal slice at midpoint voltage
mid_v_idx = np.searchsorted(voltage_centers, (lower_eye + upper_eye) / 2)
mid_slice = np.where(np.isnan(histogram[mid_v_idx, :]), 0.0, histogram[mid_v_idx, :])
low_time_mask = mid_slice < threshold

center_time_idx = time_bins // 2
low_time_indices = np.where(low_time_mask)[0]
eye_time_region = low_time_indices[
    (low_time_indices >= center_time_idx - time_bins // 4) & (low_time_indices <= center_time_idx + time_bins // 4)
]
eye_left = time_centers[eye_time_region[0]] if len(eye_time_region) > 0 else time_centers[center_time_idx - 20]
eye_right = time_centers[eye_time_region[-1]] if len(eye_time_region) > 0 else time_centers[center_time_idx + 20]
eye_width = eye_right - eye_left

# Plot
TITLE = "eye-diagram-basic · python · bokeh · anyplot.ai"
p = figure(
    width=3200,
    height=1800,
    title=TITLE,
    x_axis_label="Time (UI)",
    y_axis_label="Voltage (V)",
    x_range=(0, 2),
    y_range=(-0.3, 1.3),
    toolbar_location=None,
    min_border_bottom=160,
    min_border_left=180,
    min_border_top=110,
    min_border_right=80,
)

color_mapper = LinearColorMapper(
    palette=ANYPLOT_SEQ256, low=float(np.nanmin(histogram)), high=float(np.nanmax(histogram)), nan_color=PAGE_BG
)

p.image(image=[histogram], x=0, y=-0.3, dw=2, dh=1.6, color_mapper=color_mapper)

# Reference lines at 0 V and 1 V signal levels
p.add_layout(
    Span(location=0.0, dimension="width", line_color=INK_SOFT, line_width=3, line_alpha=0.6, line_dash="dashed")
)
p.add_layout(
    Span(location=1.0, dimension="width", line_color=INK_SOFT, line_width=3, line_alpha=0.6, line_dash="dashed")
)

# Eye opening highlight box
p.add_layout(
    BoxAnnotation(
        left=eye_left,
        right=eye_right,
        bottom=lower_eye,
        top=upper_eye,
        fill_color=BRAND,
        fill_alpha=0.05,
        line_color=BRAND,
        line_width=3,
        line_alpha=0.9,
        line_dash="solid",
    )
)

# Eye height annotation — vertical line with end caps
cap_w = 0.018
p.line(x=[1.0, 1.0], y=[lower_eye, upper_eye], line_color=BRAND, line_width=3, line_alpha=0.9)
for cap_y in [lower_eye, upper_eye]:
    p.line(x=[1.0 - cap_w, 1.0 + cap_w], y=[cap_y, cap_y], line_color=BRAND, line_width=3, line_alpha=0.9)

# Eye width annotation — horizontal line with end caps
eye_mid_v = (upper_eye + lower_eye) / 2
cap_h = 0.018
p.line(x=[eye_left, eye_right], y=[eye_mid_v, eye_mid_v], line_color=BRAND, line_width=3, line_alpha=0.9)
for cap_x in [eye_left, eye_right]:
    p.line(x=[cap_x, cap_x], y=[eye_mid_v - cap_h, eye_mid_v + cap_h], line_color=BRAND, line_width=3, line_alpha=0.9)

# Eye measurement labels
p.add_layout(
    Label(
        x=1.04,
        y=(upper_eye + lower_eye) / 2,
        text=f"Eye Height: {eye_height:.2f} V",
        text_color=BRAND,
        text_font_size="26pt",
        text_font_style="bold",
        background_fill_color=ELEVATED_BG,
        background_fill_alpha=0.90,
    )
)
p.add_layout(
    Label(
        x=(eye_left + eye_right) / 2,
        y=lower_eye - 0.10,
        text=f"Eye Width: {eye_width:.2f} UI",
        text_color=BRAND,
        text_font_size="26pt",
        text_font_style="bold",
        text_align="center",
        background_fill_color=ELEVATED_BG,
        background_fill_alpha=0.90,
    )
)

# Signal level labels
p.add_layout(
    Label(
        x=0.06,
        y=1.07,
        text="Logic 1 (1.0 V)",
        text_color=INK,
        text_font_size="26pt",
        background_fill_color=ELEVATED_BG,
        background_fill_alpha=0.85,
    )
)
p.add_layout(
    Label(
        x=0.06,
        y=-0.22,
        text="Logic 0 (0.0 V)",
        text_color=INK,
        text_font_size="26pt",
        background_fill_color=ELEVATED_BG,
        background_fill_alpha=0.85,
    )
)

# ColorBar — larger fonts to address the cramped right-side weakness
color_bar = ColorBar(
    color_mapper=color_mapper,
    title="Log Density",
    title_text_font_size="30pt",
    title_text_color=INK,
    title_standoff=26,
    label_standoff=20,
    width=70,
    location=(0, 0),
    major_label_text_font_size="26pt",
    major_label_text_color=INK_SOFT,
    padding=50,
    background_fill_color=PAGE_BG,
    bar_line_color=INK_SOFT,
)
p.add_layout(color_bar, "right")

# Style — sizes per bokeh.md for 3200×1800 canvas
p.title.text_font_size = "50pt"
p.title.text_font_style = "normal"
p.title.text_color = INK
p.xaxis.axis_label_text_font_size = "42pt"
p.yaxis.axis_label_text_font_size = "42pt"
p.xaxis.major_label_text_font_size = "34pt"
p.yaxis.major_label_text_font_size = "34pt"
p.xaxis.axis_label_text_color = INK
p.yaxis.axis_label_text_color = INK
p.xaxis.major_label_text_color = INK_SOFT
p.yaxis.major_label_text_color = INK_SOFT
p.xaxis.axis_line_color = INK_SOFT
p.yaxis.axis_line_color = INK_SOFT
p.xaxis.major_tick_line_color = INK_SOFT
p.yaxis.major_tick_line_color = INK_SOFT
p.xaxis.minor_tick_line_color = None
p.yaxis.minor_tick_line_color = None
p.xaxis.formatter = NumeralTickFormatter(format="0.0")
p.yaxis.formatter = NumeralTickFormatter(format="0.0")

# Remove grid lines for clean heatmap aesthetic
p.xgrid.grid_line_alpha = 0
p.ygrid.grid_line_alpha = 0

# Theme-adaptive chrome
p.background_fill_color = PAGE_BG
p.border_fill_color = PAGE_BG
p.outline_line_color = INK_SOFT

# Save interactive HTML
output_file(f"plot-{THEME}.html")
save(p)

# Screenshot with headless Chrome — Selenium 4 + CDP viewport override for exact dimensions
W, H = 3200, 1800
opts = Options()
for arg in (
    "--headless=new",
    "--no-sandbox",
    "--disable-dev-shm-usage",
    "--disable-gpu",
    "--hide-scrollbars",
    "--force-device-scale-factor=1",
):
    opts.add_argument(arg)
driver = webdriver.Chrome(options=opts)
# CDP override sets the viewport (content area) to exactly W×H, bypassing
# the ~143 px browser-chrome height that --window-size includes.
driver.execute_cdp_cmd(
    "Emulation.setDeviceMetricsOverride", {"width": W, "height": H, "deviceScaleFactor": 1, "mobile": False}
)
driver.get(f"file://{Path(f'plot-{THEME}.html').resolve()}")
time.sleep(3)
driver.save_screenshot(f"plot-{THEME}.png")
driver.quit()
Runnable source as JSON, for any HTTP client: https://api.anyplot.ai/specs/eye-diagram-basic/bokeh/code. Any spec id and library id listed in llms-full.txt fit the same URL shape; every URL below is complete and callable.
{
  "spec_id": "eye-diagram-basic",
  "language": "python",
  "library": "bokeh",
  "page": "https://anyplot.ai/eye-diagram-basic/python/bokeh",
  "hub": "https://anyplot.ai/eye-diagram-basic",
  "code_json": "https://api.anyplot.ai/specs/eye-diagram-basic/bokeh/code",
  "spec_json": "https://api.anyplot.ai/specs/eye-diagram-basic",
  "render_light_png": "https://storage.googleapis.com/anyplot-images/plots/eye-diagram-basic/python/bokeh/plot-light.png",
  "render_dark_png": "https://storage.googleapis.com/anyplot-images/plots/eye-diagram-basic/python/bokeh/plot-dark.png",
  "interactive_light_html": "https://storage.googleapis.com/anyplot-images/plots/eye-diagram-basic/python/bokeh/plot-light.html",
  "interactive_dark_html": "https://storage.googleapis.com/anyplot-images/plots/eye-diagram-basic/python/bokeh/plot-dark.html",
  "quality_score": 90.0,
  "license": "MIT",
  "guide": "https://anyplot.ai/llms.txt"
}
Part of Signal Integrity Eye Diagram on anyplot.ai.