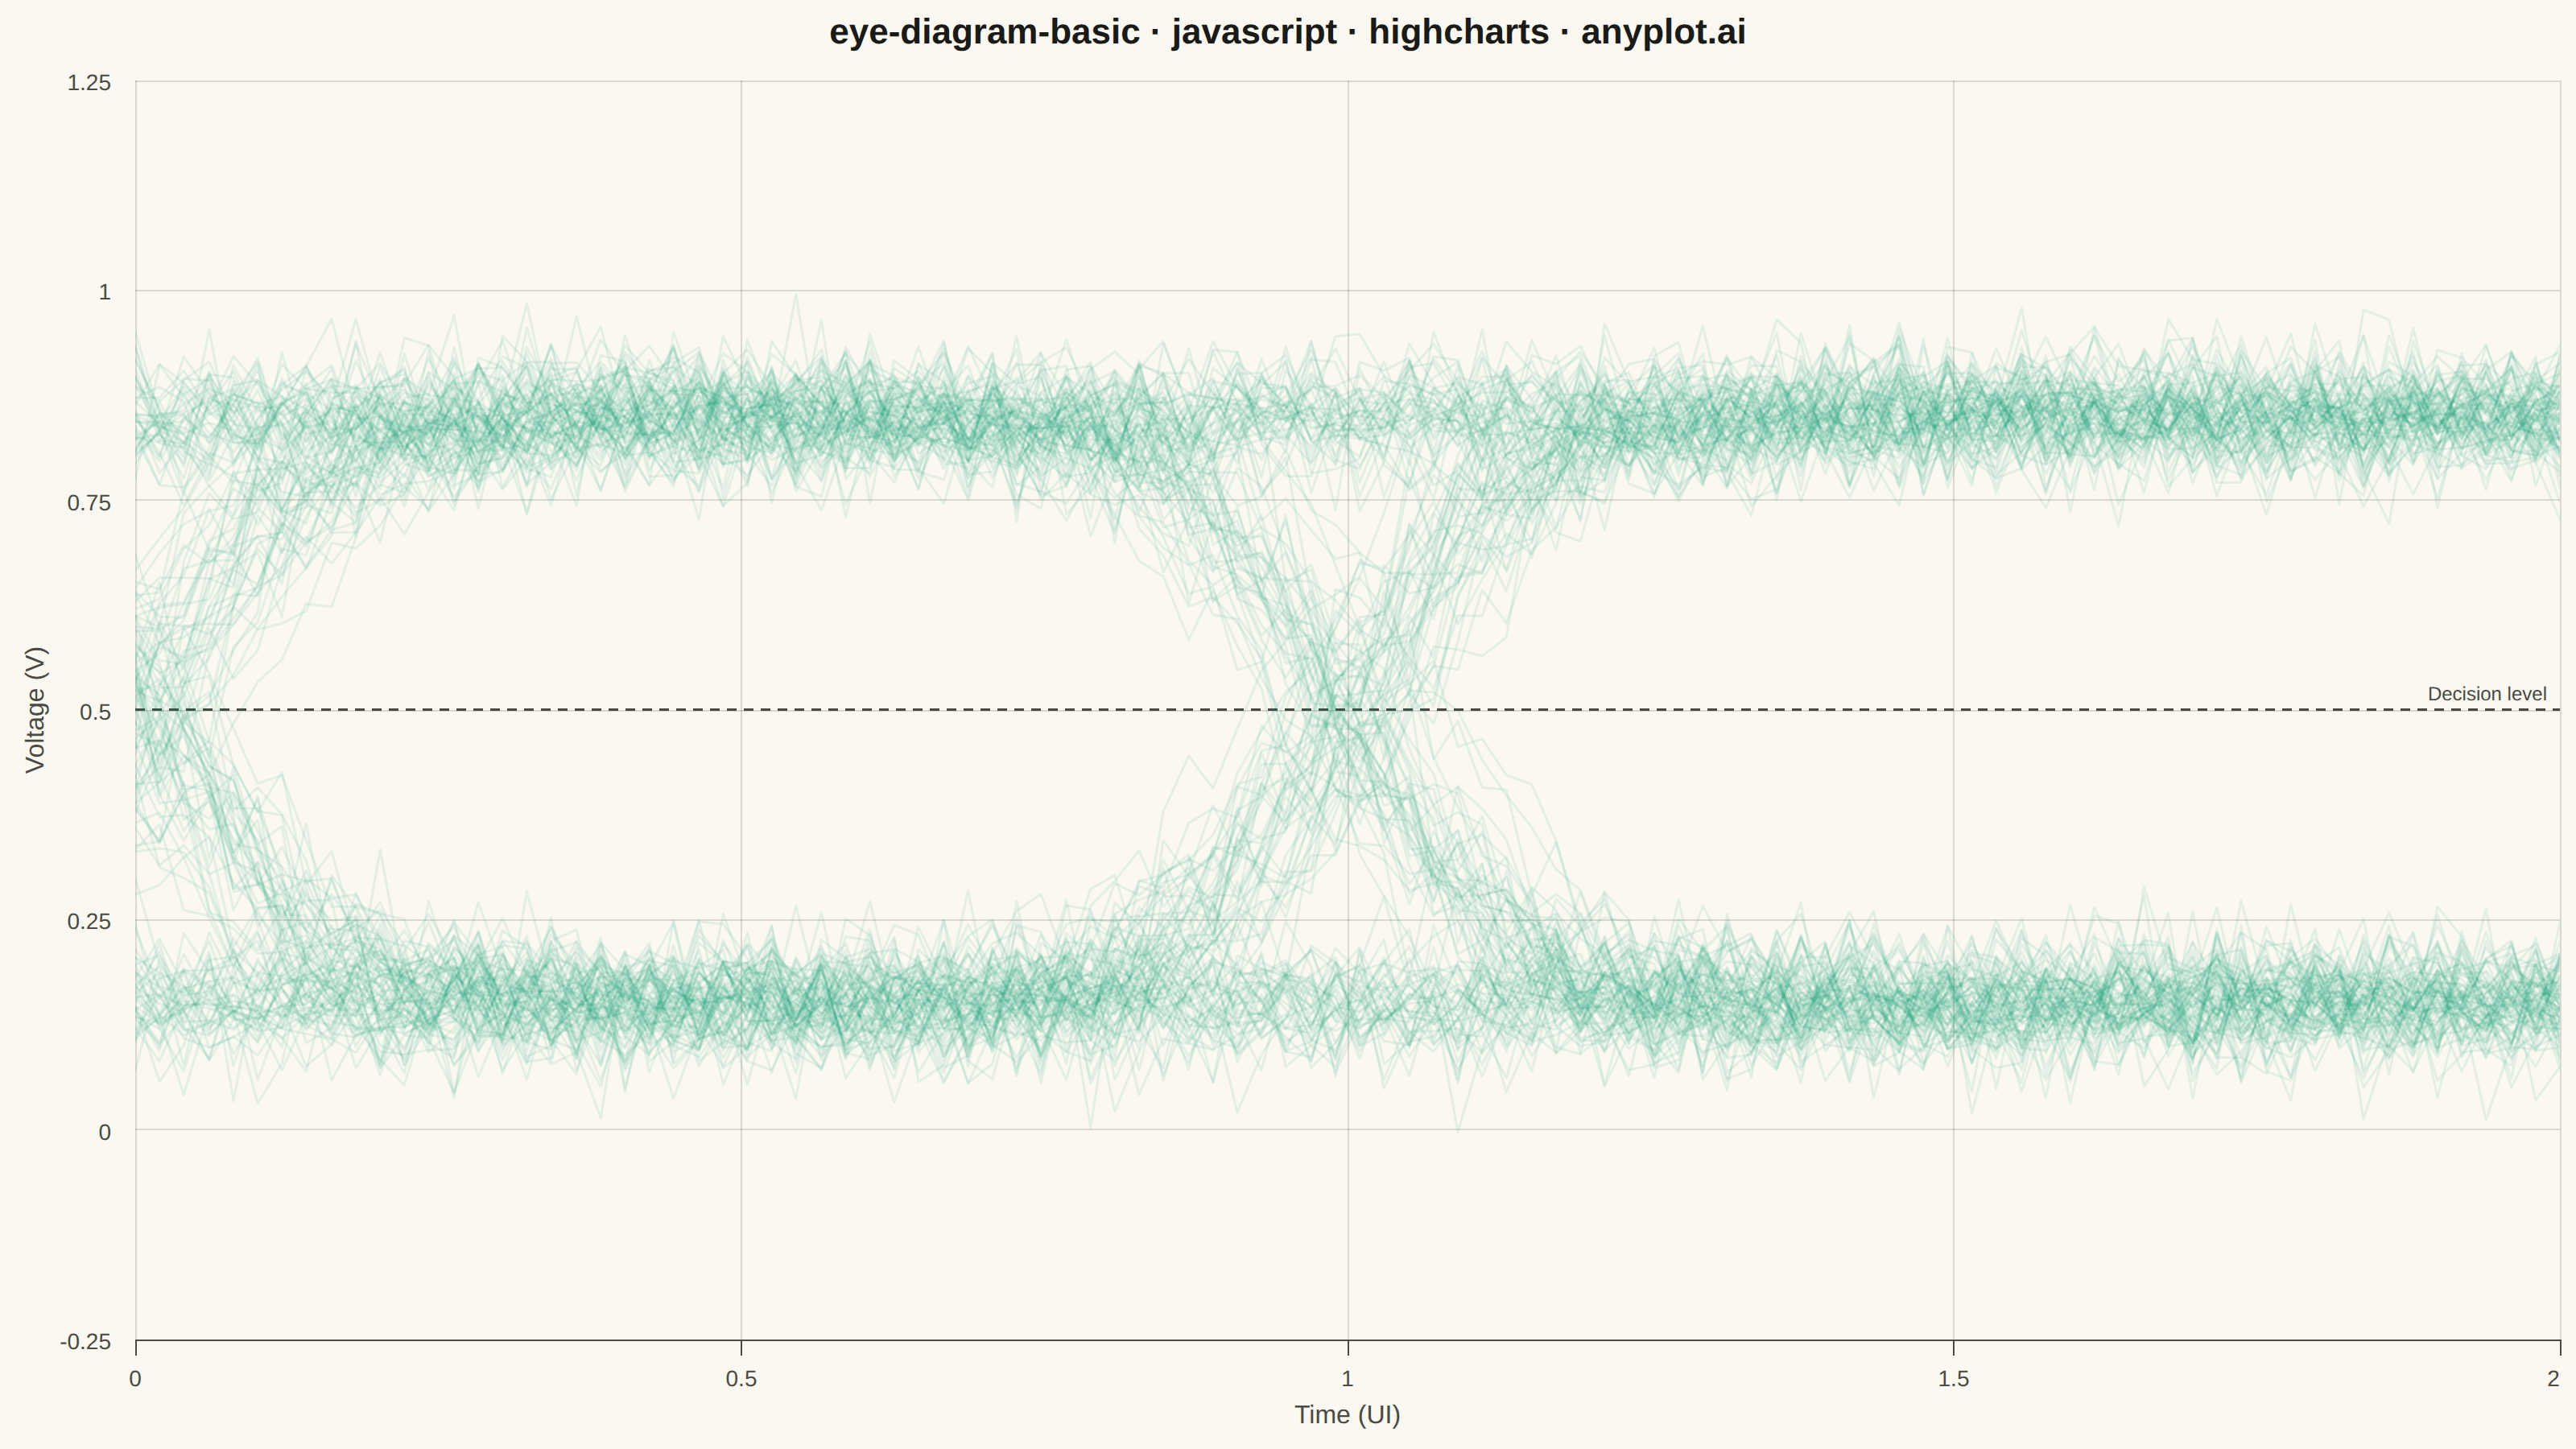
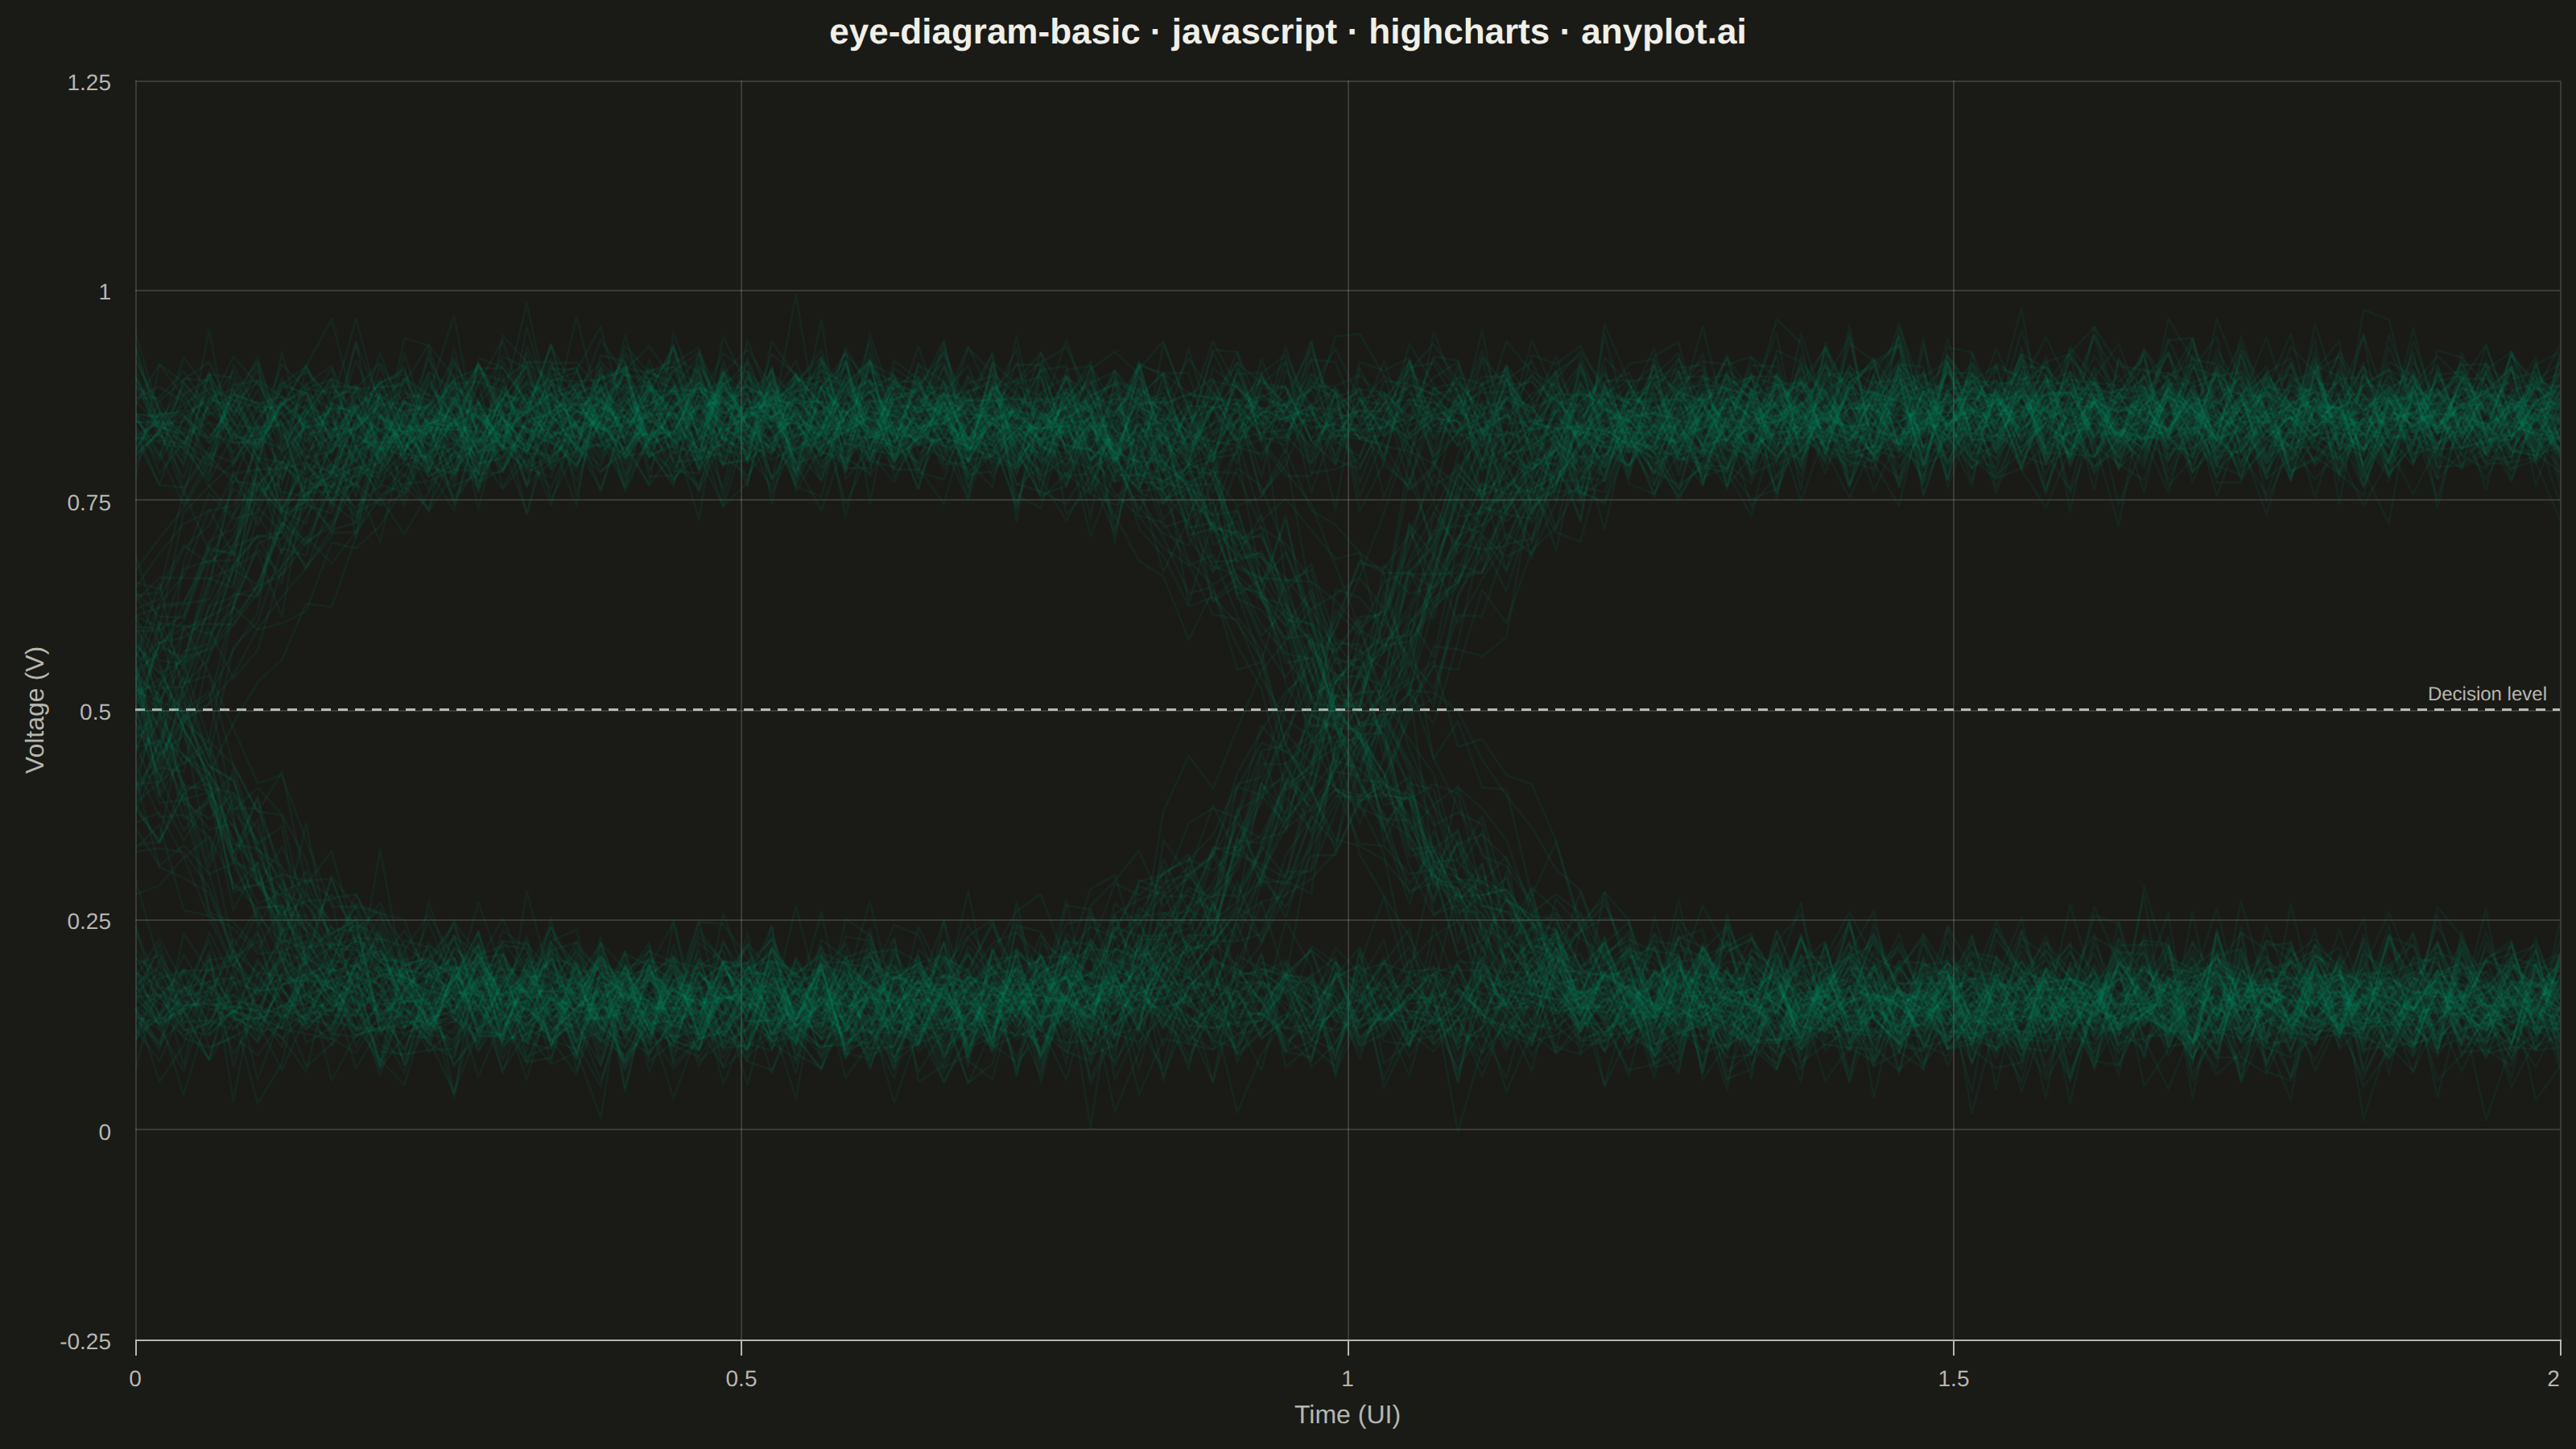
An eye diagram visualizes signal integrity by overlaying many periods of a digital signal onto a single time window spanning 1-2 unit intervals (UI). The overlapping traces form a characteristic eye-shaped opening whose height, width, and clarity reveal signal quality metrics such as jitter, noise, and inter-symbol interference (ISI). A wide-open eye indicates clean signal transmission, while a closed or blurred eye signals degradation.
// anyplot.ai
// eye-diagram-basic: Signal Integrity Eye Diagram
// Library: highcharts 12.6.0 | JavaScript 22.22.3
// Quality: 90/100 | Created: 2026-06-18

//# anyplot-orientation: landscape
const t = window.ANYPLOT_TOKENS;

// Deterministic LCG RNG (seed = 42)
let _seed = 42;
function rand() {
  _seed = (_seed * 1664525 + 1013904223) >>> 0;
  return _seed / 4294967296;
}
function randn() {
  const u1 = rand() + 1e-10;
  const u2 = rand();
  return Math.sqrt(-2 * Math.log(u1)) * Math.cos(2 * Math.PI * u2);
}

// NRZ signal parameters: high-speed serial link (PCIe-style) simulation
const V_HIGH = 0.85;
const V_LOW = 0.15;
const RISE_K = 14;         // sigmoid steepness (~0.1 UI rise/fall time)
const NOISE_SIGMA = 0.04;  // Gaussian noise amplitude (V)
const JITTER_SIGMA = 0.03; // edge jitter std dev (UI)
const SAMPLES = 100;
const TRACES_PER_PATTERN = 20; // 8 patterns × 20 = 160 traces

// Build one trace for the 3-bit NRZ pattern [b0 → b1 → b2]
// Time window is [0, 2] UI: first transition at t≈0, second at t≈1
const allSeries = [];
for (let pattern = 0; pattern < 8; pattern++) {
  const b0 = (pattern >> 2) & 1;
  const b1 = (pattern >> 1) & 1;
  const b2 = pattern & 1;
  const v0 = b0 ? V_HIGH : V_LOW;
  const v1 = b1 ? V_HIGH : V_LOW;
  const v2 = b2 ? V_HIGH : V_LOW;

  for (let k = 0; k < TRACES_PER_PATTERN; k++) {
    const j0 = randn() * JITTER_SIGMA;
    const j1 = randn() * JITTER_SIGMA;
    const data = [];

    for (let i = 0; i < SAMPLES; i++) {
      const time = (i / (SAMPLES - 1)) * 2;
      const s0 = 1 / (1 + Math.exp(-RISE_K * (time - j0)));
      const s1 = 1 / (1 + Math.exp(-RISE_K * (time - 1 - j1)));
      let voltage = v0 + (v1 - v0) * s0 + (v2 - v1) * s1 + randn() * NOISE_SIGMA;
      data.push([Math.round(time * 1000) / 1000, Math.round(voltage * 10000) / 10000]);
    }

    allSeries.push({
      type: "line",
      data,
      lineWidth: 1.5,
      color: t.palette[0], // Imprint palette pos 1 — brand green #009E73
      opacity: 0.09,       // low opacity: 160 overlapping traces build density
      showInLegend: false,
    });
  }
}

Highcharts.chart("container", {
  chart: {
    backgroundColor: "transparent",
    animation: false,
    style: { fontFamily: "inherit" },
  },
  credits: { enabled: false },
  colors: t.palette,
  title: {
    text: "eye-diagram-basic · javascript · highcharts · anyplot.ai",
    style: { color: t.ink, fontSize: "22px", fontWeight: "600" },
  },
  xAxis: {
    title: {
      text: "Time (UI)",
      style: { color: t.inkSoft, fontSize: "16px" },
    },
    min: 0,
    max: 2,
    tickInterval: 0.5,
    lineColor: t.inkSoft,
    tickColor: t.inkSoft,
    gridLineColor: t.grid,
    gridLineWidth: 1,
    labels: { style: { color: t.inkSoft, fontSize: "14px" } },
  },
  yAxis: {
    title: {
      text: "Voltage (V)",
      style: { color: t.inkSoft, fontSize: "16px" },
    },
    min: -0.1,
    max: 1.1,
    tickInterval: 0.25,
    gridLineColor: t.grid,
    lineColor: t.inkSoft,
    labels: { style: { color: t.inkSoft, fontSize: "14px" } },
    plotLines: [{
      value: 0.5,
      color: t.inkSoft,
      width: 1.5,
      dashStyle: "Dash",
      label: {
        text: "Decision level",
        style: { color: t.inkSoft, fontSize: "12px" },
        align: "right",
        x: -8,
        y: -6,
      },
    }],
  },
  legend: { enabled: false },
  plotOptions: {
    series: {
      animation: false,
      turboThreshold: 0,
      enableMouseTracking: false,
      states: {
        hover: { enabled: false },
        inactive: { opacity: 1 },
      },
    },
    line: {
      marker: { enabled: false },
    },
  },
  series: allSeries,
});
Runnable source as JSON, for any HTTP client: https://api.anyplot.ai/specs/eye-diagram-basic/highcharts/code. Any spec id and library id listed in llms-full.txt fit the same URL shape; every URL below is complete and callable.
{
  "spec_id": "eye-diagram-basic",
  "language": "javascript",
  "library": "highcharts",
  "page": "https://anyplot.ai/eye-diagram-basic/javascript/highcharts",
  "hub": "https://anyplot.ai/eye-diagram-basic",
  "code_json": "https://api.anyplot.ai/specs/eye-diagram-basic/highcharts/code",
  "spec_json": "https://api.anyplot.ai/specs/eye-diagram-basic",
  "render_light_png": "https://storage.googleapis.com/anyplot-images/plots/eye-diagram-basic/javascript/highcharts/plot-light.png",
  "render_dark_png": "https://storage.googleapis.com/anyplot-images/plots/eye-diagram-basic/javascript/highcharts/plot-dark.png",
  "interactive_light_html": "https://storage.googleapis.com/anyplot-images/plots/eye-diagram-basic/javascript/highcharts/plot-light.html",
  "interactive_dark_html": "https://storage.googleapis.com/anyplot-images/plots/eye-diagram-basic/javascript/highcharts/plot-dark.html",
  "quality_score": 90.0,
  "license": "MIT",
  "guide": "https://anyplot.ai/llms.txt"
}
Part of Signal Integrity Eye Diagram on anyplot.ai.