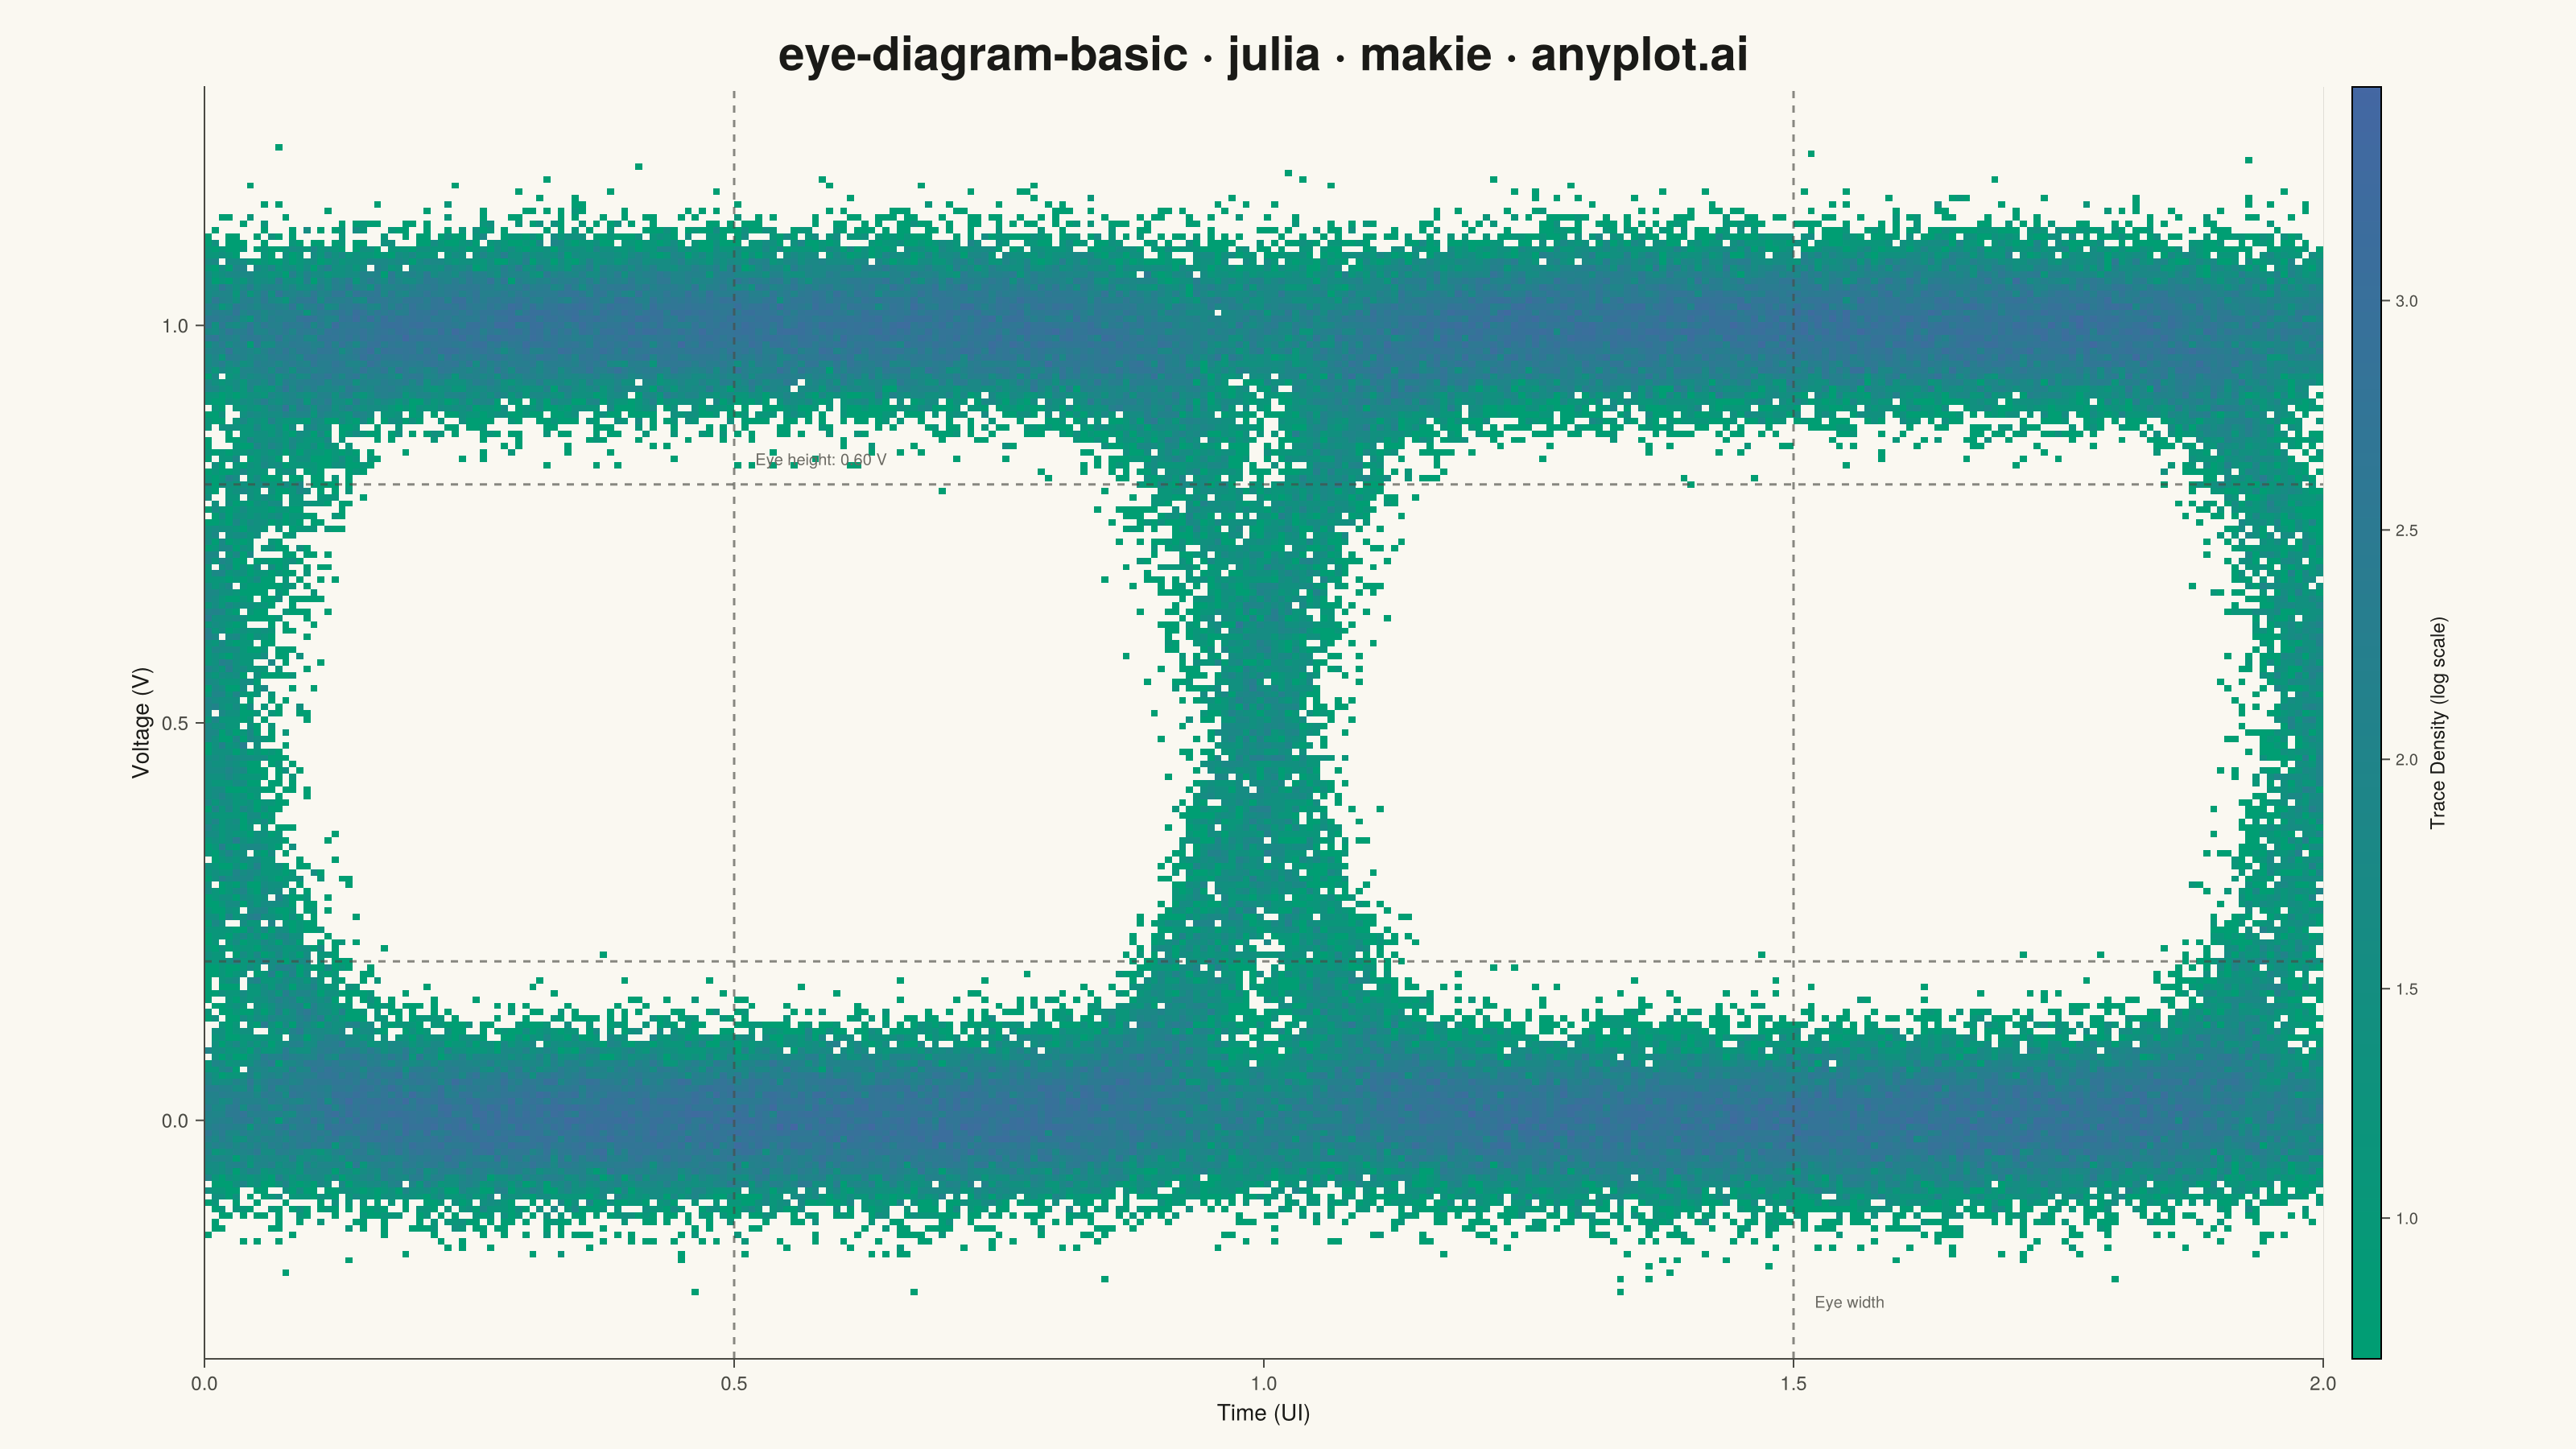
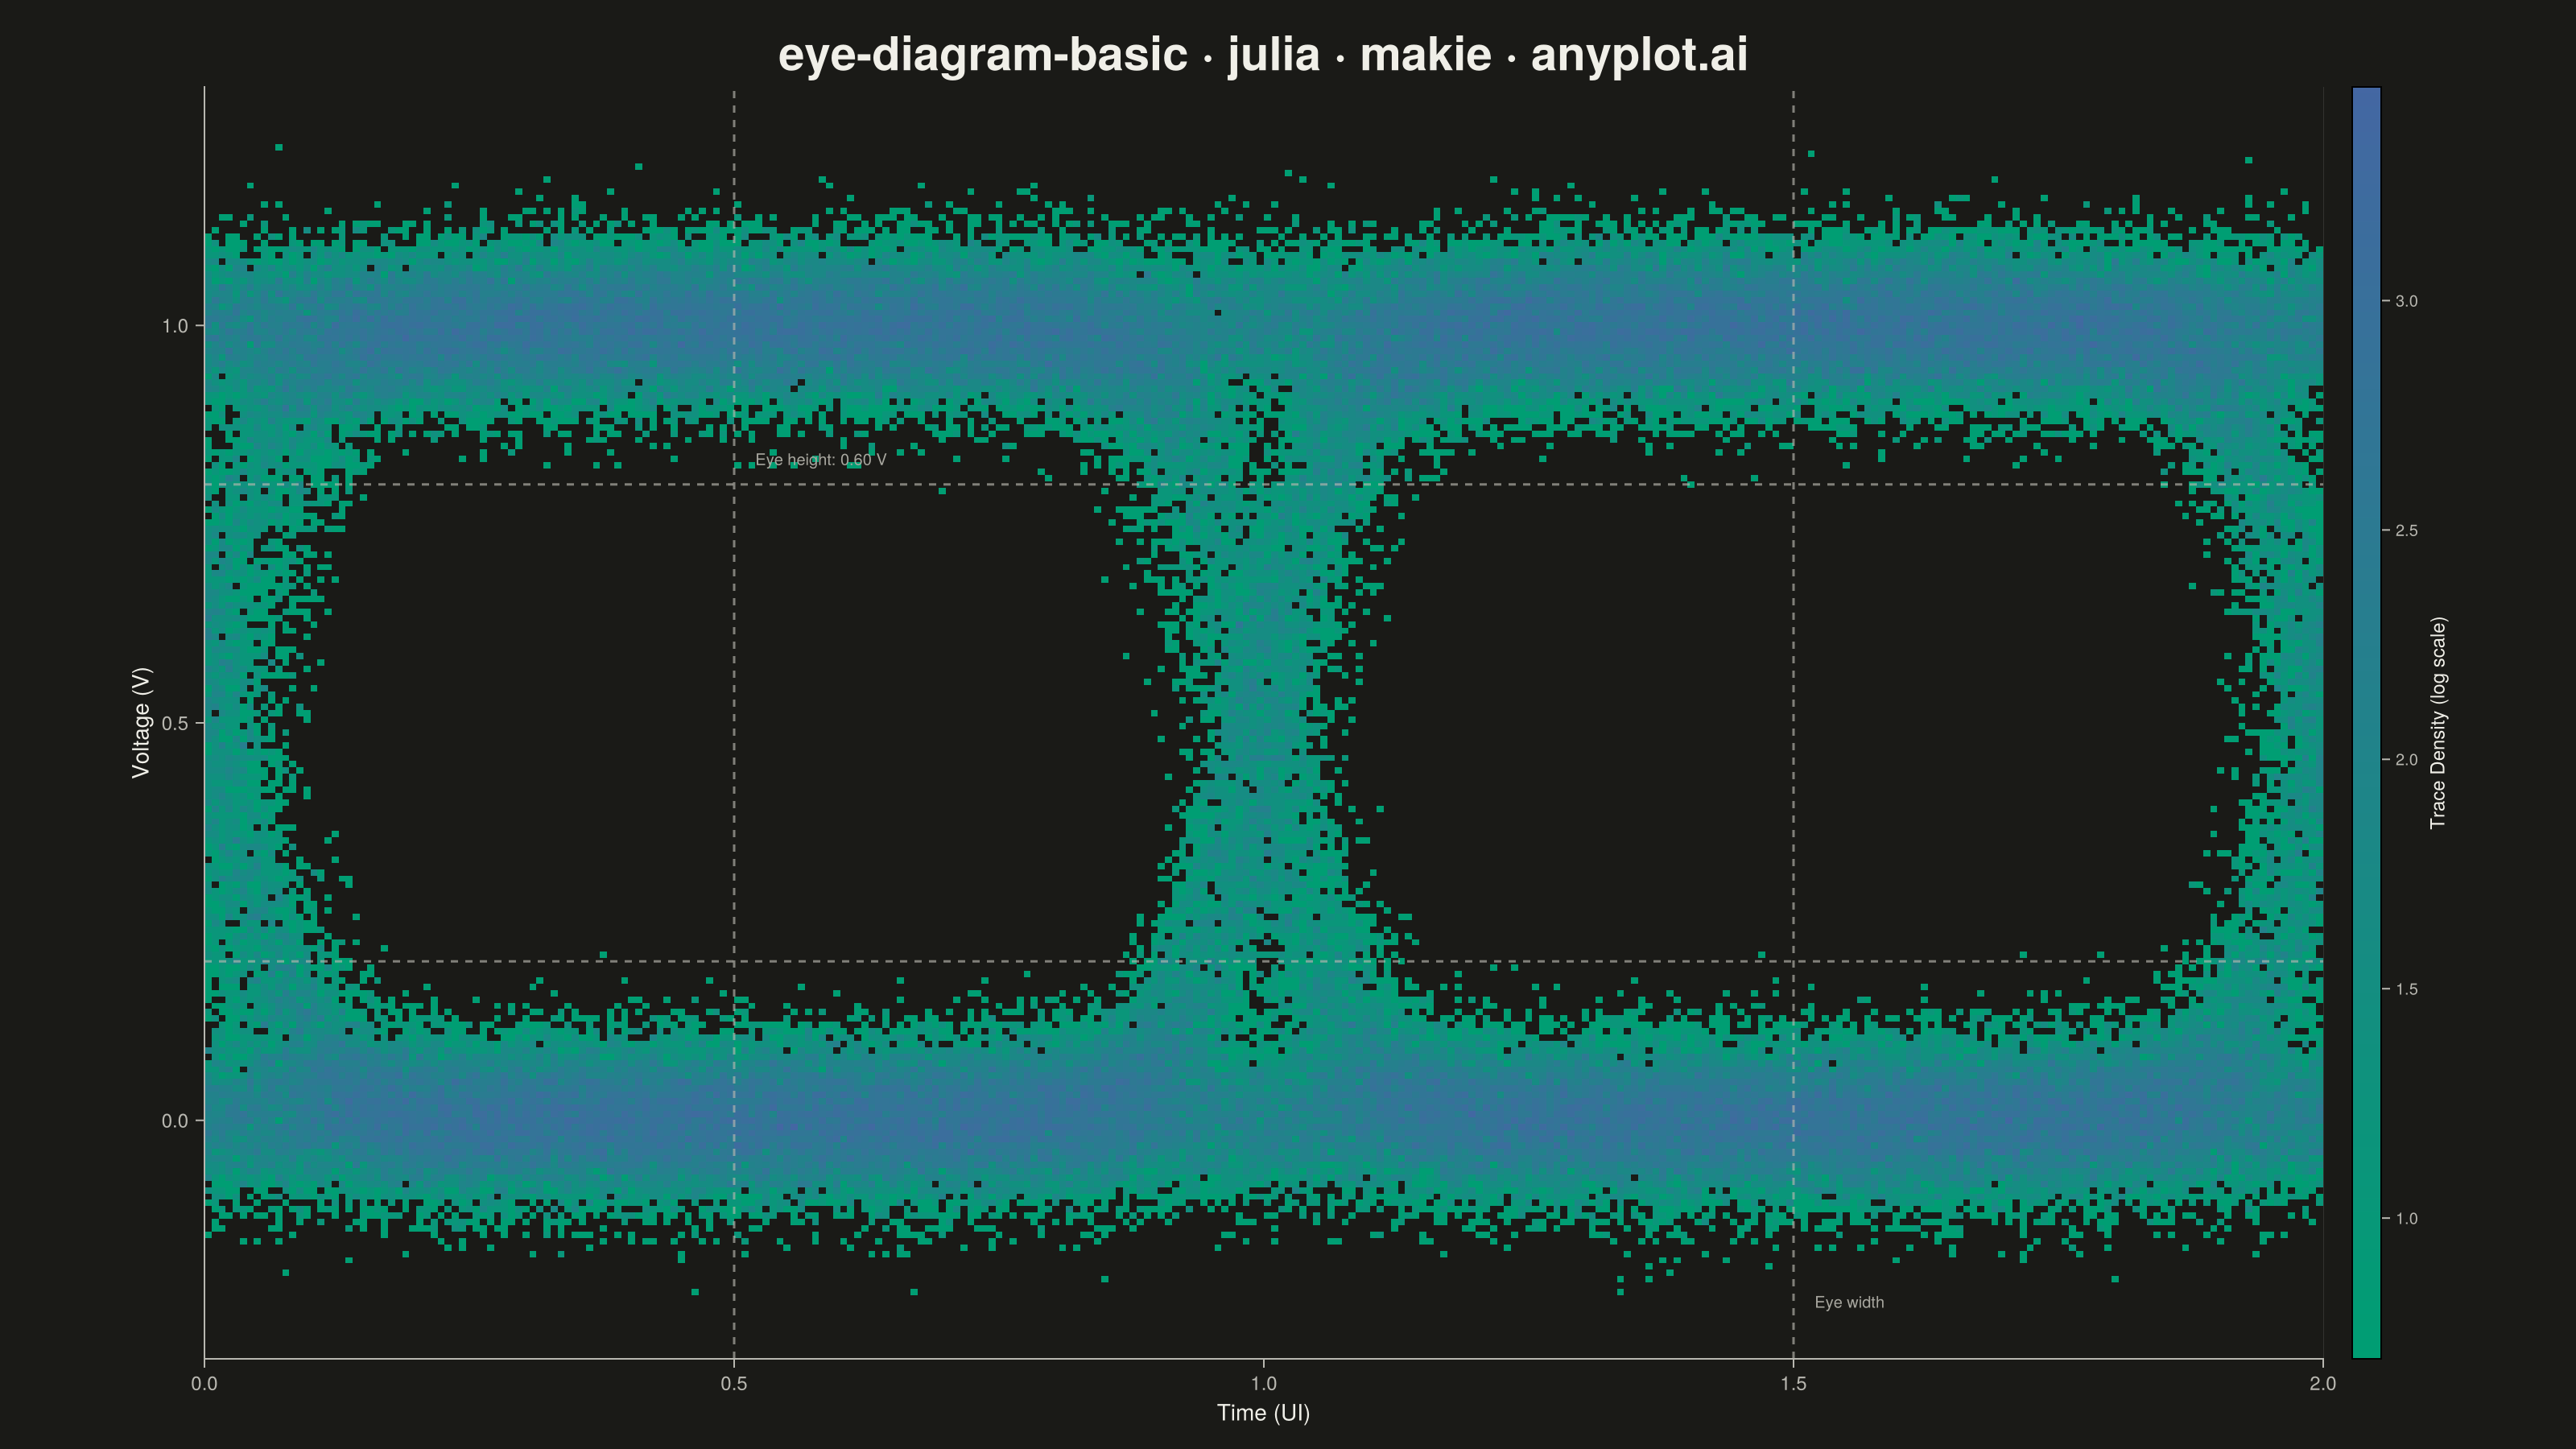
An eye diagram visualizes signal integrity by overlaying many periods of a digital signal onto a single time window spanning 1-2 unit intervals (UI). The overlapping traces form a characteristic eye-shaped opening whose height, width, and clarity reveal signal quality metrics such as jitter, noise, and inter-symbol interference (ISI). A wide-open eye indicates clean signal transmission, while a closed or blurred eye signals degradation.
# anyplot.ai
# eye-diagram-basic: Signal Integrity Eye Diagram
# Library: makie 0.22.10 | Julia 1.11.9
# Quality: 90/100 | Created: 2026-06-18

using CairoMakie
using Colors
using Random

Random.seed!(42)

# --- Theme tokens ------------------------------------------------------------
const THEME       = get(ENV, "ANYPLOT_THEME", "light")
const PAGE_BG     = THEME == "light" ? colorant"#FAF8F1" : colorant"#1A1A17"
const ELEVATED_BG = THEME == "light" ? colorant"#FFFDF6" : colorant"#242420"
const INK         = THEME == "light" ? colorant"#1A1A17" : colorant"#F0EFE8"
const INK_SOFT    = THEME == "light" ? colorant"#4A4A44" : colorant"#B8B7B0"
const INK_MUTED   = THEME == "light" ? colorant"#6B6A63" : colorant"#A8A79F"

# Imprint sequential colormap: brand green → blue (density)
const ANYPLOT_SEQ = cgrad([colorant"#009E73", colorant"#4467A3"])

# --- Simulation parameters --------------------------------------------------
const N_TRACES       = 500    # overlaid NRZ bit periods (spec: 200–500)
const SAMPLES_PER_UI = 150    # time samples per unit interval
const JITTER_SIGMA   = 0.03   # transition timing jitter (fraction of UI)
const NOISE_SIGMA    = 0.05   # additive Gaussian noise amplitude (V)
const N_BINS_T       = 300    # histogram bins along time axis
const N_BINS_V       = 200    # histogram bins along voltage axis
const V_MIN          = -0.30
const V_MAX          =  1.30
const T_STEP         = 2.0 / N_BINS_T
const V_STEP         = (V_MAX - V_MIN) / N_BINS_V

# --- Data: generate NRZ eye diagram traces ----------------------------------
t_base = collect(range(0.0, 2.0, length = 2 * SAMPLES_PER_UI))
n_t    = length(t_base)

all_t = Vector{Float64}(undef, N_TRACES * n_t)
all_v = Vector{Float64}(undef, N_TRACES * n_t)

for trace_idx in 1:N_TRACES
    offset = (trace_idx - 1) * n_t

    # 4 random NRZ bits: [pre-window, bit0, bit1, post-window]
    bits = rand(Bool, 4)

    # Build waveform: start from bits[1] level
    v = fill(Float64(bits[1]), n_t)

    # Accumulate bandwidth-limited sigmoid transitions at t = 0, 1, 2 UI
    for b in 2:4
        if bits[b] != bits[b - 1]
            delta   = Float64(bits[b]) - Float64(bits[b - 1])
            t_trans = Float64(b - 2) + randn() * JITTER_SIGMA
            @. v += delta / (1.0 + exp(-25.0 * (t_base - t_trans)))
        end
    end

    # Additive Gaussian noise
    v .+= randn(n_t) .* NOISE_SIGMA

    all_t[(offset + 1):(offset + n_t)] .= t_base
    all_v[(offset + 1):(offset + n_t)]  = v
end

# --- 2D density histogram ---------------------------------------------------
t_centers = collect(range(T_STEP / 2, 2.0 - T_STEP / 2, length = N_BINS_T))
v_centers = collect(range(V_MIN + V_STEP / 2, V_MAX - V_STEP / 2, length = N_BINS_V))

density = zeros(Int, N_BINS_T, N_BINS_V)
for i in eachindex(all_t)
    ti = clamp(floor(Int, all_t[i] / T_STEP) + 1, 1, N_BINS_T)
    vi = clamp(floor(Int, (all_v[i] - V_MIN) / V_STEP) + 1, 1, N_BINS_V)
    density[ti, vi] += 1
end

# Log-scale density; empty cells → NaN (renders as background in heatmap)
density_log = [density[i, j] > 0 ? log1p(Float64(density[i, j])) : NaN
               for i in 1:N_BINS_T, j in 1:N_BINS_V]

# --- Plot -------------------------------------------------------------------
const TITLE_STR  = "eye-diagram-basic · julia · makie · anyplot.ai"
const TITLE_SIZE = max(16, round(Int, 20 * 67 / length(TITLE_STR)))

fig = Figure(
    size            = (1600, 900),
    fontsize        = 14,
    backgroundcolor = PAGE_BG,
)

ax = Axis(
    fig[1, 1];
    title             = TITLE_STR,
    titlesize         = TITLE_SIZE,
    titlecolor        = INK,
    xlabel            = "Time (UI)",
    ylabel            = "Voltage (V)",
    xlabelsize        = 14,
    ylabelsize        = 14,
    xlabelcolor       = INK,
    ylabelcolor       = INK,
    xticklabelsize    = 12,
    yticklabelsize    = 12,
    xticklabelcolor   = INK_SOFT,
    yticklabelcolor   = INK_SOFT,
    xtickcolor        = INK_SOFT,
    ytickcolor        = INK_SOFT,
    backgroundcolor   = PAGE_BG,
    topspinevisible   = false,
    rightspinevisible = false,
    leftspinecolor    = INK_SOFT,
    bottomspinecolor  = INK_SOFT,
    xgridcolor        = RGBAf(INK.r, INK.g, INK.b, 0.12),
    ygridcolor        = RGBAf(INK.r, INK.g, INK.b, 0.12),
    xminorgridvisible = false,
    yminorgridvisible = false,
    xticks            = [0.0, 0.5, 1.0, 1.5, 2.0],
    yticks            = [0.0, 0.5, 1.0],
)

hm = heatmap!(ax, t_centers, v_centers, density_log;
    colormap  = ANYPLOT_SEQ,
    nan_color = PAGE_BG,
)

# Eye opening reference lines (spec: "Optionally annotate eye height and eye width")
const ANNOT_COLOR = RGBAf(INK_SOFT.r, INK_SOFT.g, INK_SOFT.b, 0.65)
# Eye height: 20% and 80% voltage boundaries (NRZ: 0–1 V amplitude)
hlines!(ax, [0.20, 0.80];
    color     = ANNOT_COLOR,
    linewidth = 1.5,
    linestyle = :dash,
)
# Eye width: center of each eye opening at 0.5 and 1.5 UI
vlines!(ax, [0.5, 1.5];
    color     = ANNOT_COLOR,
    linewidth = 1.5,
    linestyle = :dash,
)
text!(ax, 0.52, 0.82; text = "Eye height: 0.60 V", color = INK_MUTED,
    fontsize = 10, align = (:left, :bottom))
text!(ax, 1.52, -0.24; text = "Eye width", color = INK_MUTED,
    fontsize = 10, align = (:left, :bottom))

Colorbar(fig[1, 2], hm;
    label          = "Trace Density (log scale)",
    labelsize      = 12,
    ticklabelsize  = 10,
    labelcolor     = INK,
    ticklabelcolor = INK_SOFT,
    tickcolor      = INK_SOFT,
    width          = 18,
)

xlims!(ax, 0.0, 2.0)
ylims!(ax, V_MIN, V_MAX)
colsize!(fig.layout, 1, Relative(0.90))

# --- Save -------------------------------------------------------------------
save("plot-$(THEME).png", fig; px_per_unit = 2)
Runnable source as JSON, for any HTTP client: https://api.anyplot.ai/specs/eye-diagram-basic/makie/code. Any spec id and library id listed in llms-full.txt fit the same URL shape; every URL below is complete and callable.
{
  "spec_id": "eye-diagram-basic",
  "language": "julia",
  "library": "makie",
  "page": "https://anyplot.ai/eye-diagram-basic/julia/makie",
  "hub": "https://anyplot.ai/eye-diagram-basic",
  "code_json": "https://api.anyplot.ai/specs/eye-diagram-basic/makie/code",
  "spec_json": "https://api.anyplot.ai/specs/eye-diagram-basic",
  "render_light_png": "https://storage.googleapis.com/anyplot-images/plots/eye-diagram-basic/julia/makie/plot-light.png",
  "render_dark_png": "https://storage.googleapis.com/anyplot-images/plots/eye-diagram-basic/julia/makie/plot-dark.png",
  "quality_score": 90.0,
  "license": "MIT",
  "guide": "https://anyplot.ai/llms.txt"
}
Part of Signal Integrity Eye Diagram on anyplot.ai.