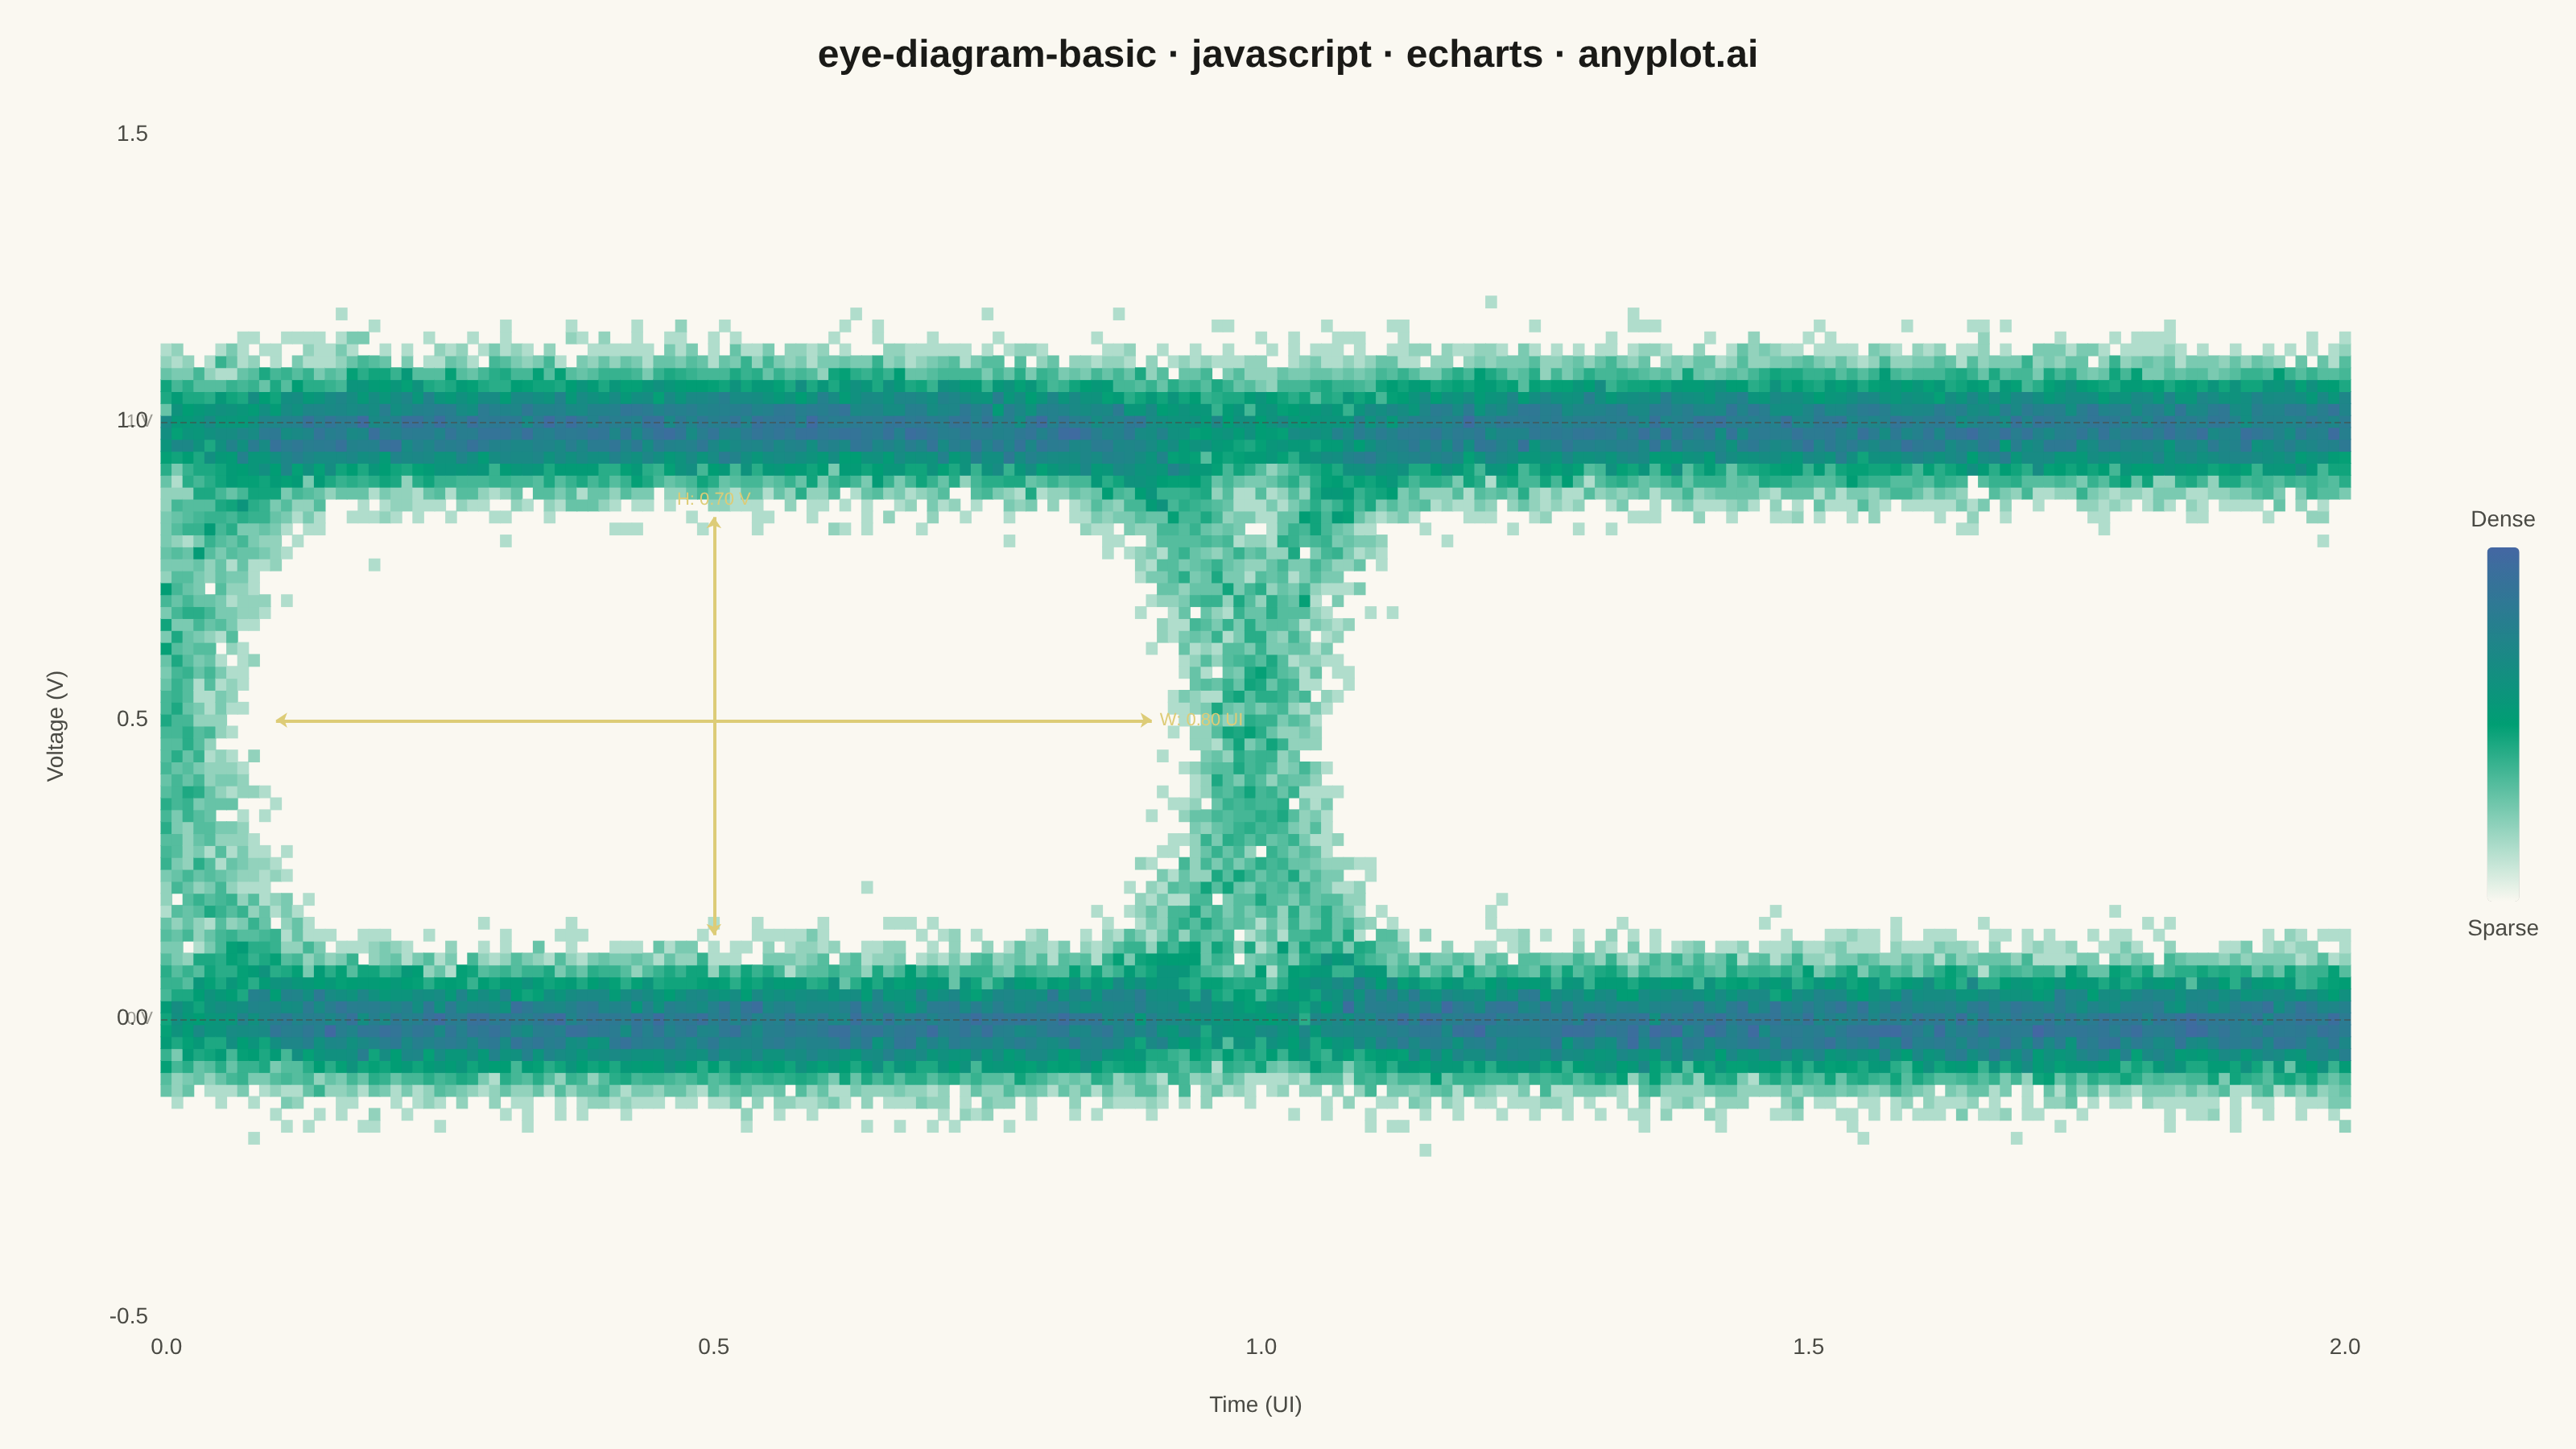
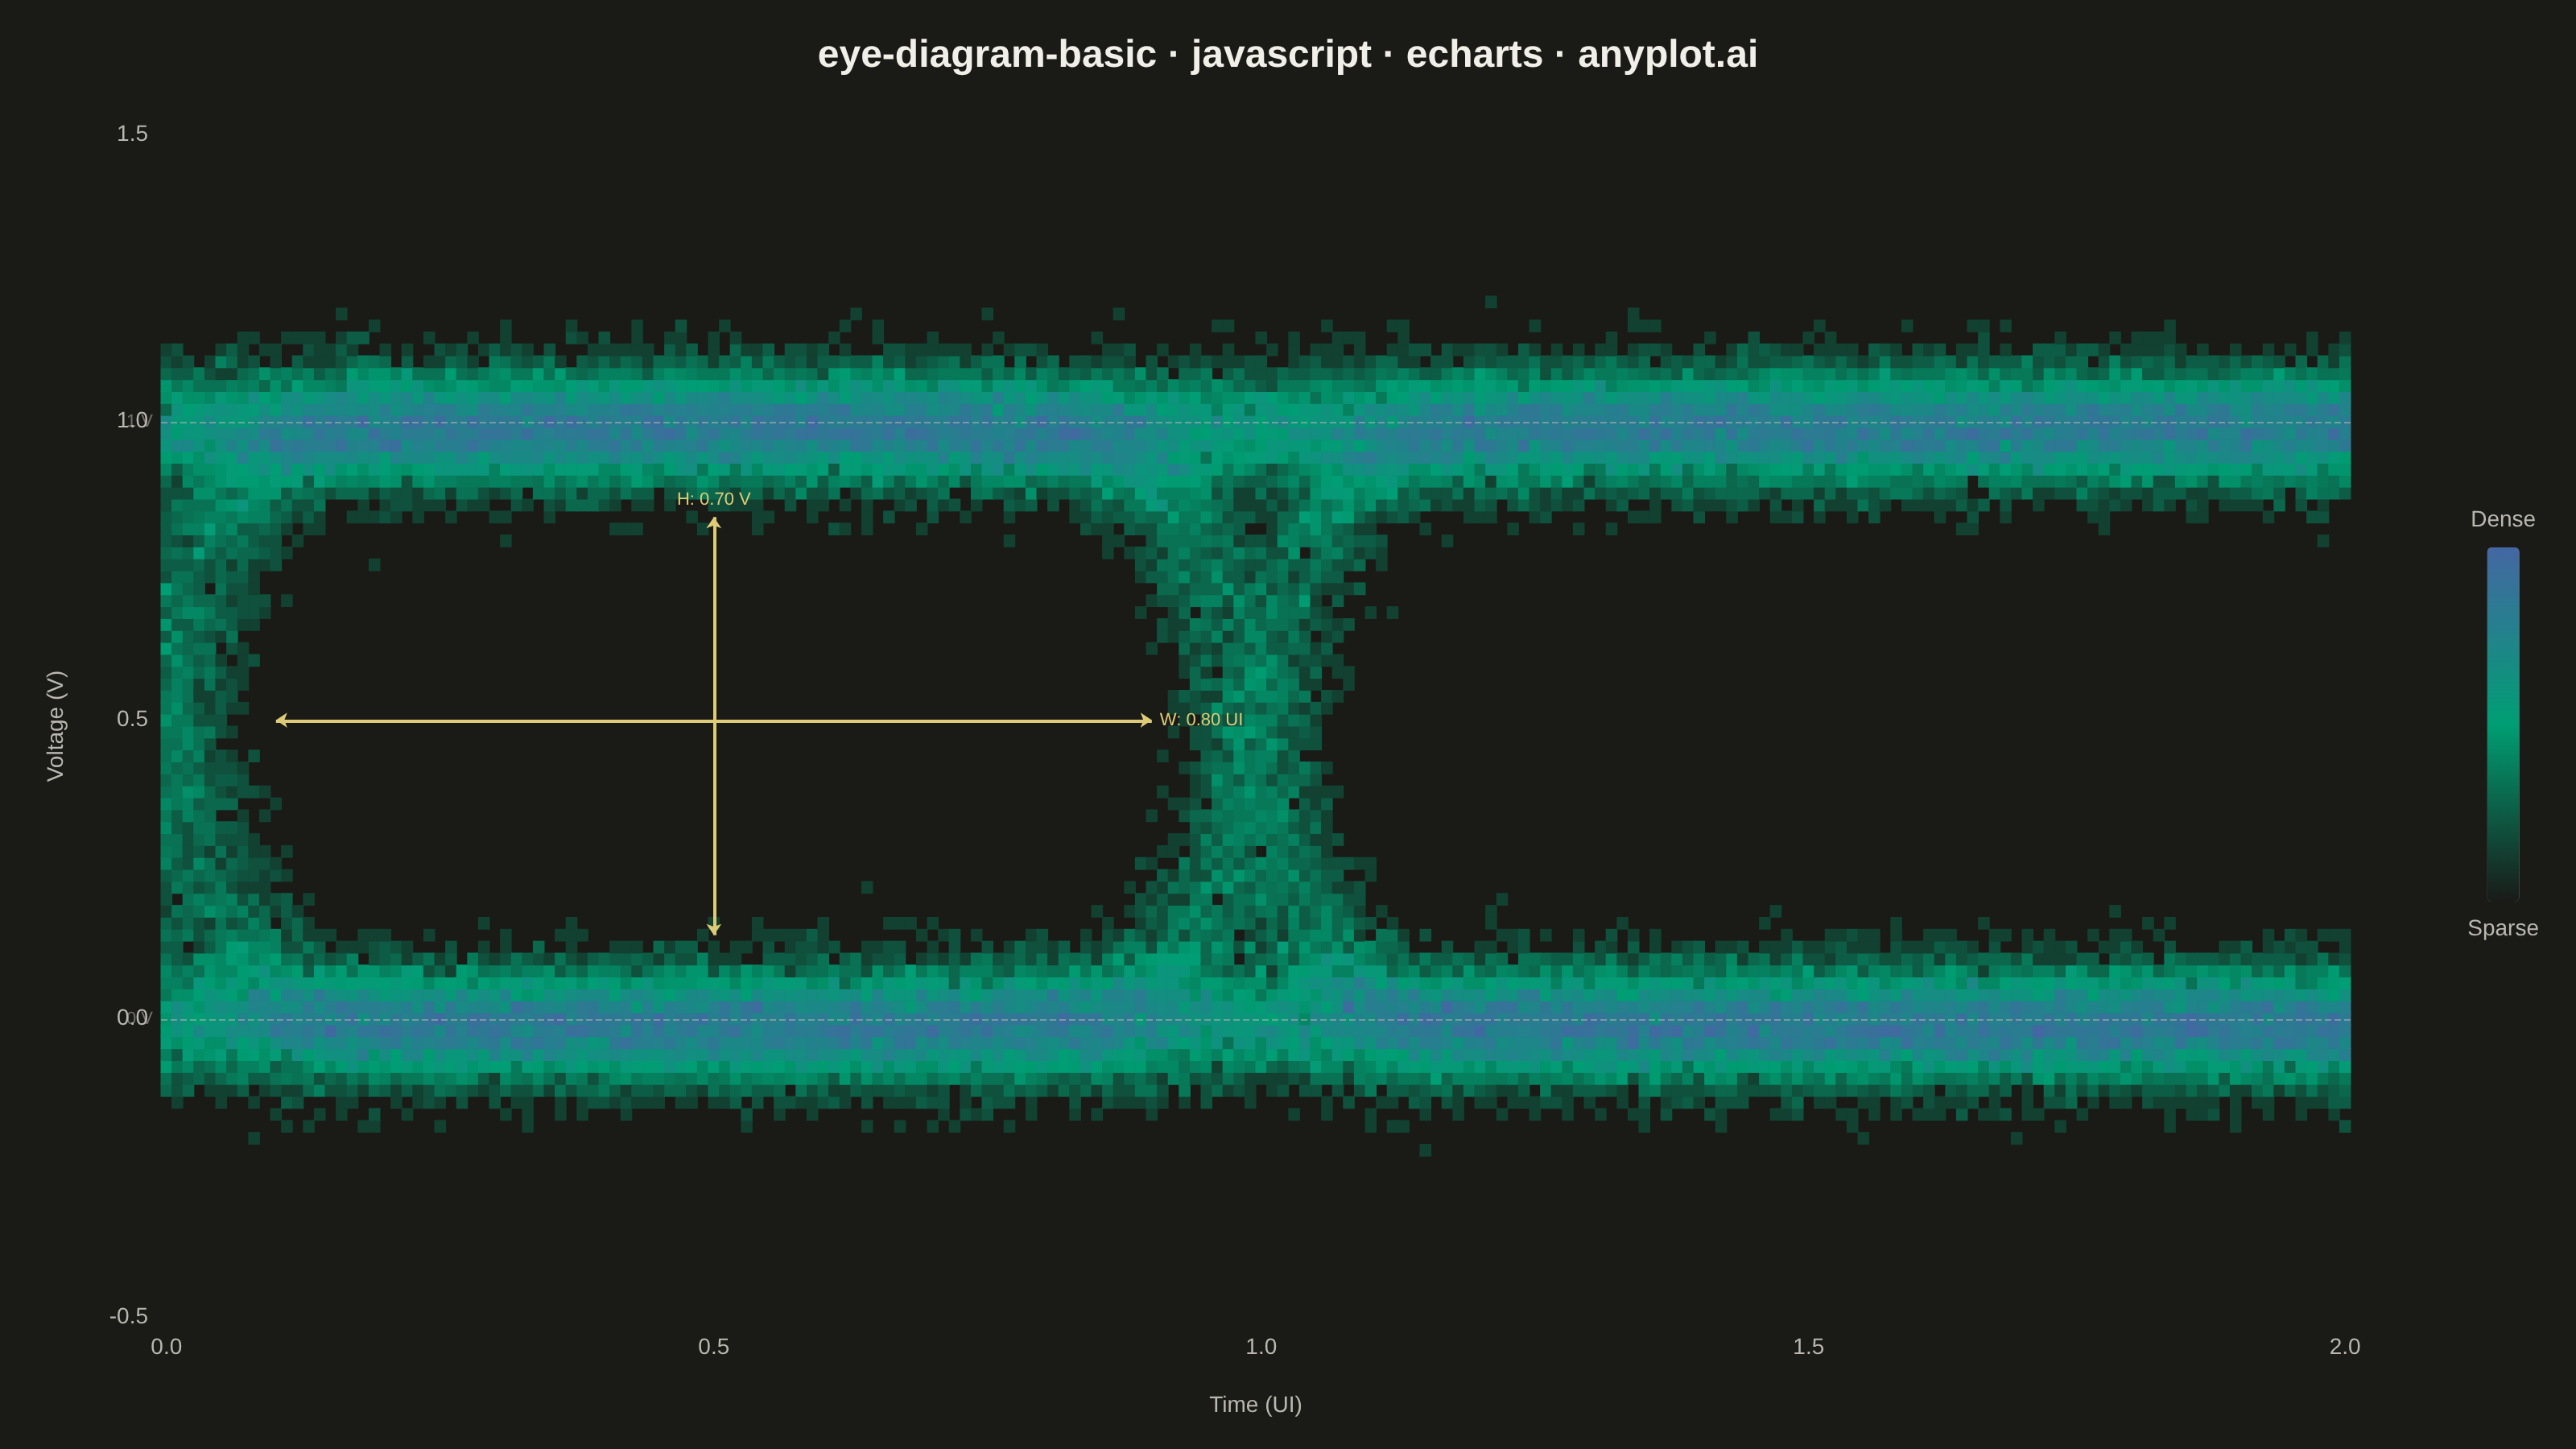
An eye diagram visualizes signal integrity by overlaying many periods of a digital signal onto a single time window spanning 1-2 unit intervals (UI). The overlapping traces form a characteristic eye-shaped opening whose height, width, and clarity reveal signal quality metrics such as jitter, noise, and inter-symbol interference (ISI). A wide-open eye indicates clean signal transmission, while a closed or blurred eye signals degradation.
// anyplot.ai
// eye-diagram-basic: Signal Integrity Eye Diagram
// Library: echarts 5.5.1 | JavaScript 22.22.3
// Quality: 85/100 | Created: 2026-06-18

const t = window.ANYPLOT_TOKENS;

// Seeded LCG for deterministic data generation (no Date.now / Math.random)
let _s = 42;
function lcg() {
  _s = (_s * 1664525 + 1013904223) >>> 0;
  return _s / 4294967296;
}
function gauss() {
  const u = Math.max(lcg(), 1e-10);
  return Math.sqrt(-2 * Math.log(u)) * Math.cos(2 * Math.PI * lcg());
}

// NRZ signal parameters
const NUM_TRACES   = 400;   // overlaid signal periods
const SAMPLES      = 200;   // time-samples per trace across 2 UI
const NOISE_SIGMA  = 0.05;  // additive Gaussian noise (5% of amplitude)
const JITTER_SIGMA = 0.03;  // timing jitter per transition (3% of UI)

// 2-D density grid
const T_BINS = 200;
const V_BINS = 100;
const T_MIN = 0,    T_MAX = 2;    // 0–2 unit intervals
const V_MIN = -0.5, V_MAX = 1.5;  // -0.5 V to 1.5 V (NRZ logic levels 0 V / 1 V)

const grid = new Uint32Array(T_BINS * V_BINS);

// Sigmoid for bandwidth-limited bit transitions
function sig(x, center) {
  return 1 / (1 + Math.exp(-30 * (x - center)));
}

// Generate traces: each trace uses three random bits [b0, b1, b2] across 2 UI
for (let tr = 0; tr < NUM_TRACES; tr++) {
  const b0 = lcg() < 0.5 ? 0 : 1;
  const b1 = lcg() < 0.5 ? 0 : 1;
  const b2 = lcg() < 0.5 ? 0 : 1;
  const j0 = gauss() * JITTER_SIGMA;
  const j1 = gauss() * JITTER_SIGMA;

  for (let s = 0; s < SAMPLES; s++) {
    const tVal = T_MIN + (s / (SAMPLES - 1)) * (T_MAX - T_MIN);
    const vVal =
      b0 + (b1 - b0) * sig(tVal, 0 + j0)
         + (b2 - b1) * sig(tVal, 1 + j1)
         + gauss() * NOISE_SIGMA;

    const ti = Math.min(T_BINS - 1, Math.max(0,
      Math.floor(((tVal - T_MIN) / (T_MAX - T_MIN)) * T_BINS)));
    const vi = Math.min(V_BINS - 1, Math.max(0,
      Math.floor(((vVal - V_MIN) / (V_MAX - V_MIN)) * V_BINS)));
    grid[ti * V_BINS + vi]++;
  }
}

// Sqrt-normalize density for better perceptual dynamic range
let maxCount = 0;
for (let i = 0; i < grid.length; i++) if (grid[i] > maxCount) maxCount = grid[i];
const sqrtMax = Math.sqrt(maxCount);

const heatData = [];
for (let ti = 0; ti < T_BINS; ti++) {
  for (let vi = 0; vi < V_BINS; vi++) {
    const c = grid[ti * V_BINS + vi];
    if (c > 0) heatData.push([ti, vi, Math.sqrt(c) / sqrtMax]);
  }
}

// Bin-center label arrays for category axes
const timeLabels = Array.from({ length: T_BINS }, (_, i) =>
  (T_MIN + (i + 0.5) / T_BINS * (T_MAX - T_MIN)).toFixed(3)
);
const voltLabels = Array.from({ length: V_BINS }, (_, i) =>
  (V_MIN + (i + 0.5) / V_BINS * (V_MAX - V_MIN)).toFixed(3)
);

// Eye measurement coordinates — bin-center labels closest to each boundary
// Eye height at mid-bit (t=0.5 UI): ~3σ noise bounds give open region 0.15–0.85 V → 0.70 V
// Eye width at midpoint (v=0.5 V): ~3σ jitter bounds give open region 0.10–0.90 UI → 0.80 UI
const T_EYE_CTR  = timeLabels[50];  // t ≈ 0.505 UI  (center of first bit period)
const V_EYE_LOW  = voltLabels[32];  // v ≈ 0.150 V   (lower eye boundary)
const V_EYE_HIGH = voltLabels[67];  // v ≈ 0.850 V   (upper eye boundary)
const T_EYE_L    = timeLabels[10];  // t ≈ 0.105 UI  (left eye boundary)
const T_EYE_R    = timeLabels[90];  // t ≈ 0.905 UI  (right eye boundary)
const V_MID      = voltLabels[50];  // v ≈ 0.510 V   (midpoint for width measure)
const V_REF0     = voltLabels[25];  // v ≈ 0.010 V   (NRZ low-level reference)
const V_REF1     = voltLabels[75];  // v ≈ 1.010 V   (NRZ high-level reference)

const chart = echarts.init(document.getElementById("container"));

chart.setOption({
  animation: false,
  backgroundColor: "transparent",

  title: {
    text: "eye-diagram-basic · javascript · echarts · anyplot.ai",
    left: "center",
    top: 18,
    textStyle: { color: t.ink, fontSize: 24, fontWeight: "bold" }
  },

  grid: { left: 100, right: 140, top: 80, bottom: 78 },

  xAxis: {
    type: "category",
    data: timeLabels,
    name: "Time (UI)",
    nameLocation: "middle",
    nameGap: 44,
    nameTextStyle: { color: t.inkSoft, fontSize: 14 },
    axisLabel: {
      interval: (idx) => idx % 50 === 0 || idx === T_BINS - 1,
      formatter: (val) => parseFloat(val).toFixed(1),
      color: t.inkSoft,
      fontSize: 14
    },
    axisLine: { show: false },
    axisTick: { show: false },
    splitLine: { show: false }
  },

  yAxis: {
    type: "category",
    data: voltLabels,
    name: "Voltage (V)",
    nameLocation: "middle",
    nameGap: 58,
    nameTextStyle: { color: t.inkSoft, fontSize: 14 },
    axisLabel: {
      interval: (idx) => idx % 25 === 0 || idx === V_BINS - 1,
      formatter: (val) => parseFloat(val).toFixed(1),
      color: t.inkSoft,
      fontSize: 14
    },
    axisLine: { show: false },
    axisTick: { show: false },
    splitLine: { show: false }
  },

  visualMap: {
    type: "continuous",
    min: 0,
    max: 1,
    calculable: false,
    orient: "vertical",
    right: 18,
    top: "center",
    itemHeight: 220,
    text: ["Dense", "Sparse"],
    textStyle: { color: t.inkSoft, fontSize: 14 },
    inRange: { color: [t.pageBg, t.seq[0], t.seq[1]] }
  },

  series: [{
    type: "heatmap",
    data: heatData,
    emphasis: { disabled: true },
    markLine: {
      silent: true,
      animation: false,
      symbol: "none",
      label: { show: false },
      data: [
        // NRZ logic level reference lines (dashed horizontal anchors)
        {
          yAxis: V_REF0,
          lineStyle: { type: "dashed", color: t.inkSoft, width: 1, opacity: 0.55 },
          label: { show: true, formatter: "0 V", position: "start", color: t.inkSoft, fontSize: 11 }
        },
        {
          yAxis: V_REF1,
          lineStyle: { type: "dashed", color: t.inkSoft, width: 1, opacity: 0.55 },
          label: { show: true, formatter: "1 V", position: "start", color: t.inkSoft, fontSize: 11 }
        },
        // Eye height: bidirectional vertical arrow at mid-bit (t ≈ 0.5 UI)
        [
          {
            coord: [T_EYE_CTR, V_EYE_LOW],
            symbol: "arrow", symbolSize: 7,
            lineStyle: { type: "solid", color: t.amber, width: 2 }
          },
          {
            coord: [T_EYE_CTR, V_EYE_HIGH],
            symbol: "arrow", symbolSize: 7,
            label: { show: true, formatter: "H: 0.70 V", color: t.amber, fontSize: 11, position: "end", distance: 5 }
          }
        ],
        // Eye width: bidirectional horizontal arrow at midpoint (v ≈ 0.5 V)
        [
          {
            coord: [T_EYE_L, V_MID],
            symbol: "arrow", symbolSize: 7,
            lineStyle: { type: "solid", color: t.amber, width: 2 }
          },
          {
            coord: [T_EYE_R, V_MID],
            symbol: "arrow", symbolSize: 7,
            label: { show: true, formatter: "W: 0.80 UI", color: t.amber, fontSize: 11, position: "end", distance: 5 }
          }
        ]
      ]
    }
  }]
});
Runnable source as JSON, for any HTTP client: https://api.anyplot.ai/specs/eye-diagram-basic/echarts/code. Any spec id and library id listed in llms-full.txt fit the same URL shape; every URL below is complete and callable.
{
  "spec_id": "eye-diagram-basic",
  "language": "javascript",
  "library": "echarts",
  "page": "https://anyplot.ai/eye-diagram-basic/javascript/echarts",
  "hub": "https://anyplot.ai/eye-diagram-basic",
  "code_json": "https://api.anyplot.ai/specs/eye-diagram-basic/echarts/code",
  "spec_json": "https://api.anyplot.ai/specs/eye-diagram-basic",
  "render_light_png": "https://storage.googleapis.com/anyplot-images/plots/eye-diagram-basic/javascript/echarts/plot-light.png",
  "render_dark_png": "https://storage.googleapis.com/anyplot-images/plots/eye-diagram-basic/javascript/echarts/plot-dark.png",
  "interactive_light_html": "https://storage.googleapis.com/anyplot-images/plots/eye-diagram-basic/javascript/echarts/plot-light.html",
  "interactive_dark_html": "https://storage.googleapis.com/anyplot-images/plots/eye-diagram-basic/javascript/echarts/plot-dark.html",
  "quality_score": 85.0,
  "license": "MIT",
  "guide": "https://anyplot.ai/llms.txt"
}
Part of Signal Integrity Eye Diagram on anyplot.ai.