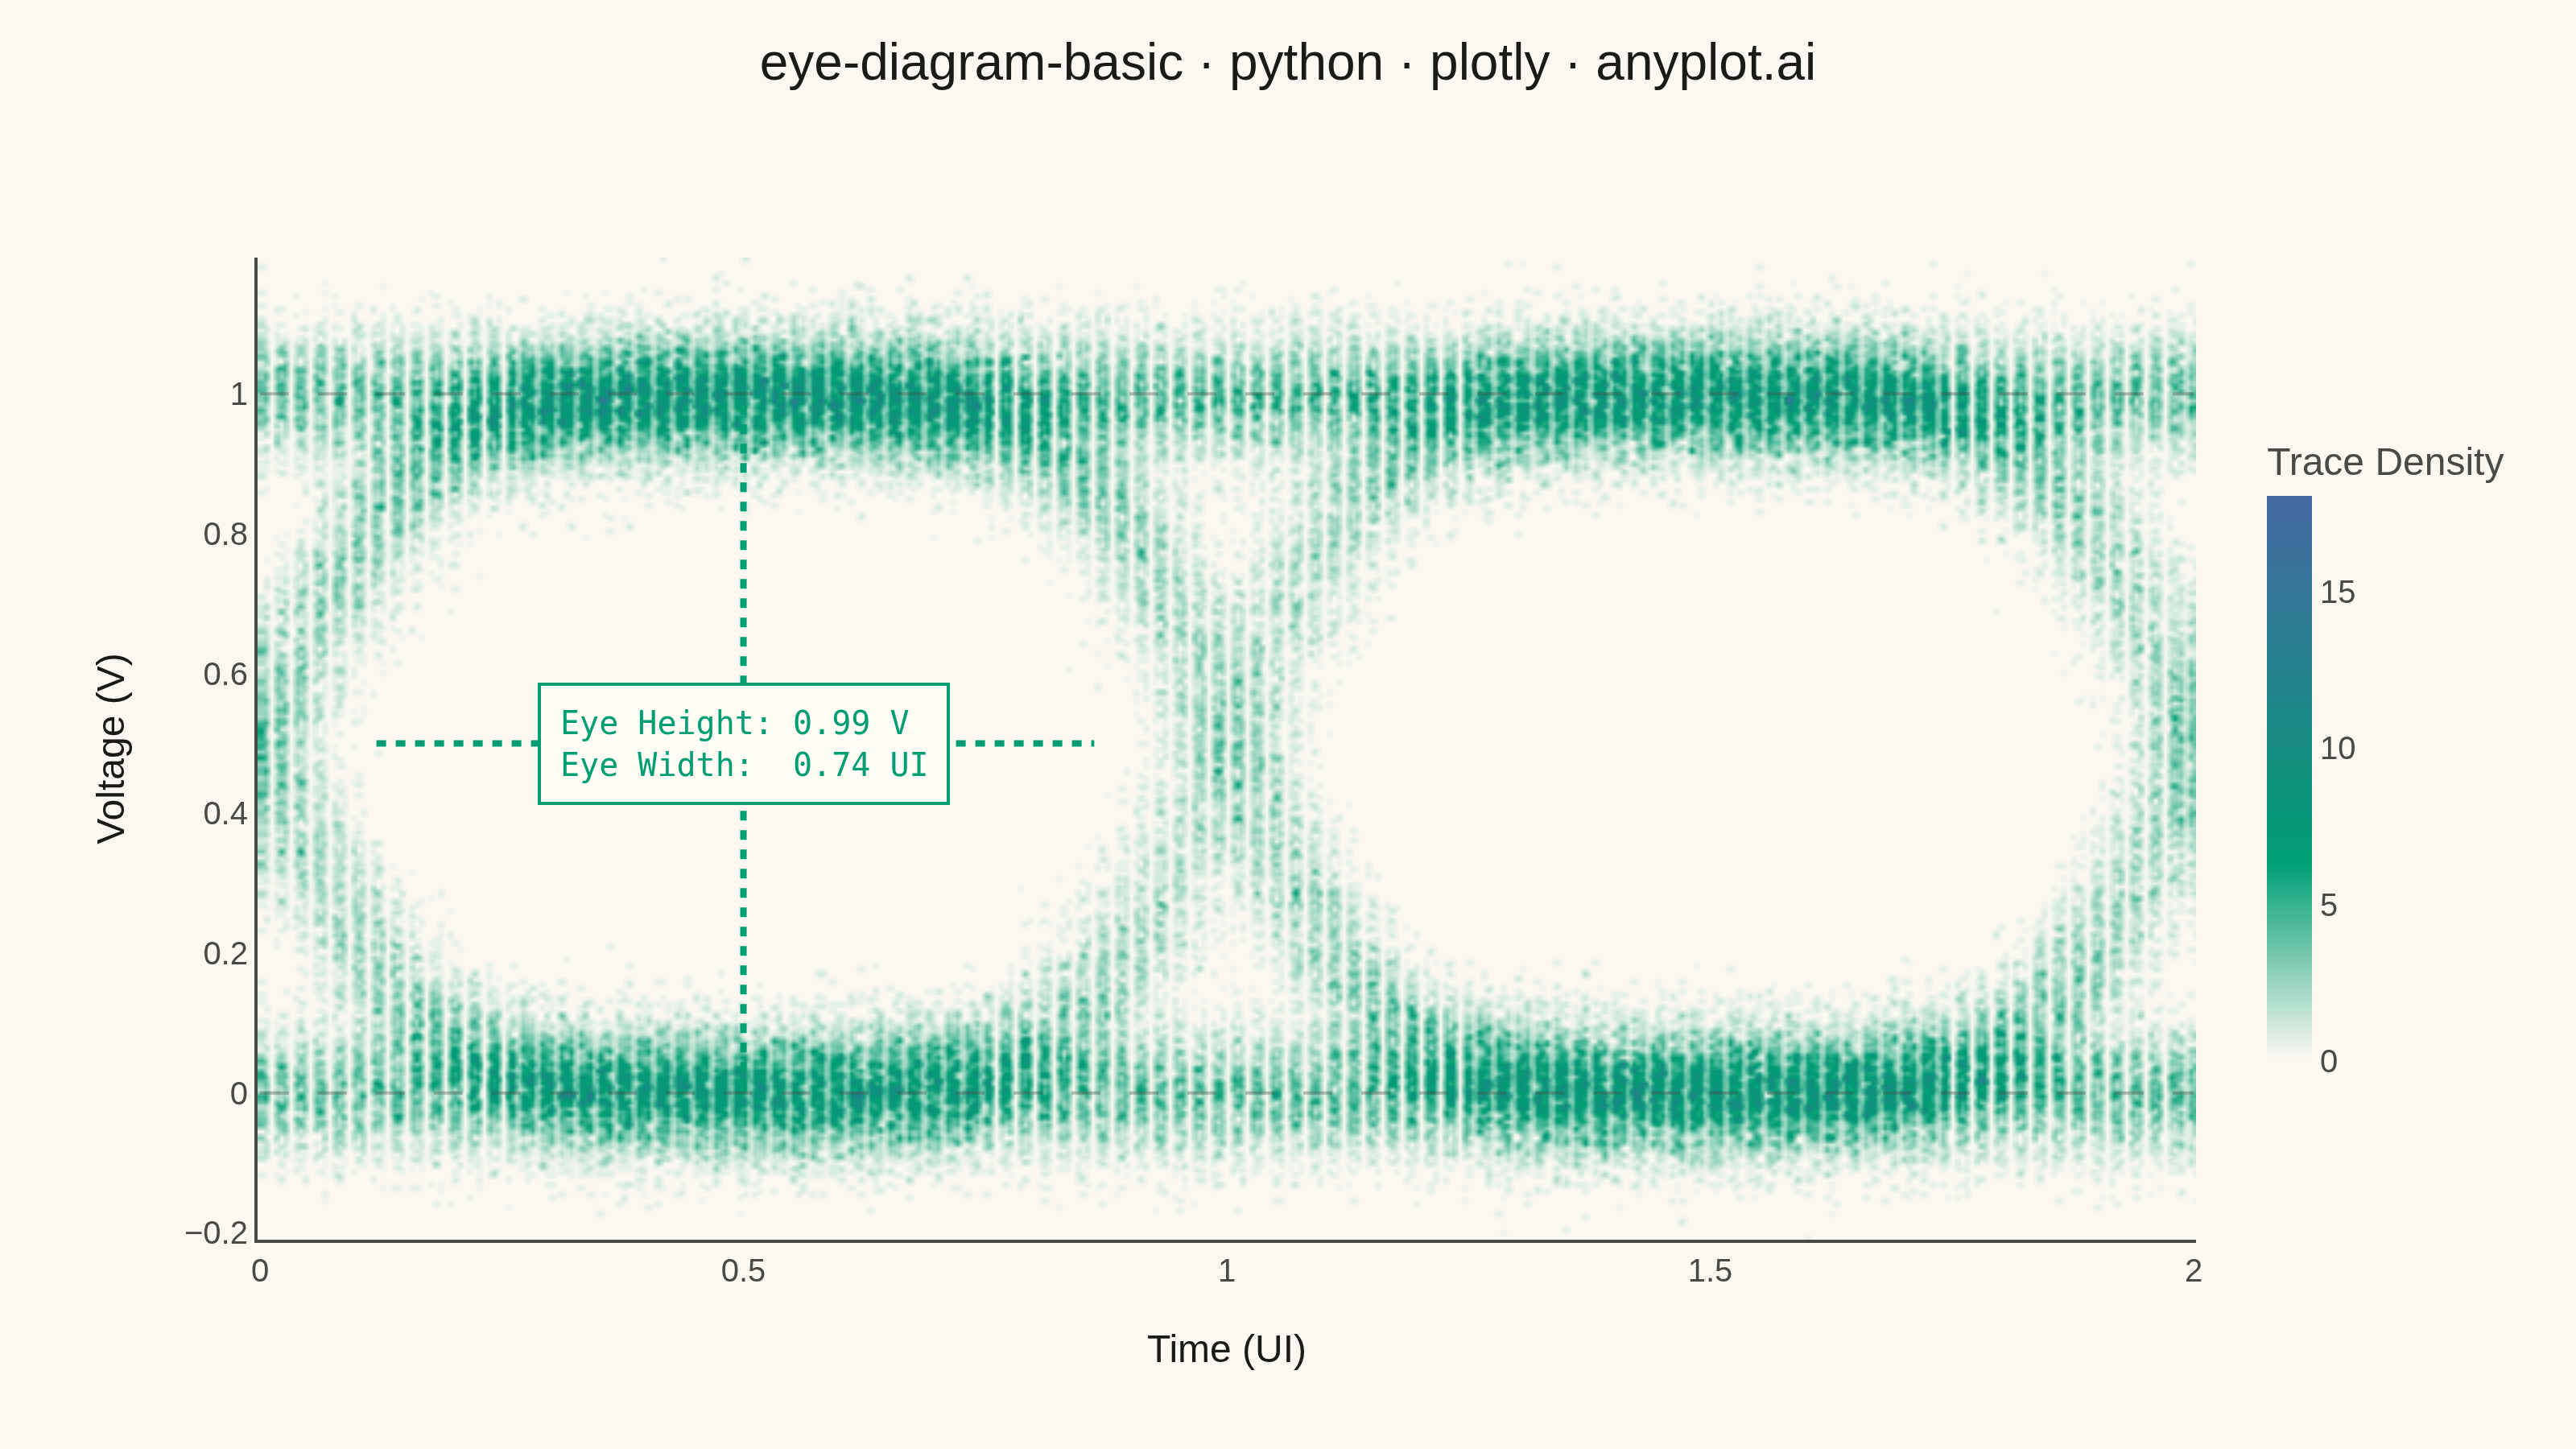
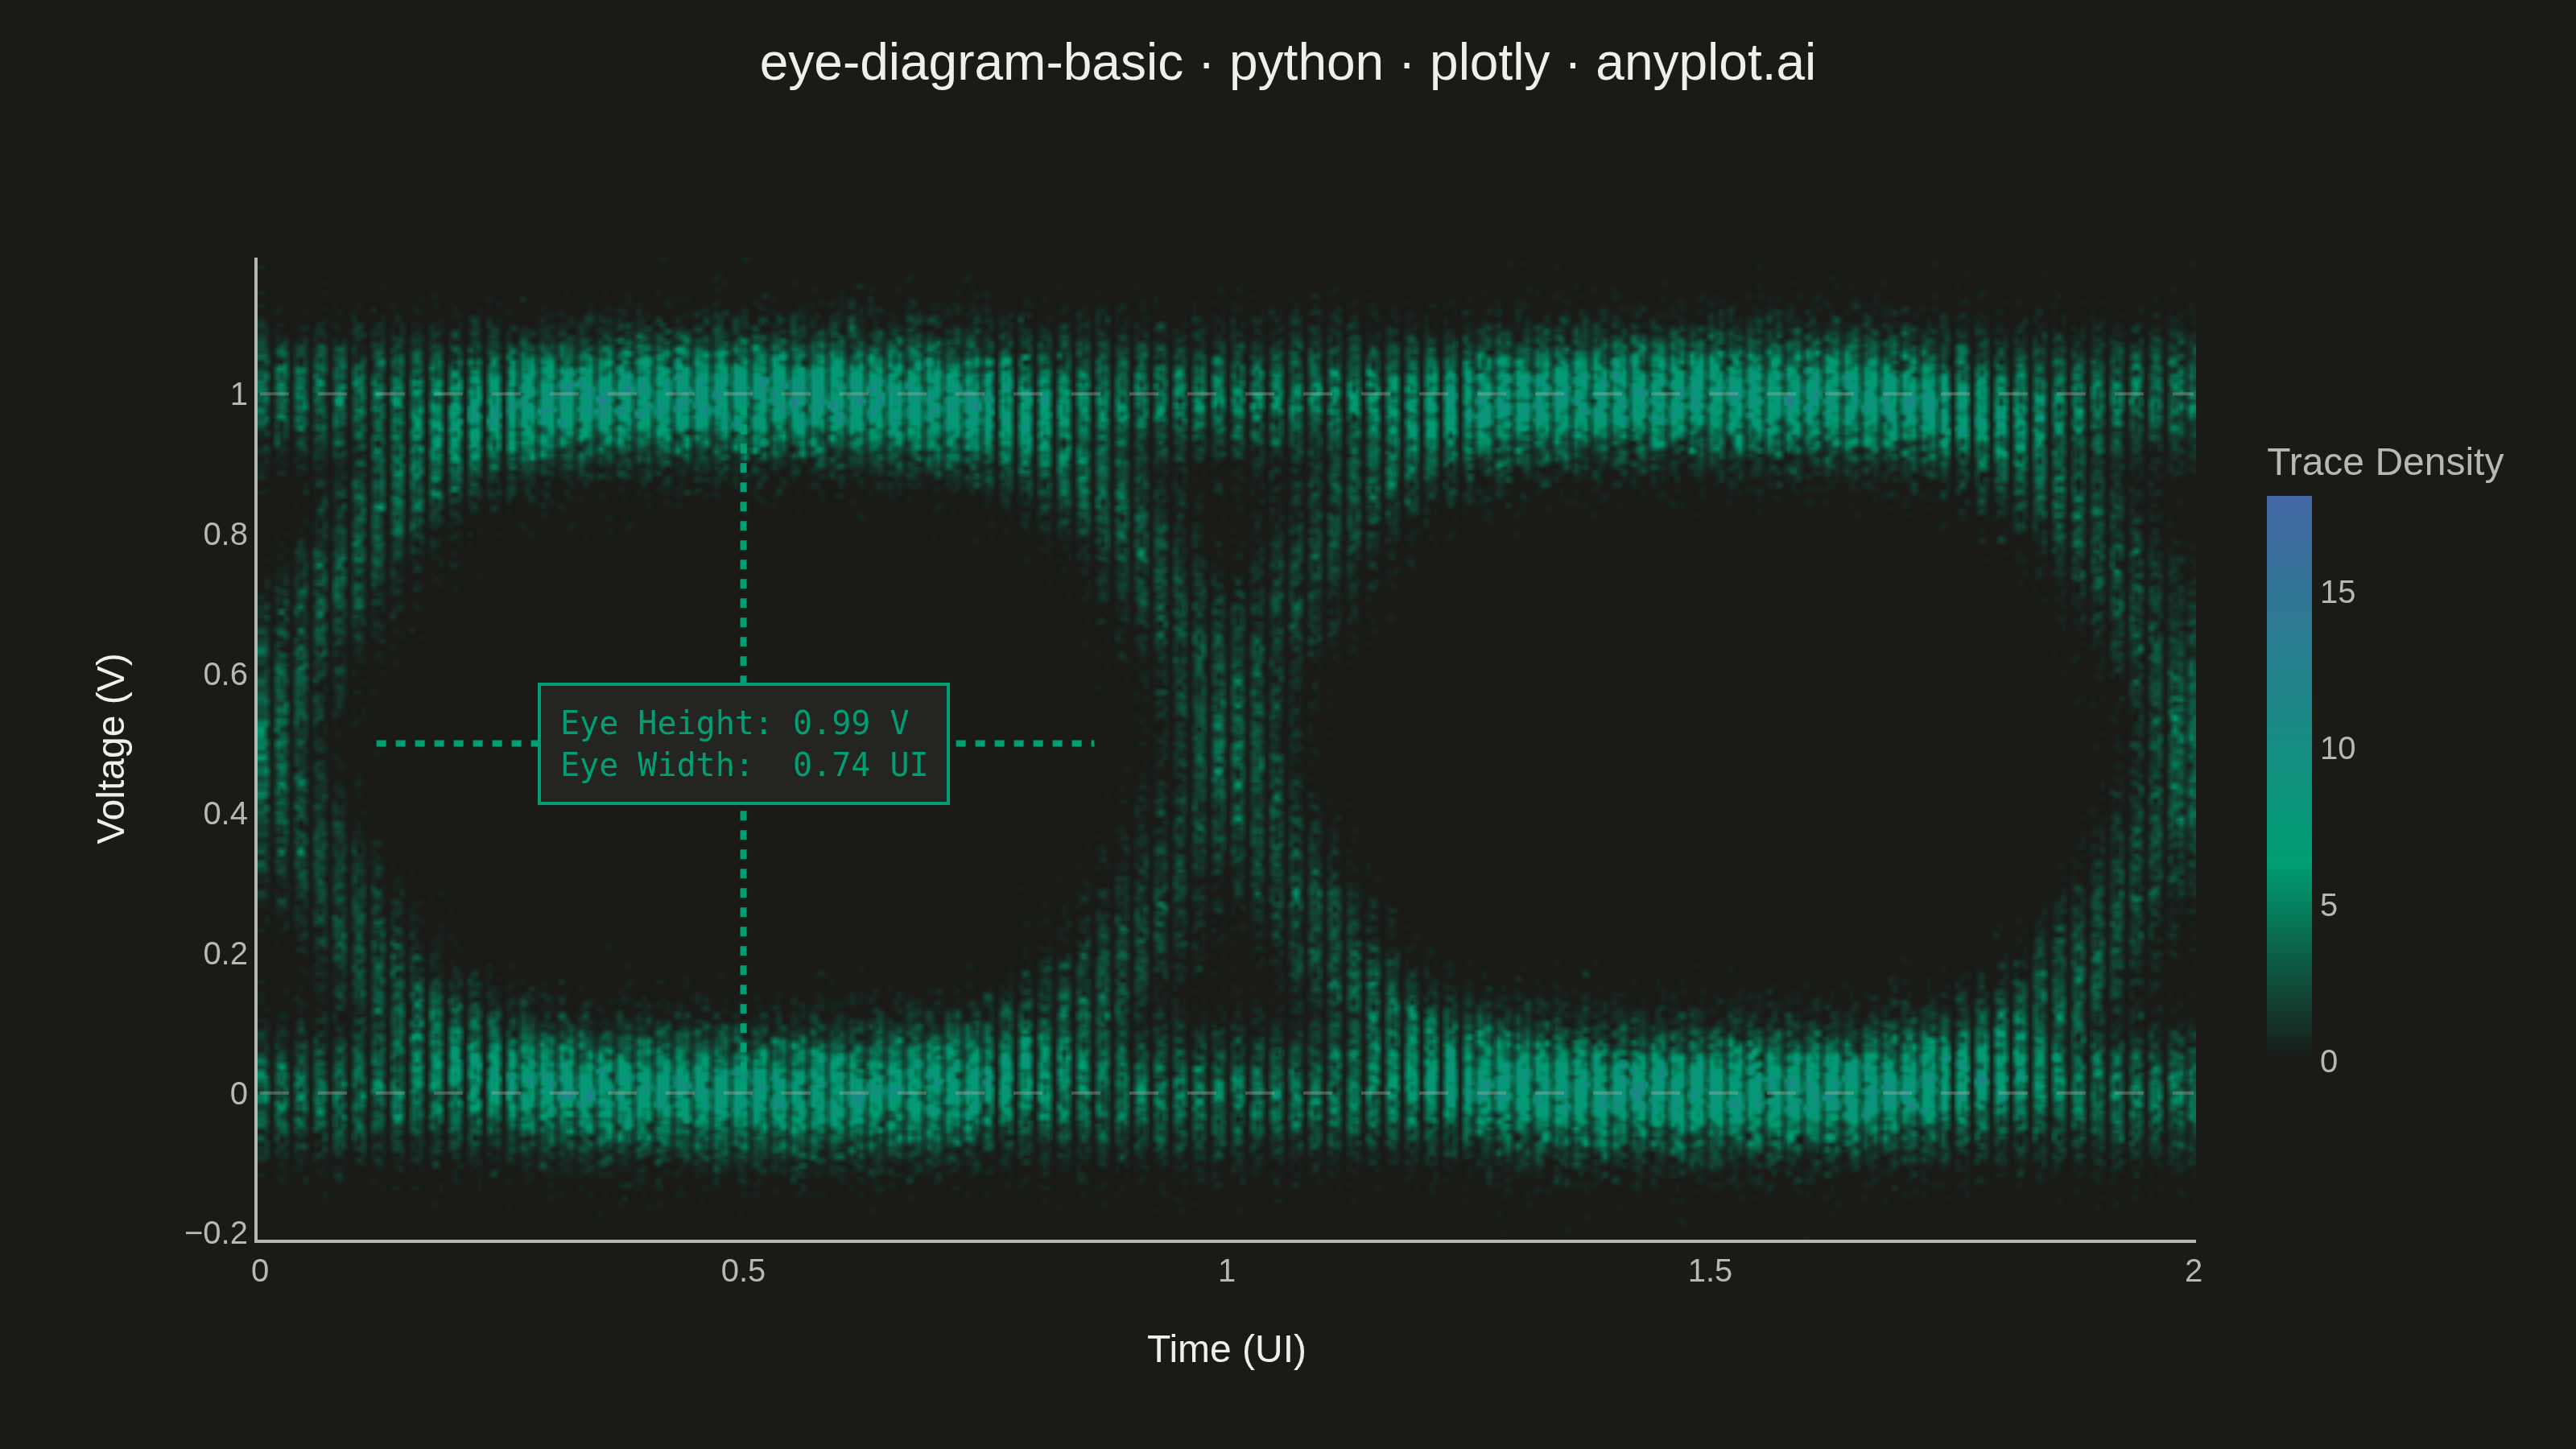
An eye diagram visualizes signal integrity by overlaying many periods of a digital signal onto a single time window spanning 1-2 unit intervals (UI). The overlapping traces form a characteristic eye-shaped opening whose height, width, and clarity reveal signal quality metrics such as jitter, noise, and inter-symbol interference (ISI). A wide-open eye indicates clean signal transmission, while a closed or blurred eye signals degradation.
""" anyplot.ai
eye-diagram-basic: Signal Integrity Eye Diagram
Library: plotly 6.8.0 | Python 3.13.14
Quality: 89/100 | Updated: 2026-06-18
"""

import os

import numpy as np
import plotly.graph_objects as go


# Theme tokens
THEME = os.getenv("ANYPLOT_THEME", "light")
PAGE_BG = "#FAF8F1" if THEME == "light" else "#1A1A17"
ELEVATED_BG = "#FFFDF6" if THEME == "light" else "#242420"
INK = "#1A1A17" if THEME == "light" else "#F0EFE8"
INK_SOFT = "#4A4A44" if THEME == "light" else "#B8B7B0"
GRID = "rgba(26,26,23,0.15)" if THEME == "light" else "rgba(240,239,232,0.15)"

# Imprint sequential colorscale for density — page bg (zero density) → green → blue
imprint_seq = [[0.0, PAGE_BG], [0.35, "#009E73"], [1.0, "#4467A3"]]

# Data
np.random.seed(42)

n_traces = 400
samples_per_ui = 150
n_ui = 2
total_samples = n_ui * samples_per_ui

# Time axis normalized to unit intervals
time = np.linspace(0, n_ui, total_samples)

# Generate random NRZ bit sequences (4 bits to cover 2 UI with transitions)
n_bits = 4
bit_sequences = np.random.randint(0, 2, size=(n_traces, n_bits))

# Build smooth NRZ waveforms with raised-cosine transitions (vectorized)
rolloff = 0.15  # transition sharpness (fraction of UI)
noise_sigma = 0.05  # 5% of amplitude
jitter_sigma = 0.03  # 3% of UI

jitter = np.random.normal(0, jitter_sigma, (n_traces, n_bits))

# Broadcast time across traces: shape (n_traces, total_samples)
time_broadcast = np.broadcast_to(time, (n_traces, total_samples))

# Start from first bit level
voltage = np.full((n_traces, total_samples), bit_sequences[:, 0:1], dtype=float)

# Apply transitions for each bit boundary using vectorized tanh
for b in range(1, n_bits):
    transition_time = (b - 1.0) + jitter[:, b : b + 1]  # shape (n_traces, 1)
    transition = 0.5 * (1 + np.tanh((time_broadcast - transition_time) / rolloff))
    voltage = voltage * (1 - transition) + bit_sequences[:, b : b + 1] * transition

# Add Gaussian noise
voltage += np.random.normal(0, noise_sigma, voltage.shape)

all_time = np.tile(time, n_traces)
all_voltage = voltage.ravel()

# Compute eye height at first eye center (t ≈ 0.5 UI)
center_mask = (all_time > 0.35) & (all_time < 0.65)
high_at_center = all_voltage[center_mask & (all_voltage > 0.5)]
low_at_center = all_voltage[center_mask & (all_voltage < 0.5)]
mean_high = float(np.mean(high_at_center))
mean_low = float(np.mean(low_at_center))
eye_height = mean_high - mean_low

# Compute eye width: largest time gap where no traces cross the 0.5 V midpoint
# (first eye only, 0–1 UI)
midband_mask = (all_voltage > 0.4) & (all_voltage < 0.6) & (all_time > 0.0) & (all_time < 1.0)
transition_times = np.sort(all_time[midband_mask])
if len(transition_times) > 1:
    gaps = np.diff(transition_times)
    max_gap_idx = int(np.argmax(gaps))
    eye_open_start = float(transition_times[max_gap_idx])
    eye_open_end = float(transition_times[max_gap_idx + 1])
    eye_width_ui = eye_open_end - eye_open_start
else:
    eye_open_start, eye_open_end = 0.2, 0.8
    eye_width_ui = 0.6

# Plot — density heatmap with smoothing to reduce graininess
fig = go.Figure(
    data=go.Histogram2d(
        x=all_time,
        y=all_voltage,
        nbinsx=500,
        nbinsy=350,
        zsmooth="best",
        colorscale=imprint_seq,
        colorbar={
            "title": {"text": "Trace Density", "font": {"size": 12, "color": INK_SOFT}},
            "tickfont": {"size": 10, "color": INK_SOFT},
            "thickness": 14,
            "len": 0.7,
            "outlinewidth": 0,
            "bgcolor": "rgba(0,0,0,0)",
            "borderwidth": 0,
            "y": 0.5,
        },
        hovertemplate="Time: %{x:.2f} UI<br>Voltage: %{y:.3f} V<br>Density: %{z}<extra></extra>",
    )
)

ACCENT = "#009E73"

# Faint horizontal reference lines at NRZ nominal logic levels (0 V and 1 V)
for logic_v in [0.0, 1.0]:
    fig.add_shape(
        type="line",
        x0=0,
        x1=n_ui,
        y0=logic_v,
        y1=logic_v,
        line={"color": INK_SOFT, "width": 1, "dash": "dash"},
        opacity=0.35,
    )

# Vertical bracket line marking the eye height span at t=0.5 UI
fig.add_shape(type="line", x0=0.5, x1=0.5, y0=mean_low, y1=mean_high, line={"color": ACCENT, "width": 2, "dash": "dot"})

# Horizontal bracket line marking the eye width span at y=0.5 V
fig.add_shape(
    type="line", x0=eye_open_start, x1=eye_open_end, y0=0.5, y1=0.5, line={"color": ACCENT, "width": 2, "dash": "dot"}
)

# Combined signal quality annotation at center of first eye
fig.add_annotation(
    x=0.5,
    y=0.5,
    text=f"Eye Height: {eye_height:.2f} V<br>Eye Width:  {eye_width_ui:.2f} UI",
    showarrow=False,
    font={"size": 10, "color": ACCENT, "family": "monospace"},
    bgcolor=ELEVATED_BG,
    bordercolor=ACCENT,
    borderwidth=1,
    borderpad=6,
    align="left",
)

# Title
title = "eye-diagram-basic · python · plotly · anyplot.ai"

fig.update_layout(
    autosize=False,
    title={
        "text": title,
        "font": {"size": 16, "color": INK},
        "x": 0.5,
        "xanchor": "center",
        "y": 0.97,
        "yanchor": "top",
    },
    xaxis={
        "title": {"text": "Time (UI)", "font": {"size": 12, "color": INK}},
        "tickfont": {"size": 10, "color": INK_SOFT},
        "tickvals": [0, 0.5, 1.0, 1.5, 2.0],
        "gridcolor": GRID,
        "gridwidth": 1,
        "zeroline": False,
        "showline": True,
        "linecolor": INK_SOFT,
        "linewidth": 1,
        "mirror": False,
    },
    yaxis={
        "title": {"text": "Voltage (V)", "font": {"size": 12, "color": INK}},
        "tickfont": {"size": 10, "color": INK_SOFT},
        "gridcolor": GRID,
        "gridwidth": 1,
        "zeroline": False,
        "showline": True,
        "linecolor": INK_SOFT,
        "linewidth": 1,
        "mirror": False,
    },
    paper_bgcolor=PAGE_BG,
    plot_bgcolor=PAGE_BG,
    font={"color": INK},
    legend={"bgcolor": ELEVATED_BG, "bordercolor": INK_SOFT, "borderwidth": 1, "font": {"color": INK_SOFT}},
    margin={"l": 80, "r": 60, "t": 80, "b": 65},
)

# Save — landscape 3200×1800 (800×450 scale=4)
fig.write_image(f"plot-{THEME}.png", width=800, height=450, scale=4)
fig.write_html(f"plot-{THEME}.html", include_plotlyjs="cdn")
Runnable source as JSON, for any HTTP client: https://api.anyplot.ai/specs/eye-diagram-basic/plotly/code. Any spec id and library id listed in llms-full.txt fit the same URL shape; every URL below is complete and callable.
{
  "spec_id": "eye-diagram-basic",
  "language": "python",
  "library": "plotly",
  "page": "https://anyplot.ai/eye-diagram-basic/python/plotly",
  "hub": "https://anyplot.ai/eye-diagram-basic",
  "code_json": "https://api.anyplot.ai/specs/eye-diagram-basic/plotly/code",
  "spec_json": "https://api.anyplot.ai/specs/eye-diagram-basic",
  "render_light_png": "https://storage.googleapis.com/anyplot-images/plots/eye-diagram-basic/python/plotly/plot-light.png",
  "render_dark_png": "https://storage.googleapis.com/anyplot-images/plots/eye-diagram-basic/python/plotly/plot-dark.png",
  "interactive_light_html": "https://storage.googleapis.com/anyplot-images/plots/eye-diagram-basic/python/plotly/plot-light.html",
  "interactive_dark_html": "https://storage.googleapis.com/anyplot-images/plots/eye-diagram-basic/python/plotly/plot-dark.html",
  "quality_score": 89.0,
  "license": "MIT",
  "guide": "https://anyplot.ai/llms.txt"
}
Part of Signal Integrity Eye Diagram on anyplot.ai.