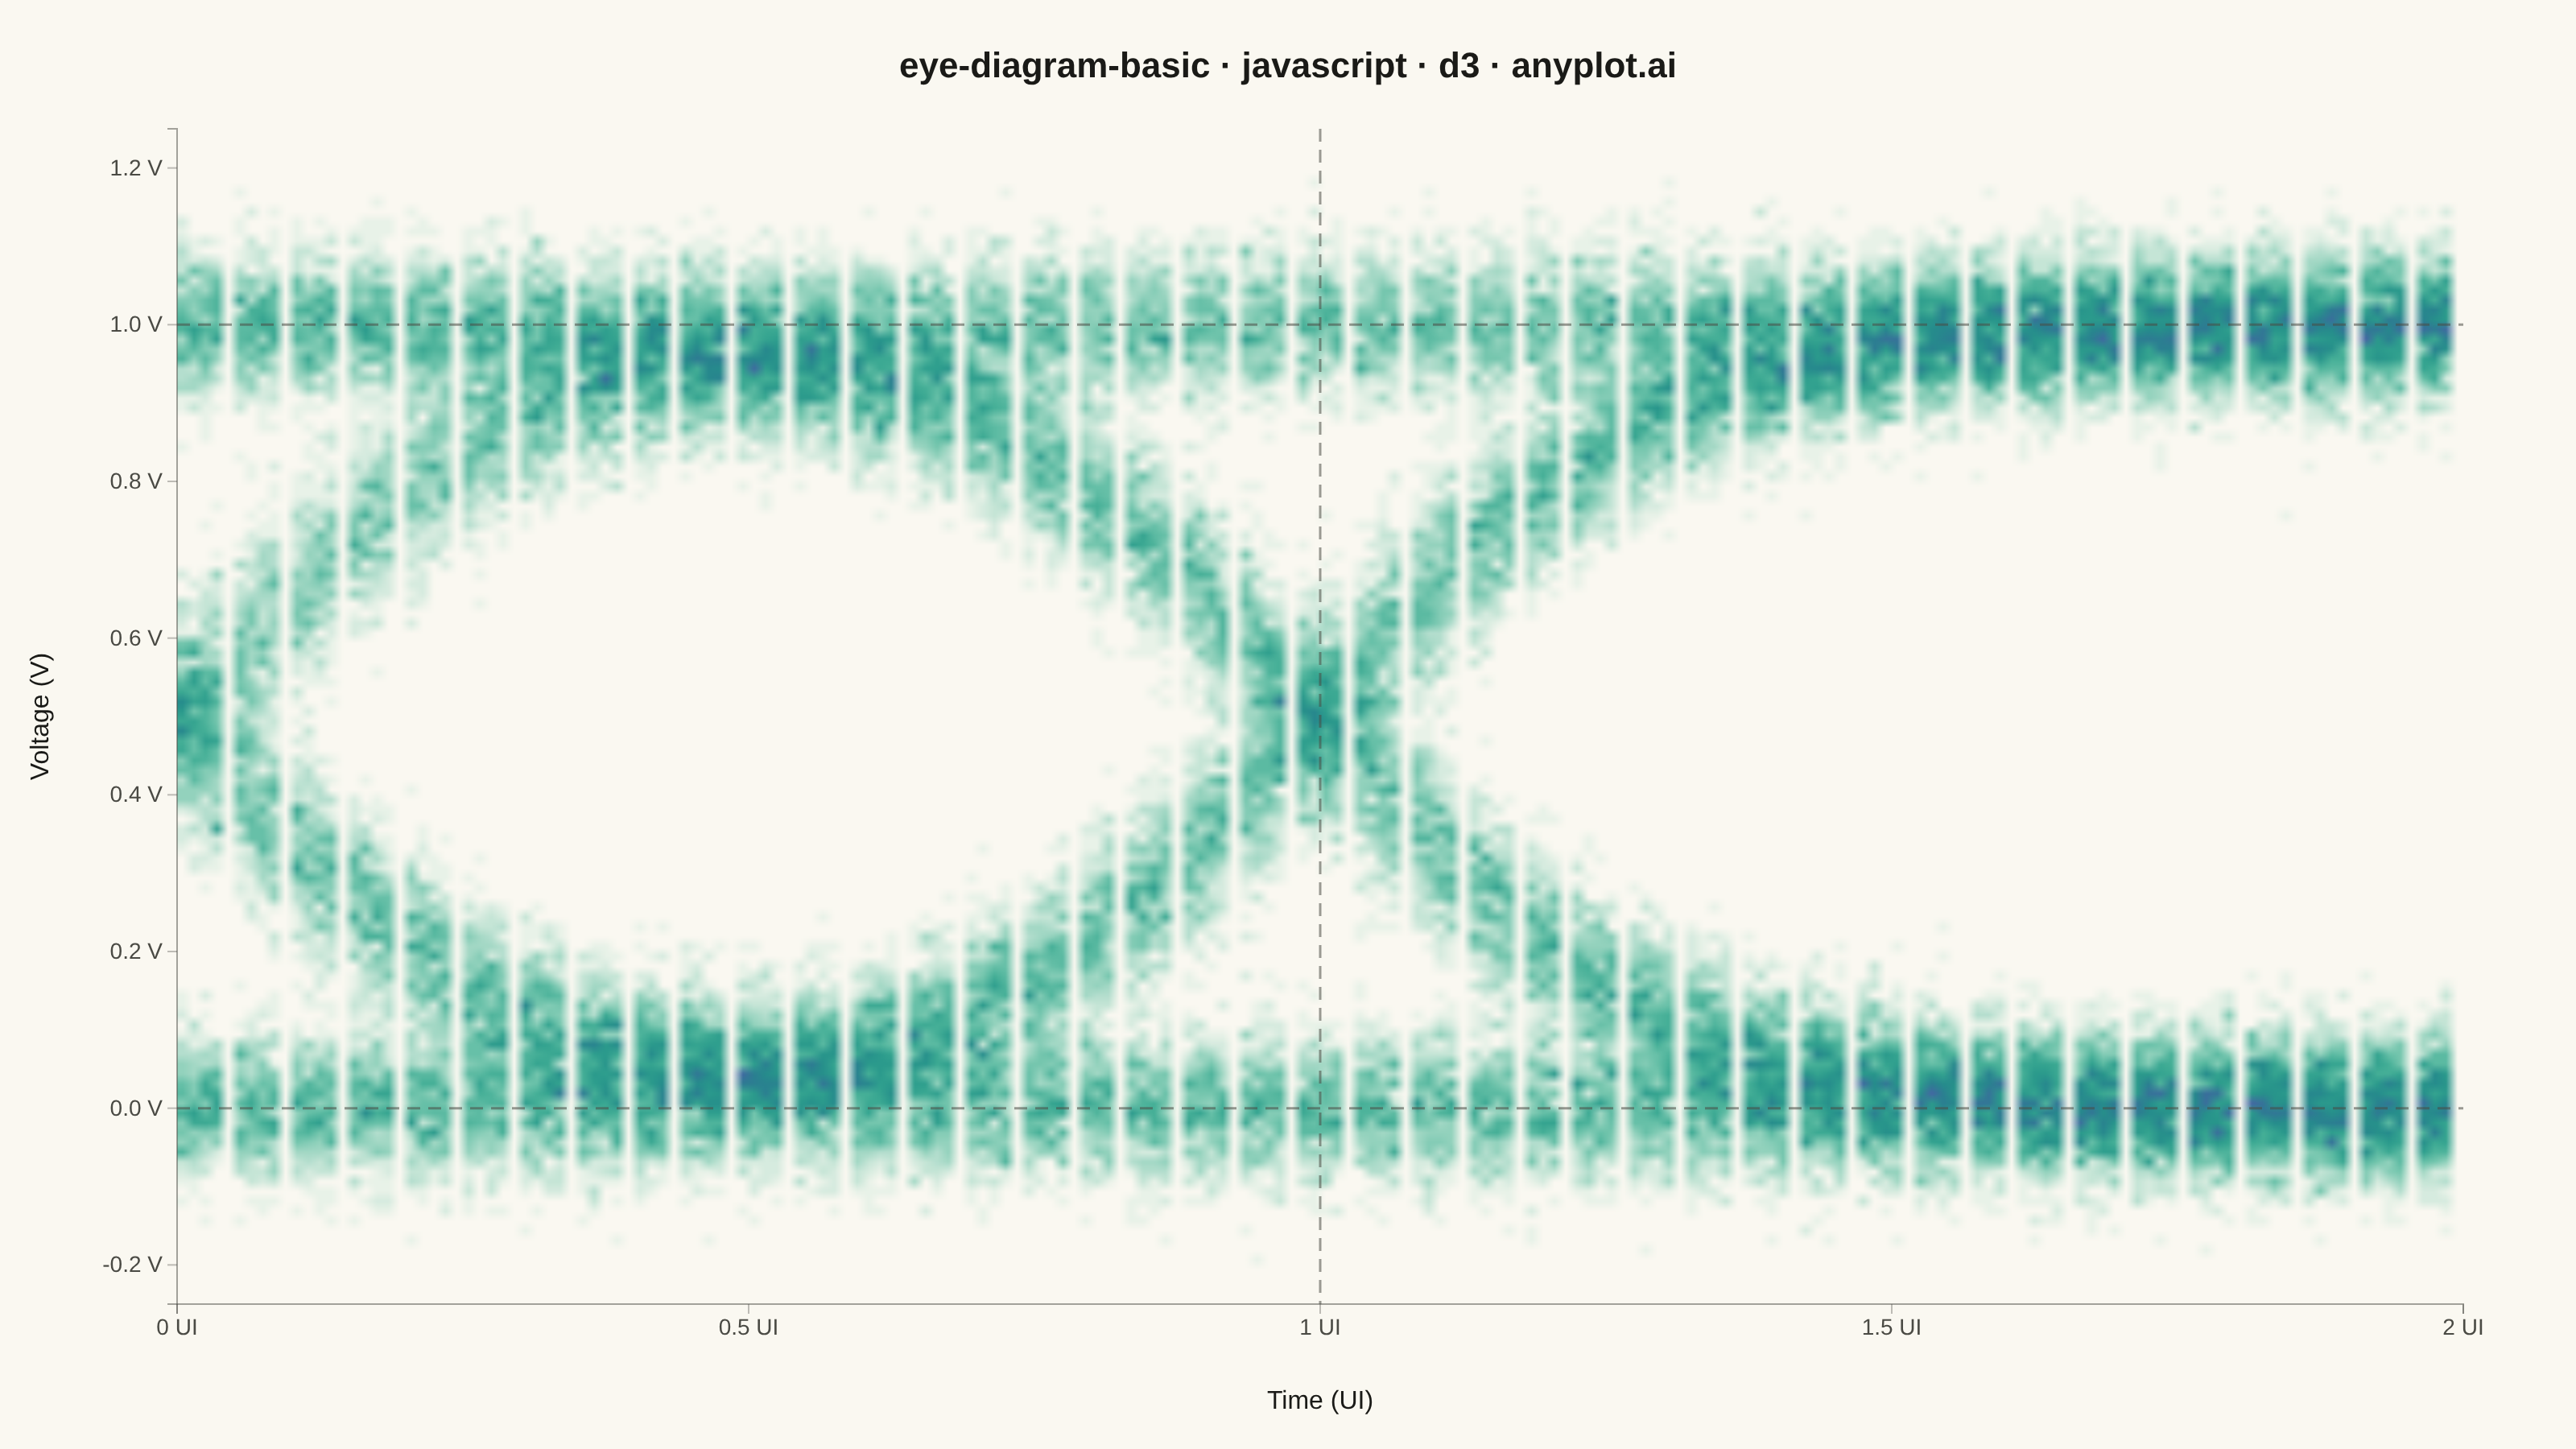
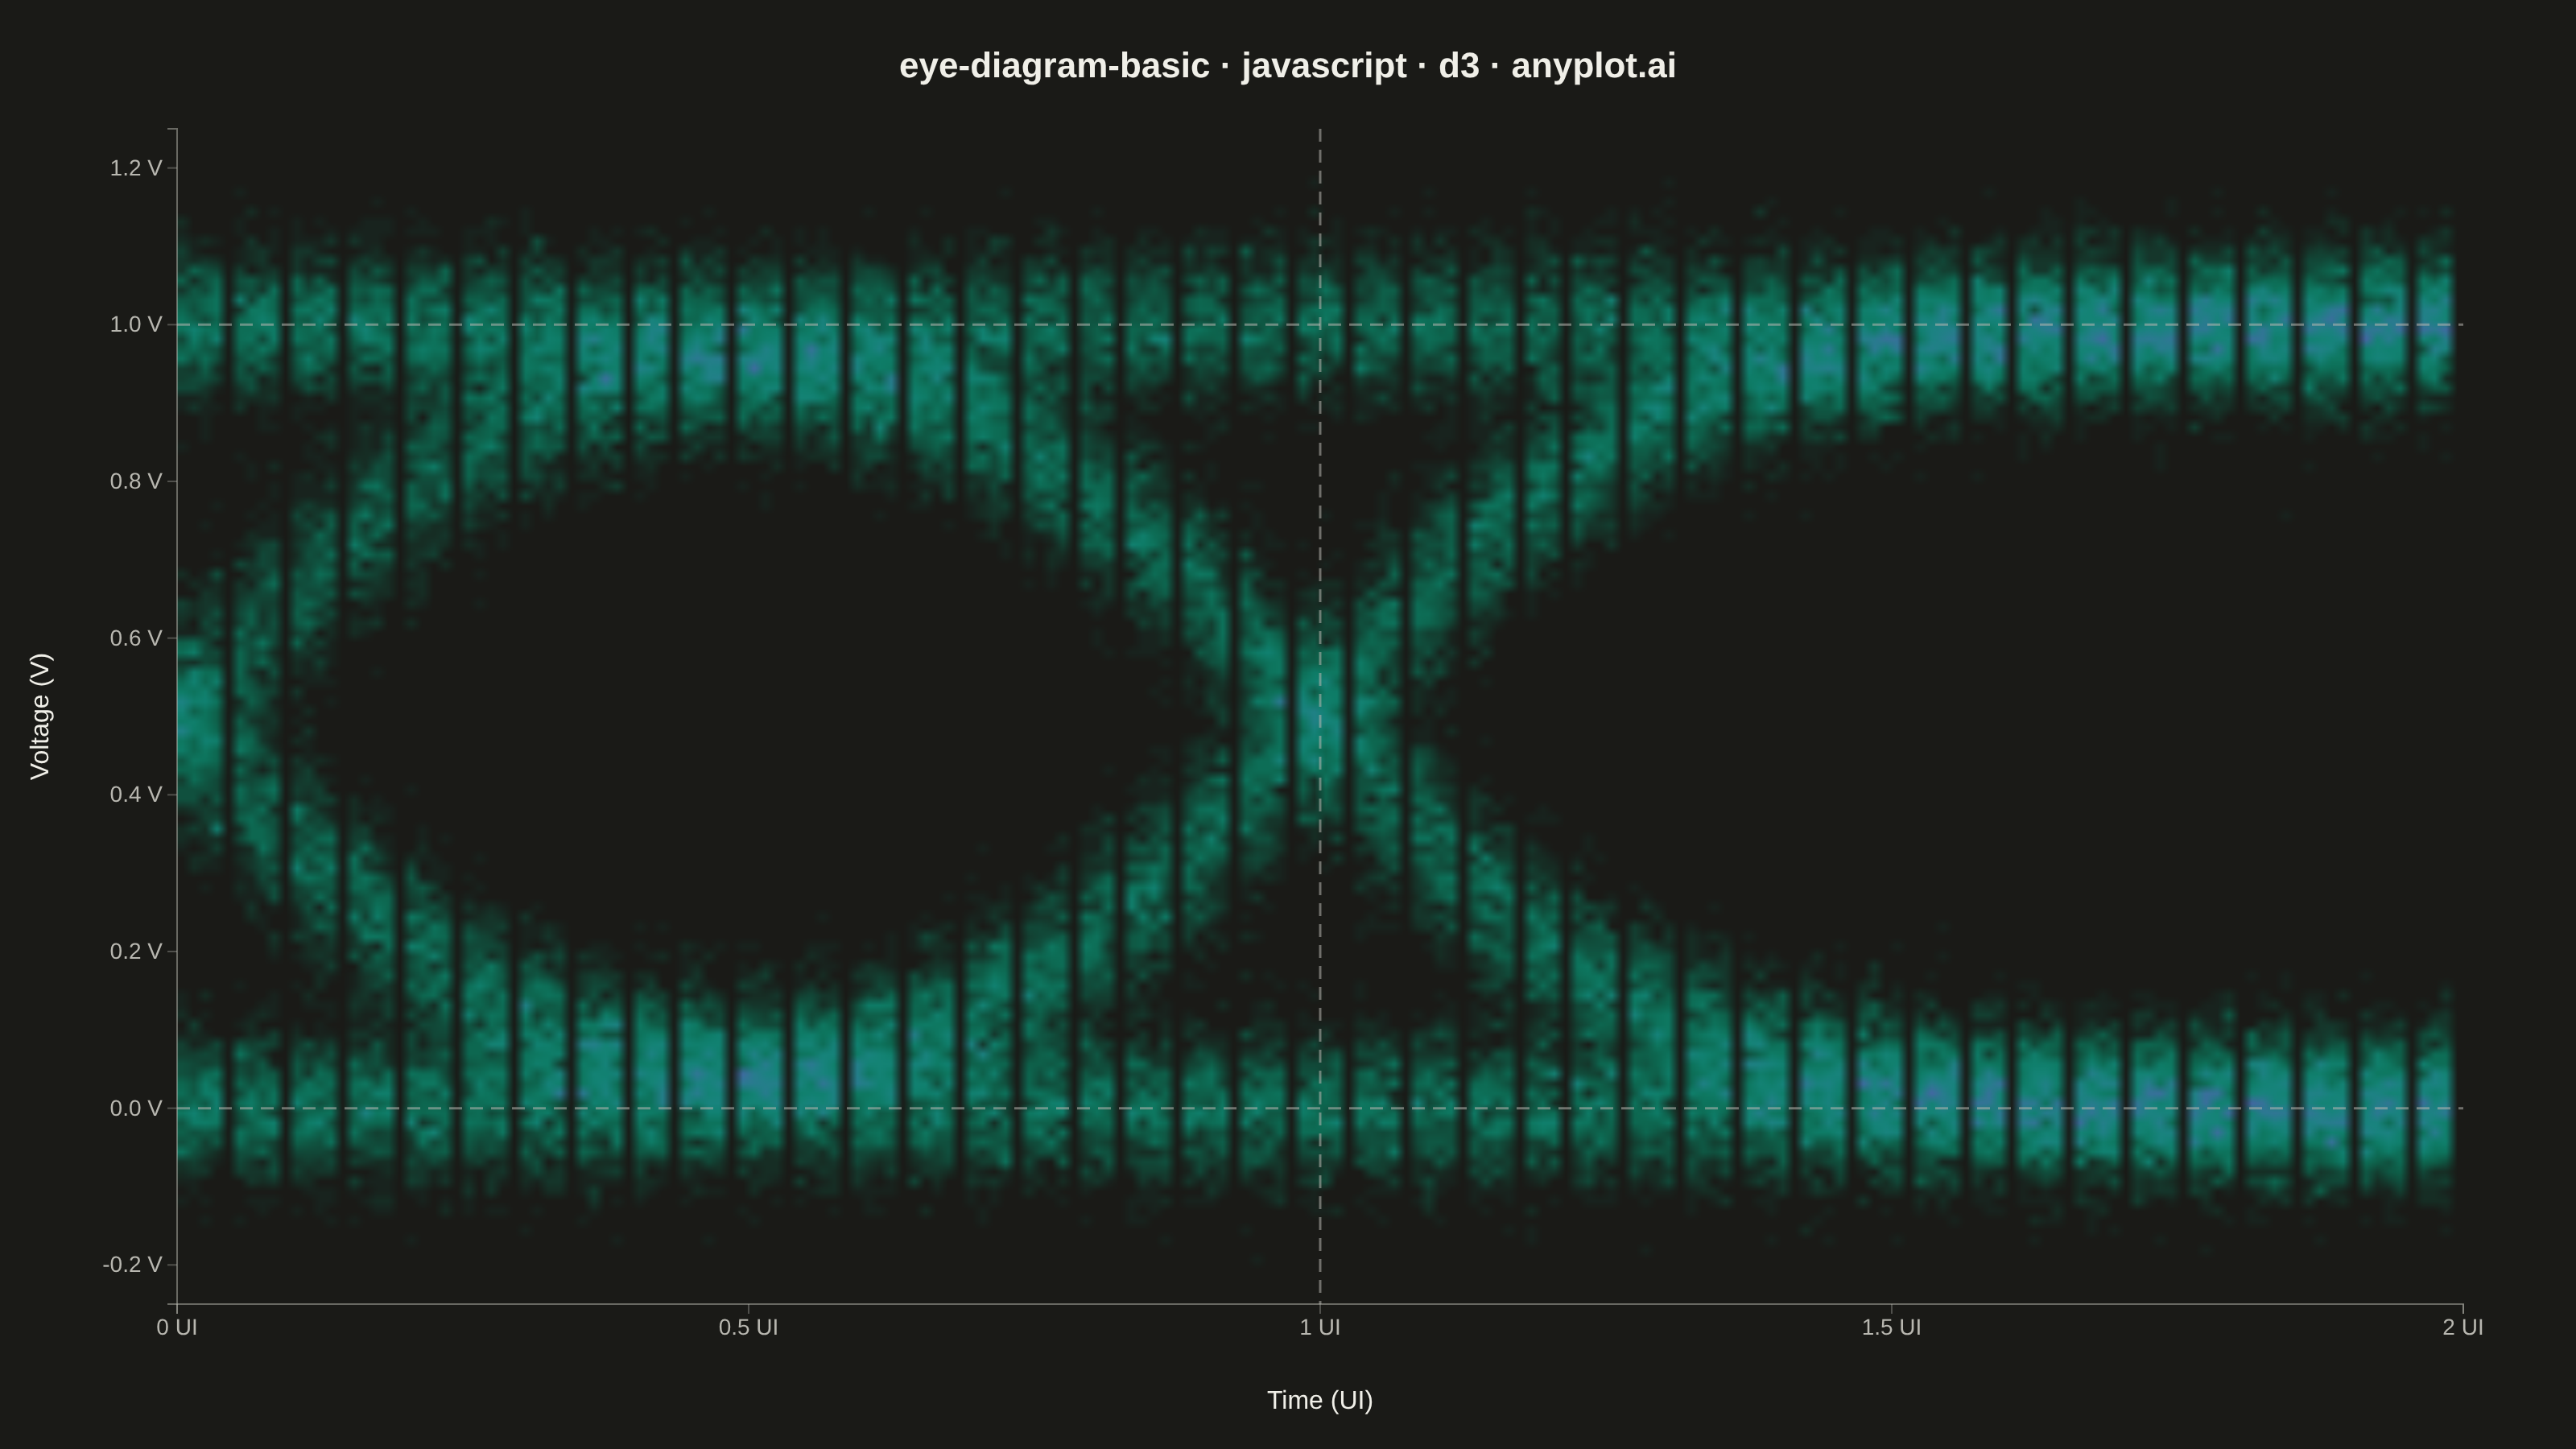
An eye diagram visualizes signal integrity by overlaying many periods of a digital signal onto a single time window spanning 1-2 unit intervals (UI). The overlapping traces form a characteristic eye-shaped opening whose height, width, and clarity reveal signal quality metrics such as jitter, noise, and inter-symbol interference (ISI). A wide-open eye indicates clean signal transmission, while a closed or blurred eye signals degradation.
// anyplot.ai
// eye-diagram-basic: Signal Integrity Eye Diagram
// Library: d3 7.9.0 | JavaScript 22.22.3
// Quality: 93/100 | Created: 2026-06-18

const tok = window.ANYPLOT_TOKENS;
const { width, height } = window.ANYPLOT_SIZE;
const margin = { top: 80, right: 70, bottom: 90, left: 110 };
const iw = width - margin.left - margin.right;
const ih = height - margin.top - margin.bottom;

// Deterministic LCG RNG
let _rng = 42;
function rand() { _rng = (_rng * 1664525 + 1013904223) >>> 0; return _rng / 4294967296; }
function randn() {
  return Math.sqrt(-2 * Math.log(Math.max(rand(), 1e-9))) * Math.cos(2 * Math.PI * rand());
}

const N_TRACES = 400;
const SAMPLES = 160;
const NOISE_SIGMA = 0.05;
const JITTER_SIGMA = 0.03;
const BW = 0.15;
const sigmoid = (x) => 1 / (1 + Math.exp(-x / BW));

// Build trace points: 2-UI window, 3 random NRZ bits per trace
const allPoints = [];
for (let i = 0; i < N_TRACES; i++) {
  const b0 = rand() > 0.5 ? 1 : 0;
  const b1 = rand() > 0.5 ? 1 : 0;
  const b2 = rand() > 0.5 ? 1 : 0;
  const j0 = randn() * JITTER_SIGMA;
  const j1 = randn() * JITTER_SIGMA;
  for (let s = 0; s < SAMPLES; s++) {
    const tm = (s / (SAMPLES - 1)) * 2;
    const v =
      b0 +
      (b1 - b0) * sigmoid(tm - j0) +
      (b2 - b1) * sigmoid(tm - 1 - j1) +
      randn() * NOISE_SIGMA;
    allPoints.push([tm, v]);
  }
}

// 2D histogram for density heatmap
const BINS_X = 200;
const BINS_Y = 120;
const V_MIN = -0.25;
const V_MAX = 1.25;
const T_MIN = 0;
const T_MAX = 2;

const hist = new Int32Array(BINS_X * BINS_Y);
for (const [tm, v] of allPoints) {
  const bx = Math.floor(((tm - T_MIN) / (T_MAX - T_MIN)) * BINS_X);
  const by = Math.floor(((V_MAX - v) / (V_MAX - V_MIN)) * BINS_Y);
  if (bx >= 0 && bx < BINS_X && by >= 0 && by < BINS_Y) {
    hist[by * BINS_X + bx]++;
  }
}
const maxCount = Math.max(...hist);

// Color scale: pageBg → Imprint green → Imprint blue
const colorScale = d3
  .scaleSequential()
  .domain([0, maxCount])
  .interpolator(d3.interpolateRgbBasis([tok.pageBg, tok.seq[0], tok.seq[1]]));

// Precompute per-bin RGBA for efficient bilinear interpolation
const binRgba = new Uint8Array(BINS_X * BINS_Y * 4);
for (let bi = 0; bi < BINS_X * BINS_Y; bi++) {
  const { r, g, b } = d3.color(colorScale(hist[bi])).rgb();
  binRgba[bi * 4] = r;
  binRgba[bi * 4 + 1] = g;
  binRgba[bi * 4 + 2] = b;
  binRgba[bi * 4 + 3] = 255;
}

// --- Hybrid canvas + SVG layout -------------------------------------------
// Canvas carries the heatmap using per-pixel ImageData with bilinear
// interpolation between bin centers — eliminates both banding and pixelation.
// SVG handles axes, reference lines, labels, and title on top.
d3.select("#container").style("position", "relative");

const canvasEl = d3
  .select("#container")
  .append("canvas")
  .attr("width", iw)
  .attr("height", ih)
  .style("position", "absolute")
  .style("left", `${margin.left}px`)
  .style("top", `${margin.top}px`);

const ctx = canvasEl.node().getContext("2d");
const imgData = ctx.createImageData(iw, ih);
const pixels = imgData.data;

// Per-pixel bilinear interpolation: map each canvas pixel to fractional bin
// coordinates and blend the four surrounding bin colors for smooth output.
for (let py = 0; py < ih; py++) {
  const fy = (py + 0.5) * BINS_Y / ih - 0.5;
  const by0 = Math.max(0, Math.floor(fy));
  const by1 = Math.min(BINS_Y - 1, by0 + 1);
  const wdy1 = Math.max(0, Math.min(1, fy - by0));
  const wdy0 = 1 - wdy1;

  for (let px = 0; px < iw; px++) {
    const fx = (px + 0.5) * BINS_X / iw - 0.5;
    const bx0 = Math.max(0, Math.floor(fx));
    const bx1 = Math.min(BINS_X - 1, bx0 + 1);
    const wdx1 = Math.max(0, Math.min(1, fx - bx0));
    const wdx0 = 1 - wdx1;

    const i00 = (by0 * BINS_X + bx0) * 4;
    const i10 = (by0 * BINS_X + bx1) * 4;
    const i01 = (by1 * BINS_X + bx0) * 4;
    const i11 = (by1 * BINS_X + bx1) * 4;

    const w00 = wdx0 * wdy0;
    const w10 = wdx1 * wdy0;
    const w01 = wdx0 * wdy1;
    const w11 = wdx1 * wdy1;

    const pi = (py * iw + px) * 4;
    pixels[pi] = w00 * binRgba[i00] + w10 * binRgba[i10] + w01 * binRgba[i01] + w11 * binRgba[i11];
    pixels[pi + 1] = w00 * binRgba[i00 + 1] + w10 * binRgba[i10 + 1] + w01 * binRgba[i01 + 1] + w11 * binRgba[i11 + 1];
    pixels[pi + 2] = w00 * binRgba[i00 + 2] + w10 * binRgba[i10 + 2] + w01 * binRgba[i01 + 2] + w11 * binRgba[i11 + 2];
    pixels[pi + 3] = 255;
  }
}
ctx.putImageData(imgData, 0, 0);

// SVG layer for axes, reference lines, labels, and title
const svg = d3
  .select("#container")
  .append("svg")
  .attr("width", width)
  .attr("height", height)
  .style("position", "absolute")
  .style("left", "0")
  .style("top", "0");

const g = svg.append("g").attr("transform", `translate(${margin.left},${margin.top})`);

// Linear scales for overlay elements
const xScale = d3.scaleLinear().domain([T_MIN, T_MAX]).range([0, iw]);
const yScale = d3.scaleLinear().domain([V_MIN, V_MAX]).range([ih, 0]);

// Dashed reference lines at nominal NRZ voltage levels (0 V and 1 V)
for (const level of [0, 1]) {
  g.append("line")
    .attr("x1", 0)
    .attr("x2", iw)
    .attr("y1", yScale(level))
    .attr("y2", yScale(level))
    .attr("stroke", tok.inkSoft)
    .attr("stroke-dasharray", "8,5")
    .attr("stroke-opacity", 0.55)
    .attr("stroke-width", 1.5);
}

// Dashed vertical line at t = 1 UI (sampling instant / eye center)
g.append("line")
  .attr("x1", xScale(1))
  .attr("x2", xScale(1))
  .attr("y1", 0)
  .attr("y2", ih)
  .attr("stroke", tok.inkSoft)
  .attr("stroke-dasharray", "8,5")
  .attr("stroke-opacity", 0.55)
  .attr("stroke-width", 1.5);

// Axes
const xAxis = g
  .append("g")
  .attr("transform", `translate(0,${ih})`)
  .call(d3.axisBottom(xScale).ticks(5).tickFormat((d) => `${d} UI`));
const yAxis = g
  .append("g")
  .call(d3.axisLeft(yScale).ticks(6).tickFormat((d) => d.toFixed(1) + " V"));

for (const ax of [xAxis, yAxis]) {
  ax.selectAll("text").attr("fill", tok.inkSoft).style("font-size", "14px");
  ax.selectAll("line").attr("stroke", tok.inkSoft).attr("stroke-opacity", 0.35);
  ax.select(".domain").attr("stroke", tok.inkSoft).attr("stroke-opacity", 0.5);
}

// Axis labels
g.append("text")
  .attr("x", iw / 2)
  .attr("y", ih + 65)
  .attr("text-anchor", "middle")
  .attr("fill", tok.ink)
  .style("font-size", "16px")
  .text("Time (UI)");

g.append("text")
  .attr("transform", "rotate(-90)")
  .attr("x", -ih / 2)
  .attr("y", -80)
  .attr("text-anchor", "middle")
  .attr("fill", tok.ink)
  .style("font-size", "16px")
  .text("Voltage (V)");

// Chart title
svg
  .append("text")
  .attr("x", width / 2)
  .attr("y", 48)
  .attr("text-anchor", "middle")
  .attr("fill", tok.ink)
  .style("font-size", "22px")
  .style("font-weight", "600")
  .text("eye-diagram-basic · javascript · d3 · anyplot.ai");
Runnable source as JSON, for any HTTP client: https://api.anyplot.ai/specs/eye-diagram-basic/d3/code. Any spec id and library id listed in llms-full.txt fit the same URL shape; every URL below is complete and callable.
{
  "spec_id": "eye-diagram-basic",
  "language": "javascript",
  "library": "d3",
  "page": "https://anyplot.ai/eye-diagram-basic/javascript/d3",
  "hub": "https://anyplot.ai/eye-diagram-basic",
  "code_json": "https://api.anyplot.ai/specs/eye-diagram-basic/d3/code",
  "spec_json": "https://api.anyplot.ai/specs/eye-diagram-basic",
  "render_light_png": "https://storage.googleapis.com/anyplot-images/plots/eye-diagram-basic/javascript/d3/plot-light.png",
  "render_dark_png": "https://storage.googleapis.com/anyplot-images/plots/eye-diagram-basic/javascript/d3/plot-dark.png",
  "interactive_light_html": "https://storage.googleapis.com/anyplot-images/plots/eye-diagram-basic/javascript/d3/plot-light.html",
  "interactive_dark_html": "https://storage.googleapis.com/anyplot-images/plots/eye-diagram-basic/javascript/d3/plot-dark.html",
  "quality_score": 93.0,
  "license": "MIT",
  "guide": "https://anyplot.ai/llms.txt"
}
Part of Signal Integrity Eye Diagram on anyplot.ai.