The same plot in 14 other libraries — JavaScript: D3.js, Apache ECharts, Highcharts, MUI X Charts; Python: Altair, Bokeh, lets-plot, Matplotlib, Plotly, plotnine, Pygal, Seaborn; R: ggplot2; Julia: Makie.jl. Compare all 15 side by side: Origin-Destination Flow Map in Python, R, Julia and JavaScript.
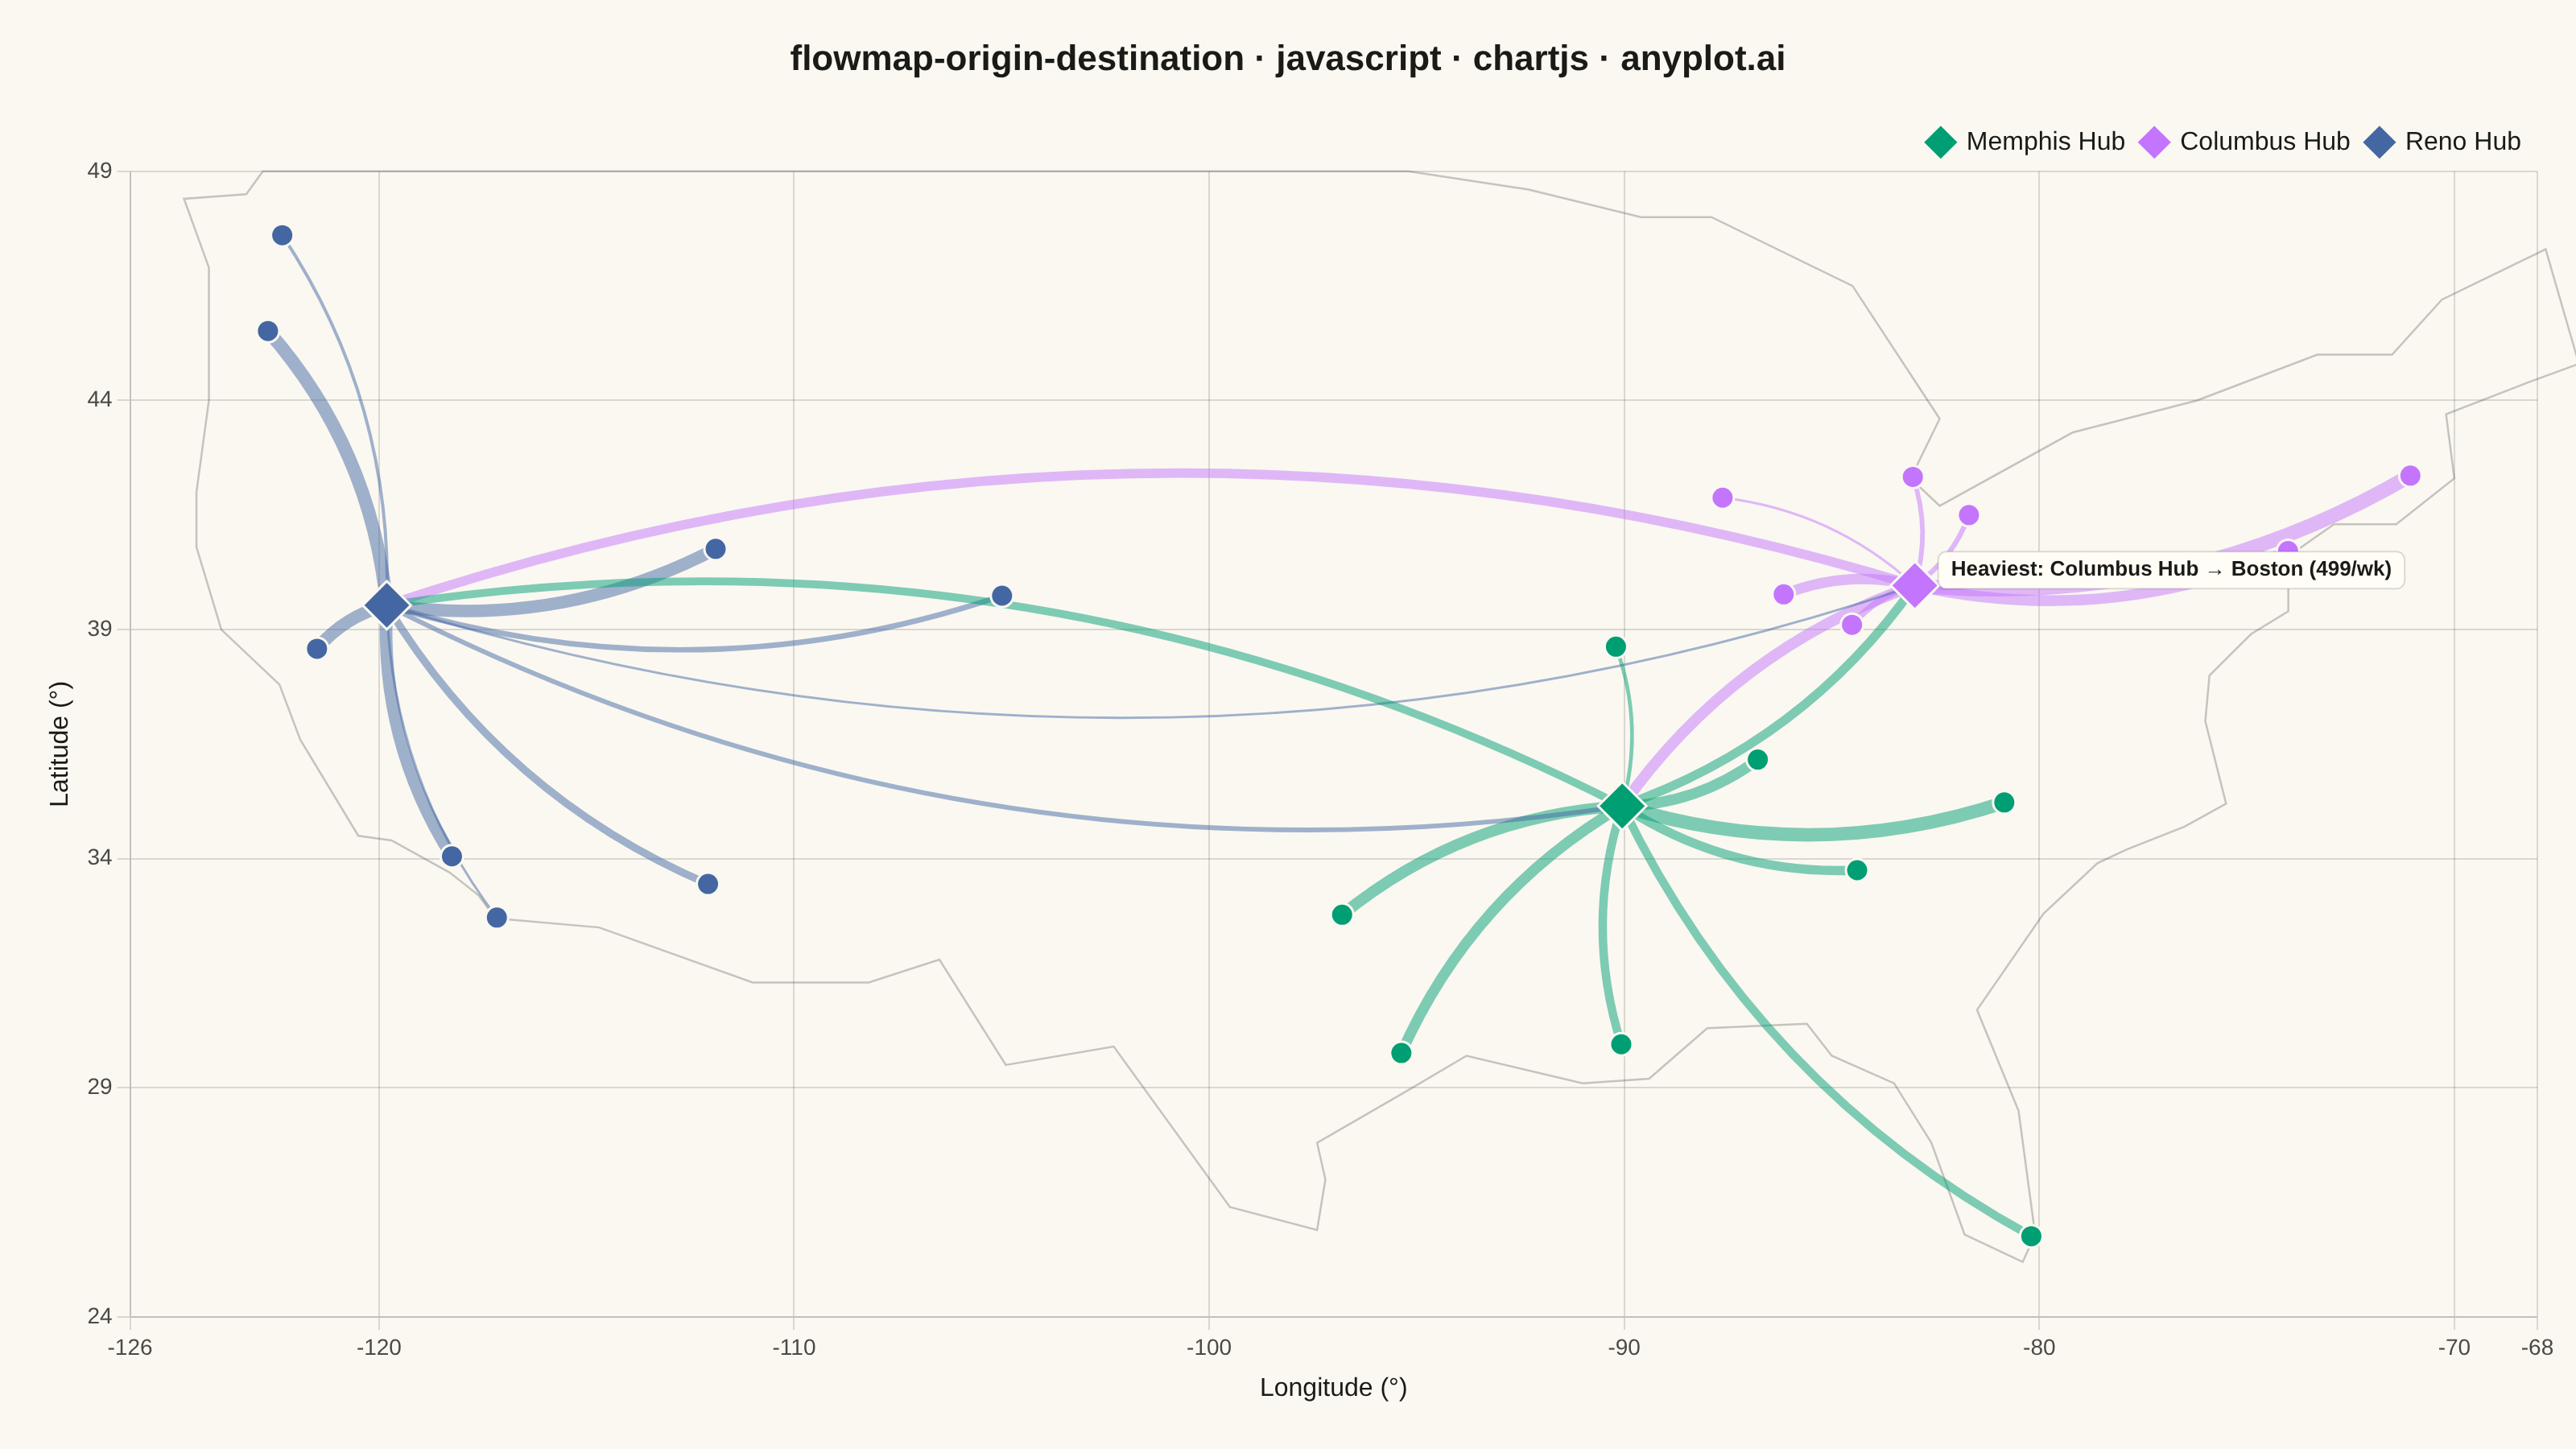
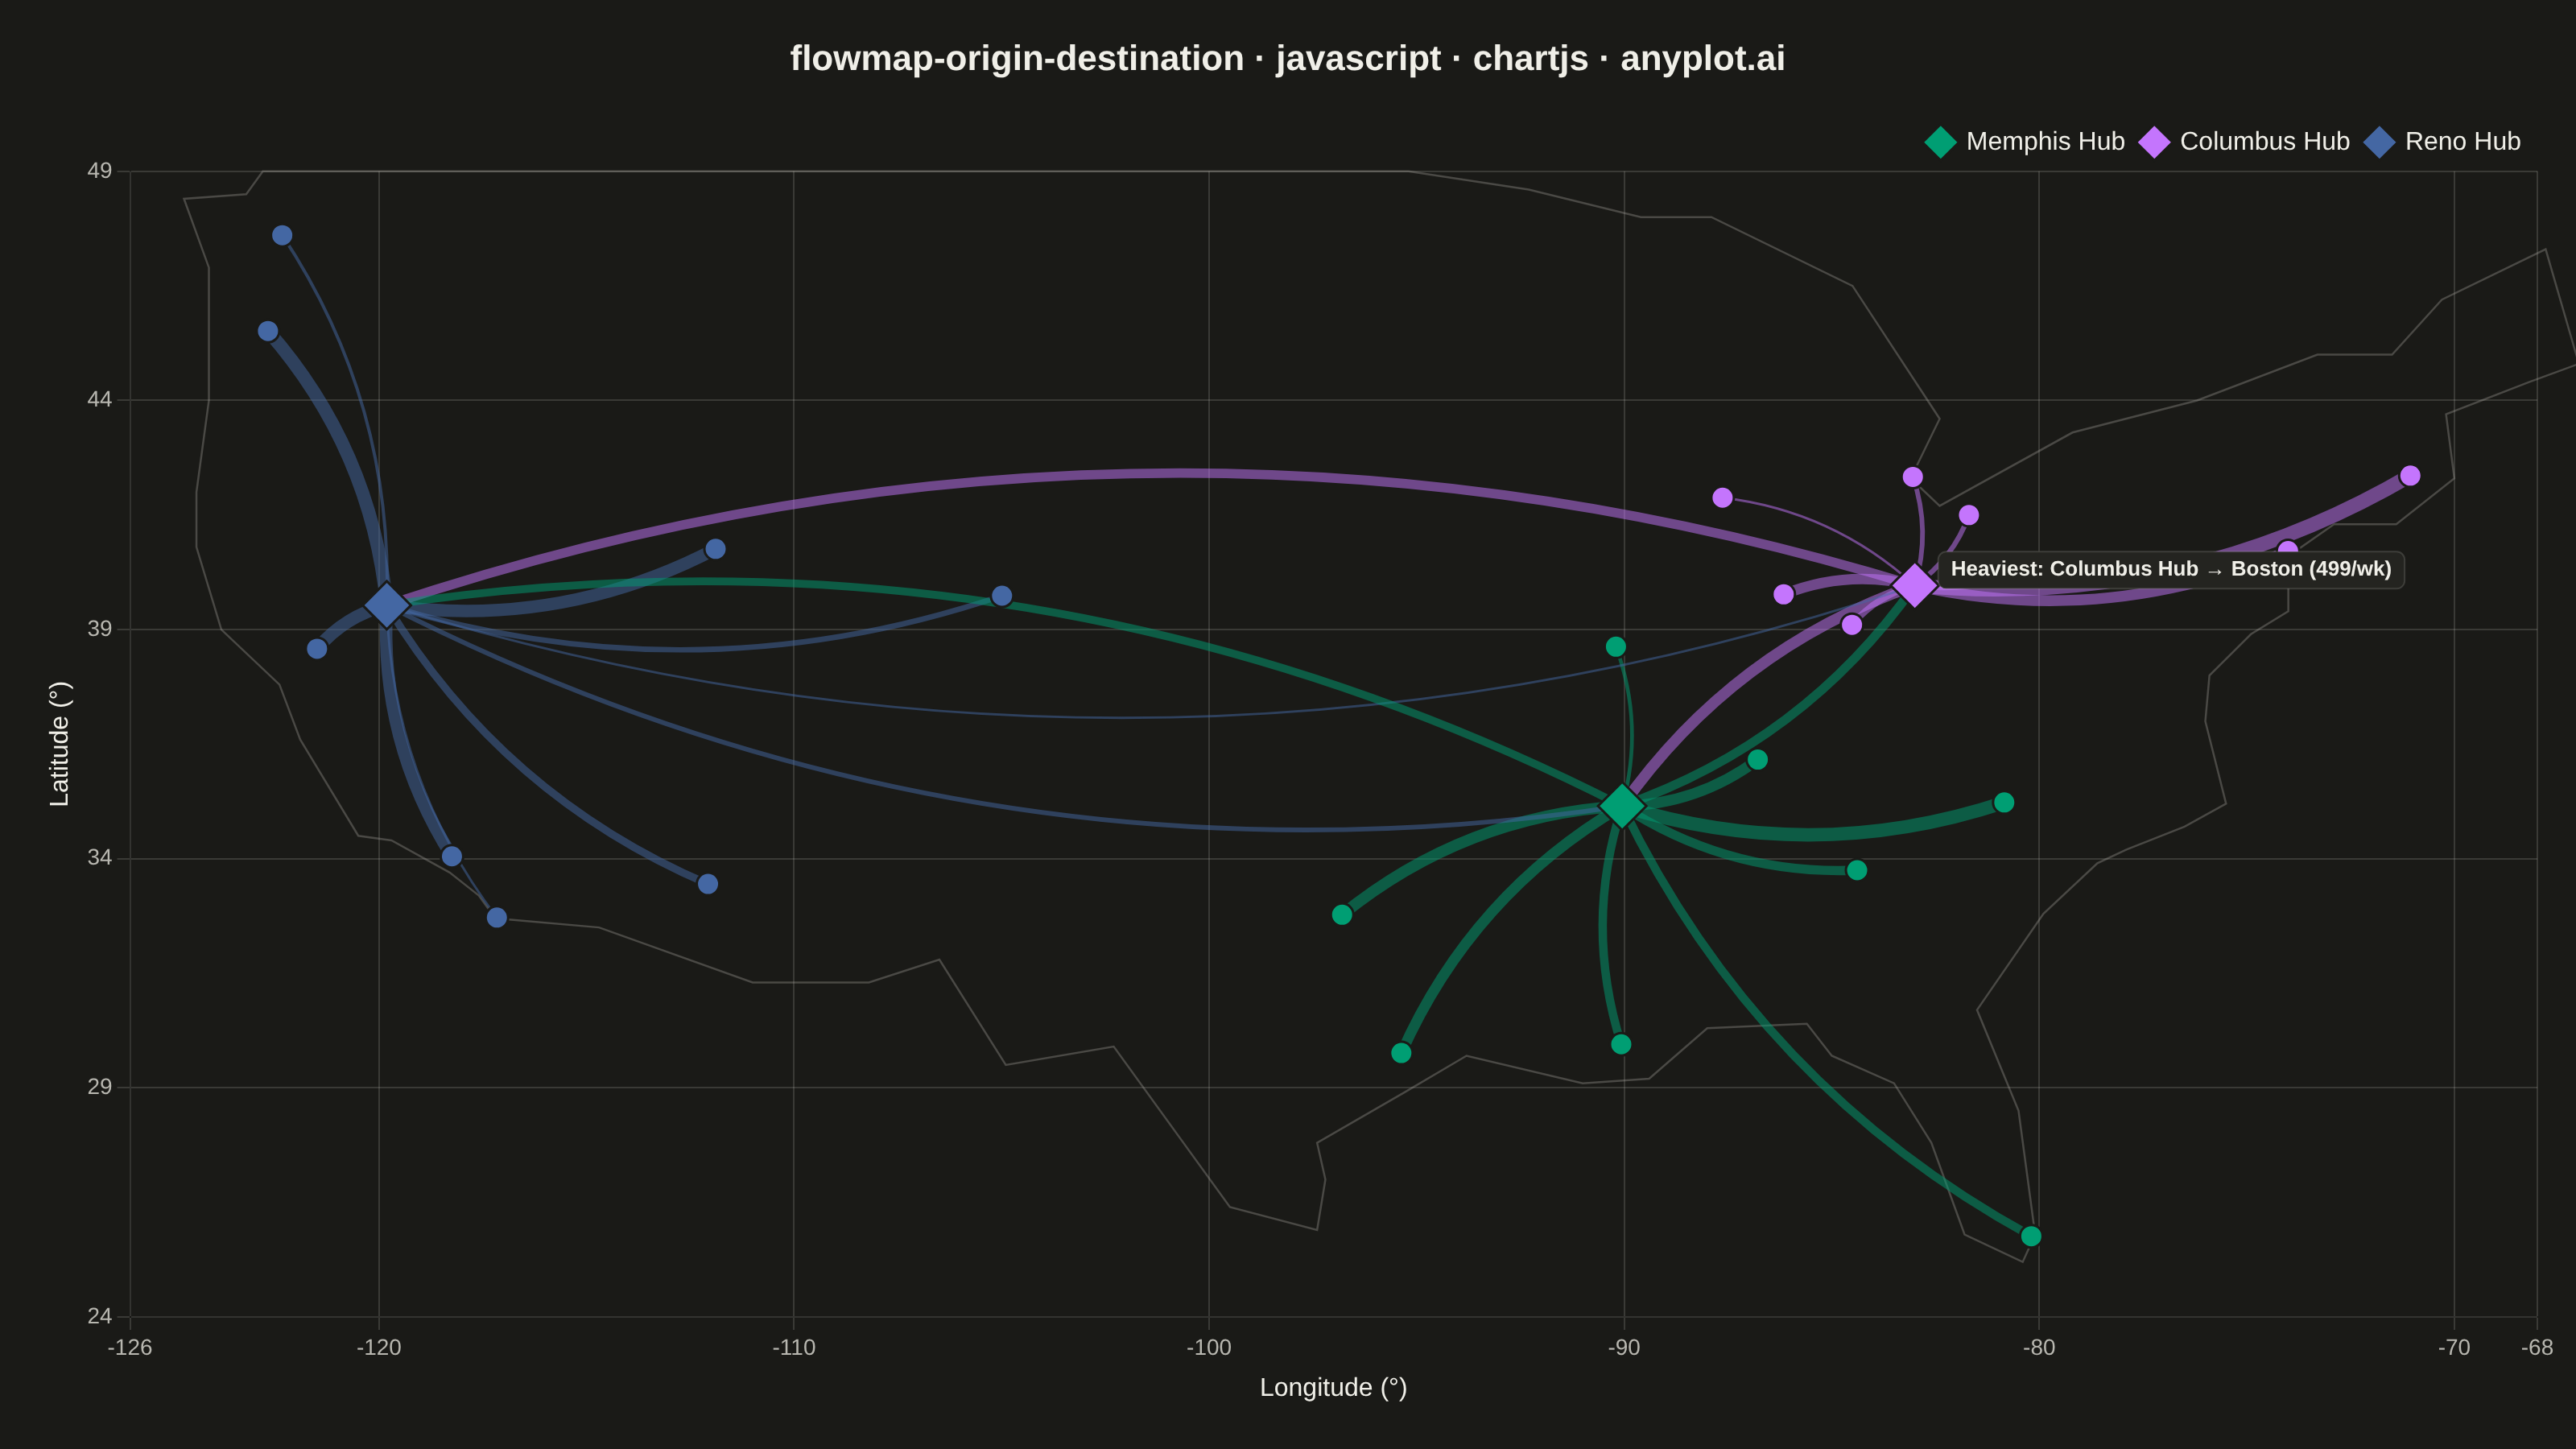
An origin-destination flow map visualizes movement or transfer between geographic locations using curved arcs overlaid on a map. Each arc connects an origin point to a destination point, with line thickness proportional to the flow magnitude. This visualization excels at revealing spatial patterns in migration, trade, or travel data, making it easy to identify major corridors, hub locations, and directional imbalances in movement between places.
// anyplot.ai
// flowmap-origin-destination: Origin-Destination Flow Map
// Library: chartjs 4.4.7 | JavaScript 22.23.2
// Quality: 93/100 | Created: 2026-09-02

const t = window.ANYPLOT_TOKENS;

// --- Deterministic PRNG (LCG, seed 42) --------------------------------------
let seed = 42;
function rand() {
  seed = (seed * 1103515245 + 12345) & 0x7fffffff;
  return seed / 0x7fffffff;
}

// --- Data: a logistics network — three US distribution hubs shipping crates
// to regional retail centers. Flow (crates/week) sets arc thickness.
const hubs = [
  {
    name: "Memphis Hub",
    lon: -90.049,
    lat: 35.1495,
    color: t.palette[0],
    destinations: [
      { name: "Atlanta", lon: -84.388, lat: 33.749 },
      { name: "Miami", lon: -80.1918, lat: 25.7617 },
      { name: "Charlotte", lon: -80.8431, lat: 35.2271 },
      { name: "Nashville", lon: -86.7816, lat: 36.1627 },
      { name: "Dallas", lon: -96.797, lat: 32.7767 },
      { name: "Houston", lon: -95.3698, lat: 29.7604 },
      { name: "New Orleans", lon: -90.0715, lat: 29.9511 },
      { name: "St. Louis", lon: -90.1994, lat: 38.627 },
    ],
  },
  {
    name: "Columbus Hub",
    lon: -82.9988,
    lat: 39.9612,
    color: t.palette[1],
    destinations: [
      { name: "Chicago", lon: -87.6298, lat: 41.8781 },
      { name: "Detroit", lon: -83.0458, lat: 42.3314 },
      { name: "Pittsburgh", lon: -79.9959, lat: 40.4406 },
      { name: "Boston", lon: -71.0589, lat: 42.3601 },
      { name: "New York", lon: -74.006, lat: 40.7128 },
      { name: "Indianapolis", lon: -86.1581, lat: 39.7684 },
      { name: "Cincinnati", lon: -84.512, lat: 39.1031 },
      { name: "Cleveland", lon: -81.6944, lat: 41.4993 },
    ],
  },
  {
    name: "Reno Hub",
    lon: -119.8138,
    lat: 39.5296,
    color: t.palette[2],
    destinations: [
      { name: "Seattle", lon: -122.3321, lat: 47.6062 },
      { name: "Portland", lon: -122.6765, lat: 45.5152 },
      { name: "Sacramento", lon: -121.4944, lat: 38.5816 },
      { name: "Los Angeles", lon: -118.2437, lat: 34.0522 },
      { name: "Phoenix", lon: -112.074, lat: 33.4484 },
      { name: "Denver", lon: -104.9903, lat: 39.7392 },
      { name: "Salt Lake City", lon: -111.891, lat: 40.7608 },
      { name: "San Diego", lon: -117.1611, lat: 32.7157 },
    ],
  },
];

// Deterministic shipment volumes and the flat flow list the arc plugin reads.
const flows = [];
hubs.forEach((hub) => {
  hub.destinations.forEach((dest) => {
    dest.flow = Math.round(80 + rand() * 420);
    flows.push({
      originLon: hub.lon,
      originLat: hub.lat,
      destLon: dest.lon,
      destLat: dest.lat,
      color: hub.color,
      volume: dest.flow,
      originName: hub.name,
      destName: dest.name,
    });
  });
  hub.totalFlow = hub.destinations.reduce((sum, d) => sum + d.flow, 0);
});

// Hub-to-hub trunk flows (both directions per pair) — independently sampled
// volumes naturally show the directional imbalance the spec calls out
// (e.g. Memphis ships far more to Columbus than it receives back).
const hubPairs = [
  [0, 1],
  [1, 0],
  [1, 2],
  [2, 1],
  [2, 0],
  [0, 2],
];
hubPairs.forEach(([i, j]) => {
  const origin = hubs[i];
  const dest = hubs[j];
  const volume = Math.round(60 + rand() * 340);
  flows.push({
    originLon: origin.lon,
    originLat: origin.lat,
    destLon: dest.lon,
    destLat: dest.lat,
    color: origin.color,
    volume,
    originName: origin.name,
    destName: dest.name,
  });
});

const flowValues = flows.map((f) => f.volume);
const minFlow = Math.min(...flowValues);
const maxFlow = Math.max(...flowValues);
const widthFor = (v) => 1.5 + ((v - minFlow) / (maxFlow - minFlow)) * 7.5;
const heaviestFlow = flows.reduce((max, f) => (f.volume > max.volume ? f : max), flows[0]);

function withAlpha(hex, alpha) {
  const r = parseInt(hex.slice(1, 3), 16);
  const g = parseInt(hex.slice(3, 5), 16);
  const b = parseInt(hex.slice(5, 7), 16);
  return `rgba(${r}, ${g}, ${b}, ${alpha})`;
}

// --- Simplified contiguous-US border (static, hand-digitized low-res
// coastline/border vertices) — a light geographic reference frame drawn with
// the same canvas-plugin technique, since chartjs.md forbids a geo plugin.
const usOutline = [
  [-124.7, 48.4], [-124.1, 46.9], [-124.1, 44.0], [-124.4, 42.0], [-124.4, 40.8],
  [-123.8, 39.0], [-122.4, 37.8], [-121.9, 36.6], [-120.5, 34.5], [-119.7, 34.4],
  [-118.3, 33.7], [-117.6, 33.2], [-117.2, 32.7],
  [-114.7, 32.5], [-111.0, 31.3], [-108.2, 31.3], [-106.5, 31.8],
  [-104.9, 29.5], [-102.3, 29.9], [-99.5, 26.4], [-97.4, 25.9],
  [-97.2, 27.0], [-97.4, 27.8], [-95.3, 28.9], [-93.8, 29.7],
  [-91.0, 29.1], [-89.4, 29.2], [-88.0, 30.3], [-85.6, 30.4],
  [-85.0, 29.7], [-83.5, 29.1], [-82.6, 27.8], [-81.8, 25.8],
  [-80.4, 25.2], [-80.1, 25.8], [-80.5, 28.5], [-81.5, 30.7],
  [-79.9, 32.8], [-78.6, 33.9], [-77.9, 34.2], [-76.5, 34.7],
  [-75.5, 35.2], [-76.0, 37.0], [-75.9, 38.0], [-74.9, 38.9],
  [-74.0, 39.4], [-74.0, 40.6], [-72.9, 41.3], [-71.4, 41.3],
  [-70.0, 42.3], [-70.2, 43.7], [-68.2, 44.4], [-67.0, 44.8],
  [-67.8, 47.3], [-70.3, 46.2], [-71.5, 45.0], [-73.3, 45.0],
  [-76.2, 44.0], [-79.2, 43.3], [-82.4, 41.7], [-83.1, 42.3],
  [-82.4, 43.6], [-84.5, 46.5], [-87.9, 48.0], [-89.6, 48.0],
  [-92.3, 48.6], [-95.2, 49.0], [-104.0, 49.0], [-114.0, 49.0],
  [-117.0, 49.0], [-122.8, 49.0], [-123.2, 48.5], [-124.7, 48.4],
];

const basemapPlugin = {
  id: "basemap",
  beforeDatasetsDraw(chart) {
    const { ctx, scales } = chart;
    const { x, y } = scales;
    ctx.save();
    ctx.beginPath();
    usOutline.forEach(([lon, lat], i) => {
      const px = x.getPixelForValue(lon);
      const py = y.getPixelForValue(lat);
      if (i === 0) ctx.moveTo(px, py);
      else ctx.lineTo(px, py);
    });
    ctx.closePath();
    ctx.lineWidth = 1.25;
    ctx.strokeStyle = withAlpha(t.inkSoft, 0.3);
    ctx.stroke();
    ctx.restore();
  },
};

// --- Custom plugin: draw curved flow arcs beneath the city markers ---------
// Uses only the chart's own scales + canvas context (core Chart.js plugin
// hooks), not a community geo/flow chart-type plugin.
const flowArcsPlugin = {
  id: "flowArcs",
  beforeDatasetsDraw(chart) {
    const { ctx, scales } = chart;
    const { x, y } = scales;
    ctx.save();
    flows.forEach((f) => {
      const x0 = x.getPixelForValue(f.originLon);
      const y0 = y.getPixelForValue(f.originLat);
      const x1 = x.getPixelForValue(f.destLon);
      const y1 = y.getPixelForValue(f.destLat);
      const dx = x1 - x0;
      const dy = y1 - y0;
      const dist = Math.hypot(dx, dy) || 1;
      const bow = dist * 0.16;
      const cx = (x0 + x1) / 2 - (dy / dist) * bow;
      const cy = (y0 + y1) / 2 + (dx / dist) * bow;
      ctx.beginPath();
      ctx.moveTo(x0, y0);
      ctx.quadraticCurveTo(cx, cy, x1, y1);
      ctx.lineWidth = widthFor(f.volume);
      ctx.lineCap = "round";
      ctx.strokeStyle = withAlpha(f.color, 0.5);
      ctx.stroke();
      // Cache the arc's midpoint (t=0.5 on the quadratic Bezier) so the
      // callout plugin can label the heaviest corridor without recomputing.
      f.midX = 0.25 * x0 + 0.5 * cx + 0.25 * x1;
      f.midY = 0.25 * y0 + 0.5 * cy + 0.25 * y1;
    });
    ctx.restore();
  },
};

// --- Custom plugin: callout label on the single heaviest corridor ----------
const calloutPlugin = {
  id: "flowCallout",
  afterDatasetsDraw(chart) {
    const { ctx } = chart;
    const label = `Heaviest: ${heaviestFlow.originName} → ${heaviestFlow.destName} (${heaviestFlow.volume}/wk)`;
    ctx.save();
    ctx.font = "bold 13px sans-serif";
    ctx.textAlign = "center";
    ctx.textBaseline = "middle";
    const metrics = ctx.measureText(label);
    const padX = 8;
    const padY = 5;
    const boxW = metrics.width + padX * 2;
    const boxH = 13 + padY * 2;
    const bx = heaviestFlow.midX - boxW / 2;
    const by = heaviestFlow.midY - boxH / 2;
    ctx.fillStyle = t.elevatedBg;
    ctx.strokeStyle = t.grid;
    ctx.lineWidth = 1;
    ctx.beginPath();
    ctx.roundRect(bx, by, boxW, boxH, 5);
    ctx.fill();
    ctx.stroke();
    ctx.fillStyle = t.ink;
    ctx.fillText(label, heaviestFlow.midX, heaviestFlow.midY);
    ctx.restore();
  },
};

// --- Mount -------------------------------------------------------------------
const canvas = document.createElement("canvas");
document.getElementById("container").appendChild(canvas);

// --- Datasets: one per hub — the hub itself (diamond) plus its destination
// cities (circles), sharing the hub's color so arcs and markers read as one group.
const datasets = hubs.map((hub) => ({
  label: hub.name,
  data: [{ x: hub.lon, y: hub.lat }, ...hub.destinations.map((d) => ({ x: d.lon, y: d.lat }))],
  pointMeta: [
    { name: hub.name, detail: `${hub.totalFlow} crates/week outbound` },
    ...hub.destinations.map((d) => ({ name: d.name, detail: `${d.flow} crates/week from ${hub.name}` })),
  ],
  backgroundColor: hub.color,
  borderColor: t.pageBg,
  borderWidth: 1.5,
  pointStyle: ["rectRot", ...hub.destinations.map(() => "circle")],
  pointRadius: [15, ...hub.destinations.map(() => 7)],
  pointHoverRadius: [17, ...hub.destinations.map(() => 9)],
  showLine: false,
}));

// --- Chart -------------------------------------------------------------------
new Chart(canvas, {
  type: "scatter",
  data: { datasets },
  plugins: [basemapPlugin, flowArcsPlugin, calloutPlugin],
  options: {
    responsive: true,
    maintainAspectRatio: false,
    animation: false,
    layout: { padding: 24 },
    plugins: {
      title: {
        display: true,
        text: "flowmap-origin-destination · javascript · chartjs · anyplot.ai",
        color: t.ink,
        font: { size: 22 },
        padding: { bottom: 20 },
      },
      legend: {
        position: "top",
        align: "end",
        labels: { color: t.ink, font: { size: 16 }, usePointStyle: true },
      },
      tooltip: {
        backgroundColor: t.elevatedBg,
        titleColor: t.ink,
        bodyColor: t.inkSoft,
        borderColor: t.grid,
        borderWidth: 1,
        callbacks: {
          title: (items) => items[0].dataset.pointMeta[items[0].dataIndex].name,
          label: (item) => item.dataset.pointMeta[item.dataIndex].detail,
        },
      },
    },
    scales: {
      x: {
        min: -126,
        max: -68,
        title: { display: true, text: "Longitude (°)", color: t.ink, font: { size: 16 } },
        ticks: { color: t.inkSoft, font: { size: 14 }, stepSize: 10 },
        grid: { color: t.grid },
      },
      y: {
        min: 24,
        max: 49,
        title: { display: true, text: "Latitude (°)", color: t.ink, font: { size: 16 } },
        ticks: { color: t.inkSoft, font: { size: 14 }, stepSize: 5 },
        grid: { color: t.grid },
      },
    },
  },
});
Runnable source as JSON, for any HTTP client: https://api.anyplot.ai/specs/flowmap-origin-destination/chartjs/code. Any spec id and library id listed in llms-full.txt fit the same URL shape; every URL below is complete and callable.
{
  "spec_id": "flowmap-origin-destination",
  "language": "javascript",
  "library": "chartjs",
  "page": "https://anyplot.ai/flowmap-origin-destination/javascript/chartjs",
  "hub": "https://anyplot.ai/flowmap-origin-destination",
  "code_json": "https://api.anyplot.ai/specs/flowmap-origin-destination/chartjs/code",
  "spec_json": "https://api.anyplot.ai/specs/flowmap-origin-destination",
  "render_light_png": "https://storage.googleapis.com/anyplot-images/plots/flowmap-origin-destination/javascript/chartjs/plot-light.png",
  "render_dark_png": "https://storage.googleapis.com/anyplot-images/plots/flowmap-origin-destination/javascript/chartjs/plot-dark.png",
  "interactive_light_html": "https://storage.googleapis.com/anyplot-images/plots/flowmap-origin-destination/javascript/chartjs/plot-light.html",
  "interactive_dark_html": "https://storage.googleapis.com/anyplot-images/plots/flowmap-origin-destination/javascript/chartjs/plot-dark.html",
  "quality_score": 93.0,
  "license": "MIT",
  "guide": "https://anyplot.ai/llms.txt"
}
Part of Origin-Destination Flow Map on anyplot.ai.