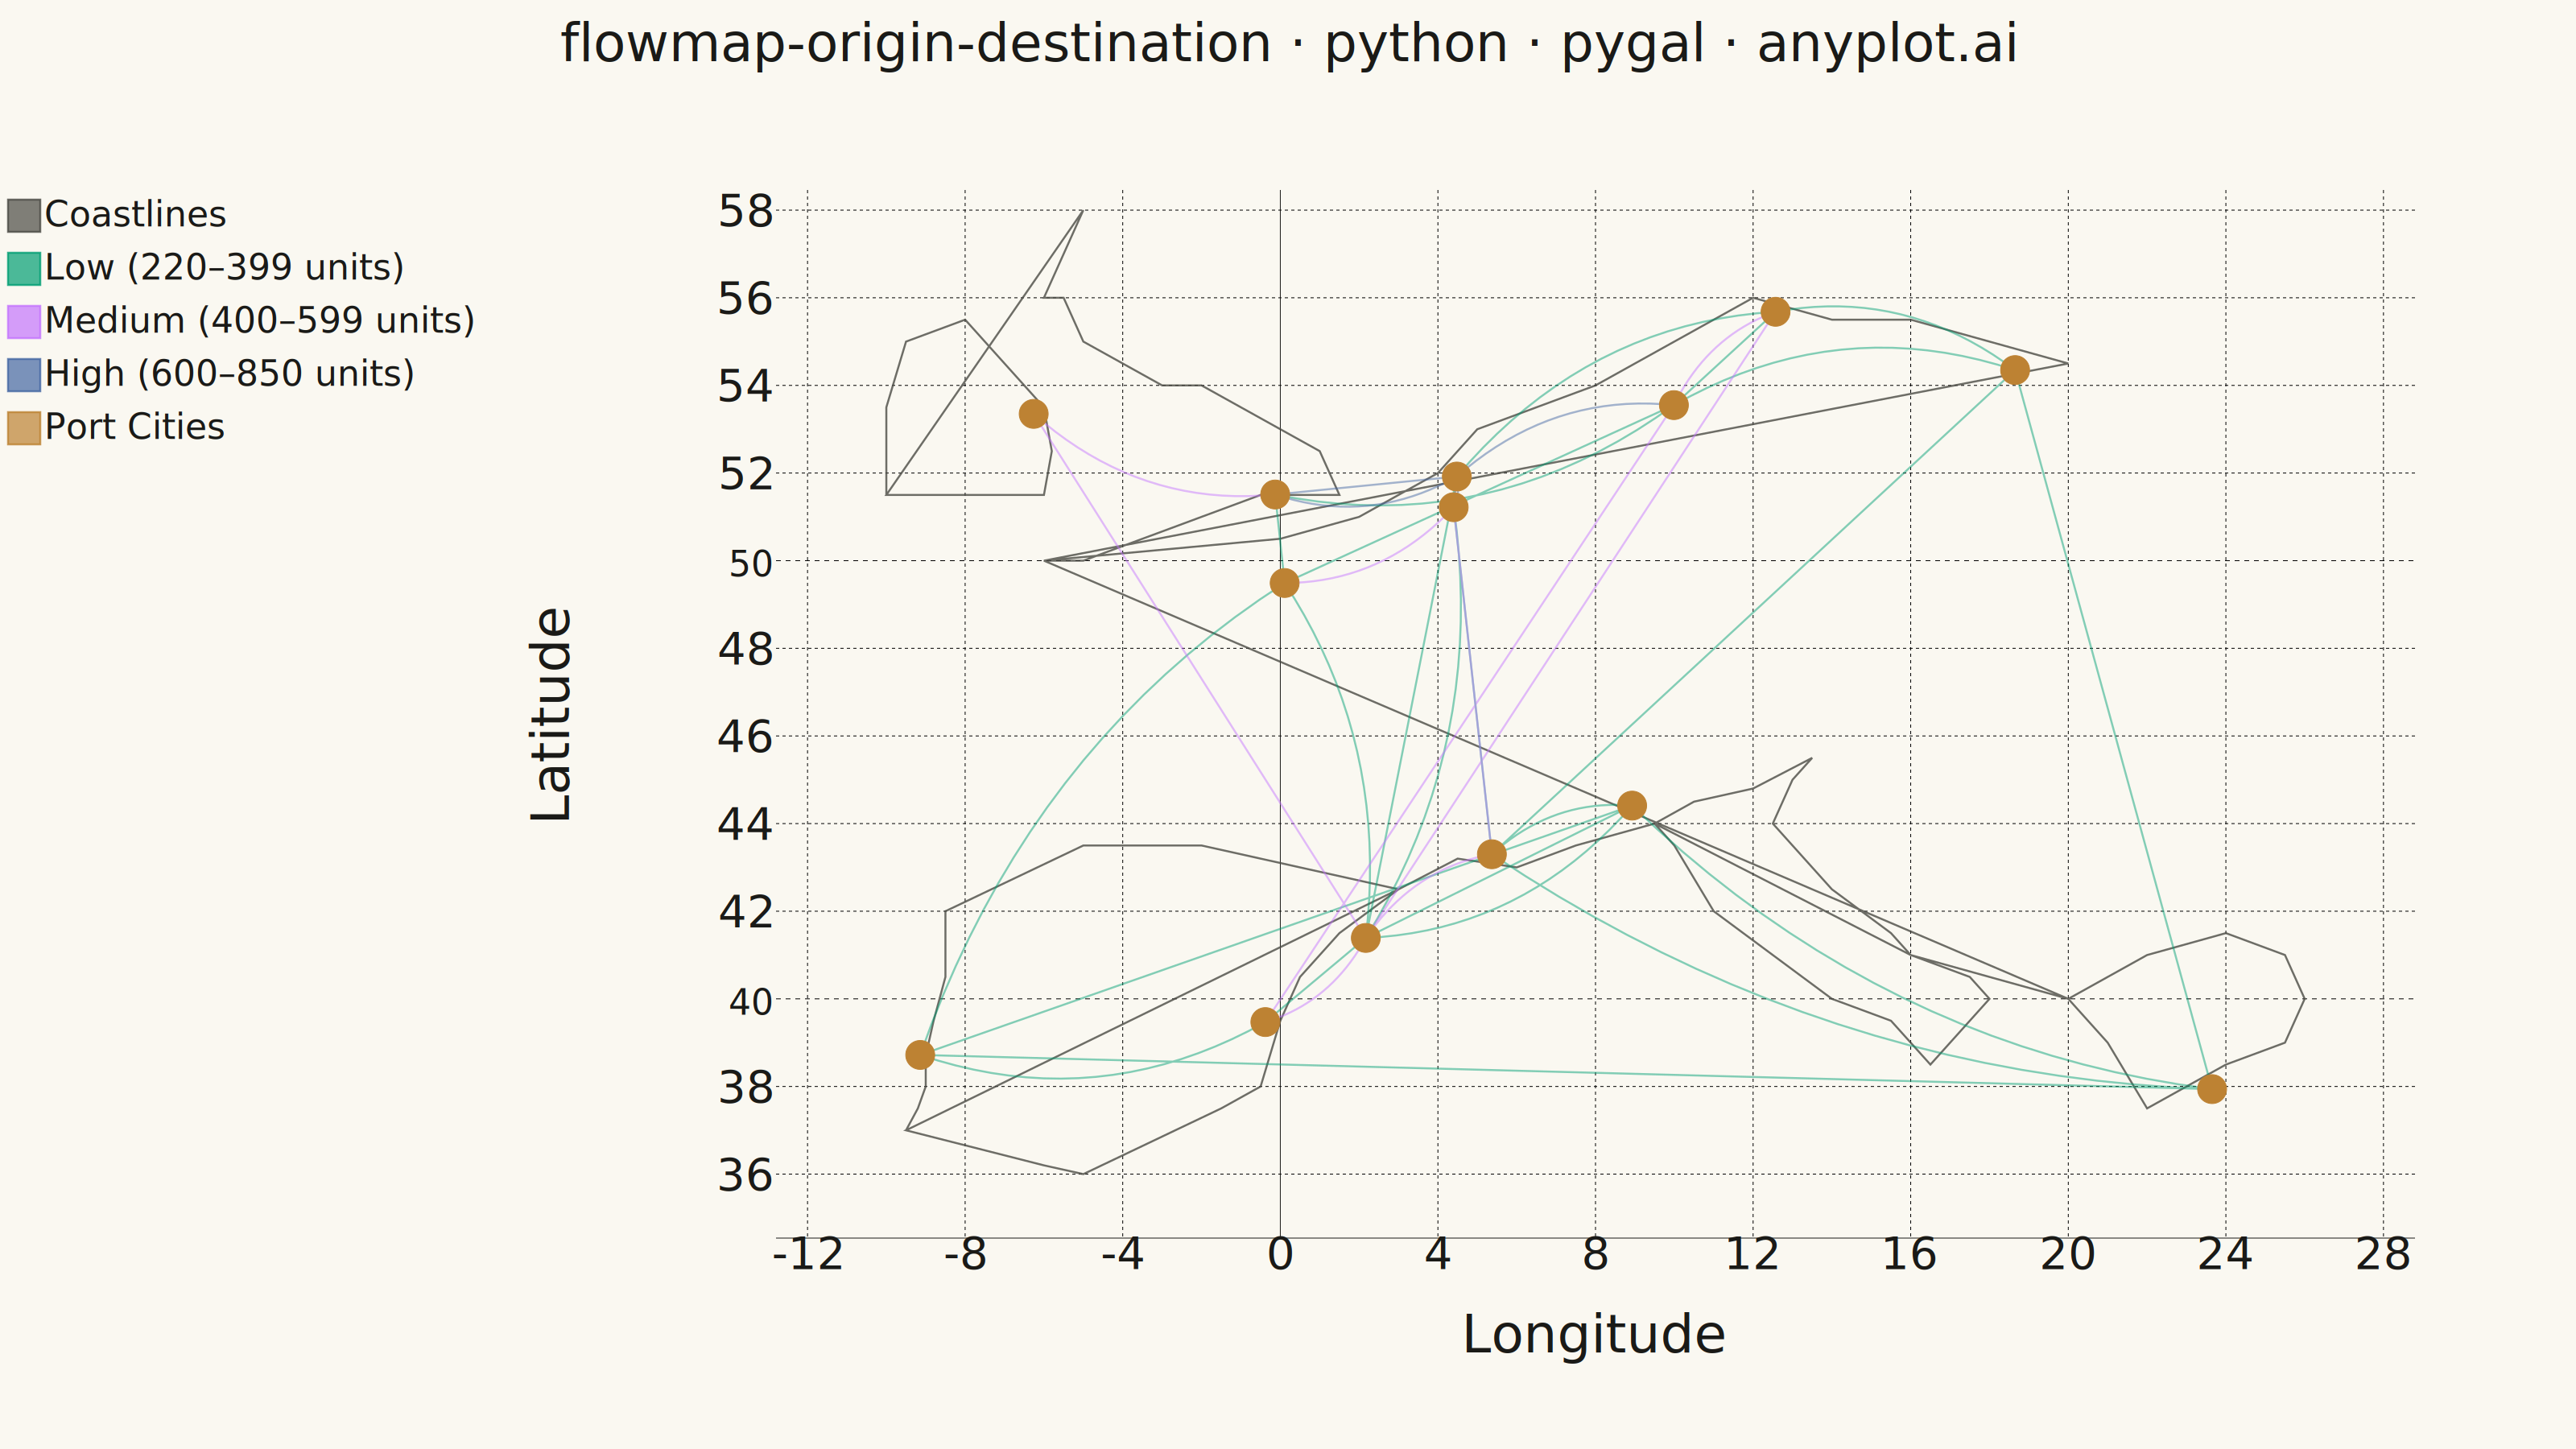
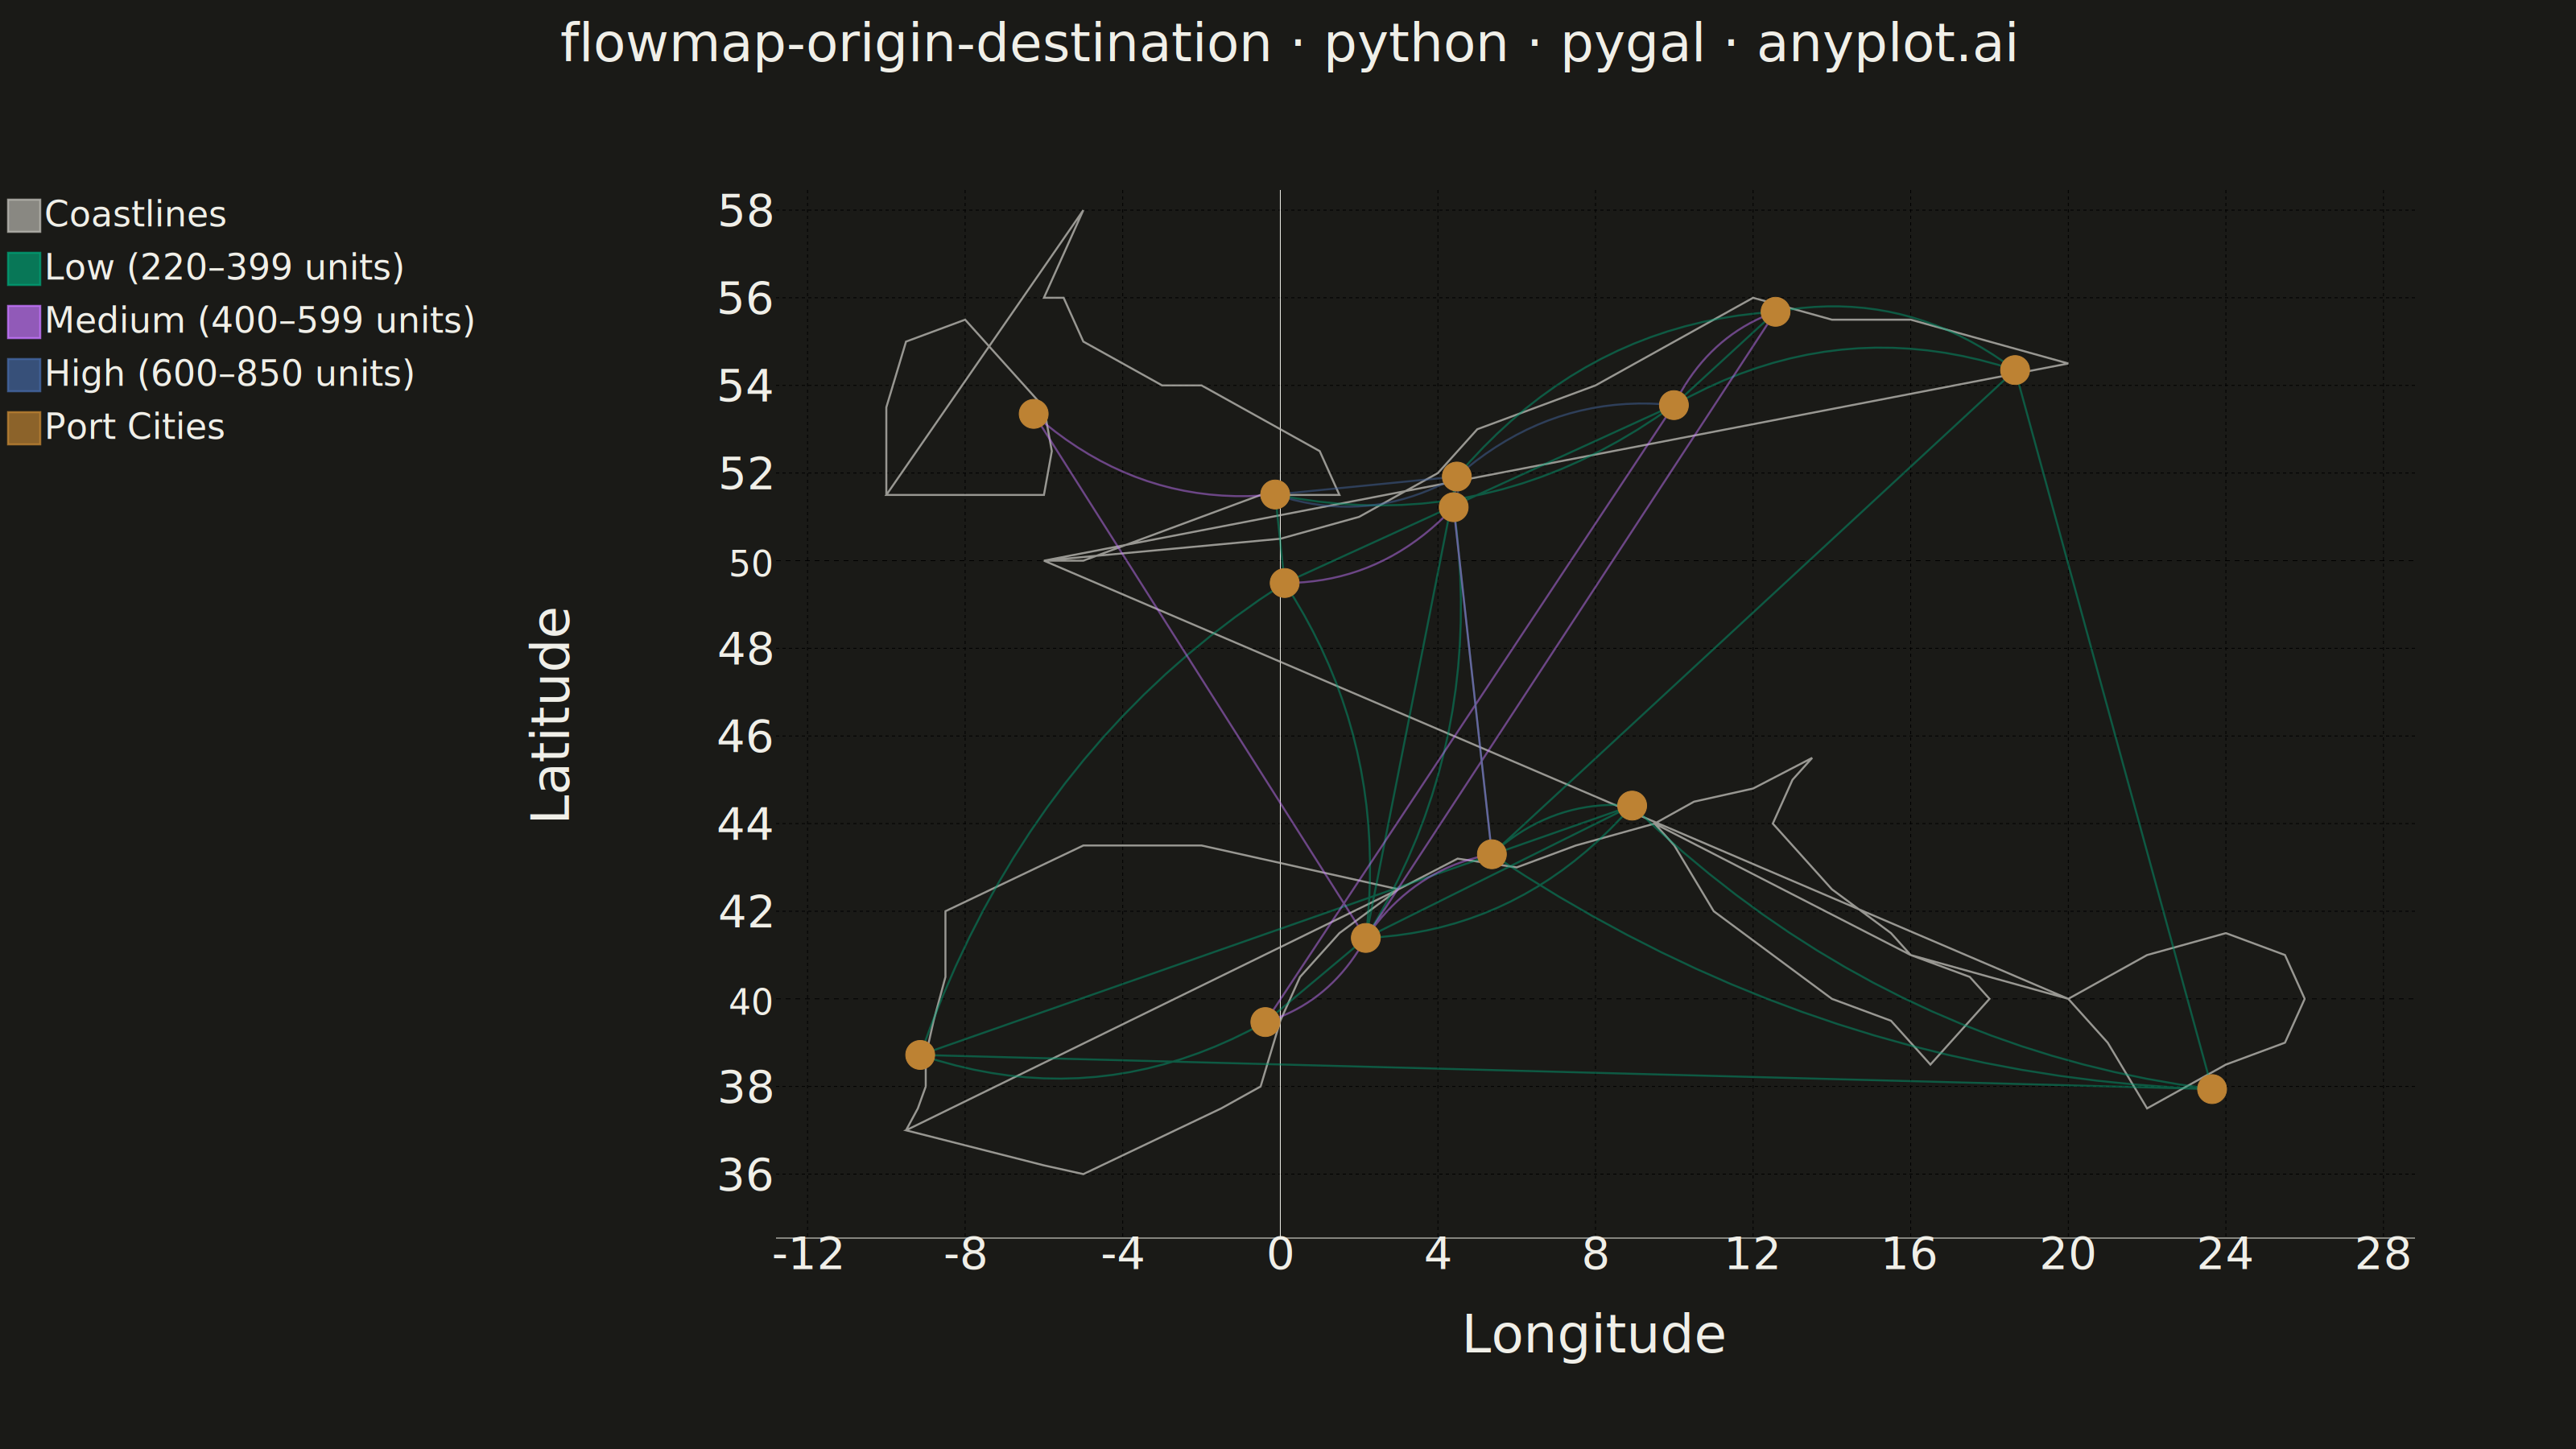
An origin-destination flow map visualizes movement or transfer between geographic locations using curved arcs overlaid on a map. Each arc connects an origin point to a destination point, with line thickness proportional to the flow magnitude. This visualization excels at revealing spatial patterns in migration, trade, or travel data, making it easy to identify major corridors, hub locations, and directional imbalances in movement between places.
""" anyplot.ai
flowmap-origin-destination: Origin-Destination Flow Map
Library: pygal 3.1.0 | Python 3.13.13
Quality: 87/100 | Updated: 2026-05-20
"""

import os
import sys


# Remove this script's directory from sys.path to prevent self-import
# (this file is named pygal.py, which shadows the installed pygal package)
_here = os.path.dirname(os.path.abspath(__file__))
while _here in sys.path:
    sys.path.remove(_here)
del _here

import cairosvg
import numpy as np
import pygal
from pygal.style import Style


THEME = os.getenv("ANYPLOT_THEME", "light")
PAGE_BG = "#FAF8F1" if THEME == "light" else "#1A1A17"
INK = "#1A1A17" if THEME == "light" else "#F0EFE8"
INK_SOFT = "#4A4A44" if THEME == "light" else "#B8B7B0"
INK_MUTED = "#6B6A63" if THEME == "light" else "#A8A79F"

IMPRINT = ("#009E73", "#C475FD", "#4467A3", "#BD8233", "#AE3030", "#2ABCCD", "#954477")

# Data: Trade flows between major European ports
np.random.seed(42)

ports = {
    "Rotterdam": (51.92, 4.48),
    "Hamburg": (53.55, 9.99),
    "Antwerp": (51.22, 4.40),
    "London": (51.51, -0.13),
    "Le Havre": (49.49, 0.11),
    "Barcelona": (41.39, 2.17),
    "Marseille": (43.30, 5.37),
    "Genoa": (44.41, 8.93),
    "Valencia": (39.47, -0.38),
    "Lisbon": (38.72, -9.14),
    "Piraeus": (37.94, 23.65),
    "Copenhagen": (55.68, 12.57),
    "Gdansk": (54.35, 18.65),
    "Dublin": (53.35, -6.26),
}

flow_pairs = [
    ("Rotterdam", "Hamburg", 850),
    ("Rotterdam", "Antwerp", 720),
    ("Rotterdam", "London", 680),
    ("Hamburg", "Copenhagen", 450),
    ("Hamburg", "Gdansk", 380),
    ("Antwerp", "Le Havre", 520),
    ("Le Havre", "Barcelona", 340),
    ("Barcelona", "Valencia", 420),
    ("Barcelona", "Marseille", 480),
    ("Marseille", "Genoa", 390),
    ("Genoa", "Barcelona", 360),
    ("Valencia", "Lisbon", 280),
    ("Lisbon", "Le Havre", 310),
    ("Piraeus", "Genoa", 290),
    ("Piraeus", "Marseille", 250),
    ("London", "Dublin", 410),
    ("Rotterdam", "Copenhagen", 370),
    ("Hamburg", "London", 320),
    ("Antwerp", "Barcelona", 260),
    ("Copenhagen", "Gdansk", 220),
]

flow_data = []
for origin, dest, flow in flow_pairs:
    o_lat, o_lon = ports[origin]
    d_lat, d_lon = ports[dest]
    flow_data.append(
        {
            "origin_lat": o_lat,
            "origin_lon": o_lon,
            "dest_lat": d_lat,
            "dest_lon": d_lon,
            "flow": flow,
            "origin_name": origin,
            "dest_name": dest,
        }
    )

lat_min, lat_max = 35.0, 58.0
lon_min, lon_max = -12.0, 28.0

coastlines = [
    # Iberian Peninsula
    [
        (-9.5, 37.0),
        (-9.2, 37.5),
        (-9.0, 38.0),
        (-9.0, 38.7),
        (-8.8, 39.5),
        (-8.5, 40.5),
        (-8.5, 42.0),
        (-5.0, 43.5),
        (-2.0, 43.5),
        (0.5, 43.0),
        (3.0, 42.5),
        (1.5, 41.5),
        (0.5, 40.5),
        (0.0, 39.5),
        (-0.5, 38.0),
        (-1.5, 37.5),
        (-5.0, 36.0),
        (-6.0, 36.2),
        (-9.5, 37.0),
    ],
    # Southern France + Italian Riviera + Adriatic
    [
        (3.0, 42.5),
        (4.5, 43.2),
        (6.0, 43.0),
        (7.5, 43.5),
        (9.5, 44.0),
        (10.5, 44.5),
        (12.0, 44.8),
        (13.5, 45.5),
        (13.0, 45.0),
        (12.5, 44.0),
        (14.0, 42.5),
        (15.5, 41.5),
        (16.0, 41.0),
    ],
    # Italian peninsula boot
    [
        (9.5, 44.0),
        (10.0, 43.5),
        (11.0, 42.0),
        (12.5, 41.0),
        (14.0, 40.0),
        (15.5, 39.5),
        (16.5, 38.5),
        (18.0, 40.0),
        (17.5, 40.5),
        (16.0, 41.0),
    ],
    # Greece and Aegean coast
    [
        (20.0, 40.0),
        (21.0, 39.0),
        (22.0, 37.5),
        (23.0, 38.0),
        (24.0, 38.5),
        (25.5, 39.0),
        (26.0, 40.0),
        (25.5, 41.0),
        (24.0, 41.5),
        (22.0, 41.0),
        (20.0, 40.0),
    ],
    # Northern European coast (France to Poland)
    [
        (-6.0, 50.0),
        (0.0, 50.5),
        (2.0, 51.0),
        (4.0, 52.0),
        (5.0, 53.0),
        (6.5, 53.5),
        (8.0, 54.0),
        (9.0, 54.5),
        (10.0, 55.0),
        (11.0, 55.5),
        (12.0, 56.0),
        (14.0, 55.5),
        (16.0, 55.5),
        (18.0, 55.0),
        (20.0, 54.5),
    ],
    # Great Britain
    [
        (-6.0, 50.0),
        (-5.0, 50.0),
        (-3.5, 50.5),
        (-2.0, 51.0),
        (-0.5, 51.5),
        (1.5, 51.5),
        (1.0, 52.5),
        (0.0, 53.0),
        (-2.0, 54.0),
        (-3.0, 54.0),
        (-4.0, 54.5),
        (-5.0, 55.0),
        (-5.5, 56.0),
        (-6.0, 56.0),
        (-5.5, 57.0),
        (-5.0, 58.0),
    ],
    # Ireland
    [
        (-10.0, 51.5),
        (-8.5, 51.5),
        (-6.0, 51.5),
        (-5.8, 52.5),
        (-6.0, 53.5),
        (-7.0, 54.5),
        (-8.0, 55.5),
        (-9.5, 55.0),
        (-10.0, 53.5),
        (-10.0, 51.5),
    ],
]


def make_bezier_curves(flows, n_segments=20):
    curves = []
    for flow in flows:
        o_lat, o_lon = flow["origin_lat"], flow["origin_lon"]
        d_lat, d_lon = flow["dest_lat"], flow["dest_lon"]
        magnitude = flow["flow"]
        label = f"{flow['origin_name']} → {flow['dest_name']}: {magnitude} units"
        mid_lon = (o_lon + d_lon) / 2
        mid_lat = (o_lat + d_lat) / 2
        dx, dy = d_lon - o_lon, d_lat - o_lat
        length = np.sqrt(dx * dx + dy * dy)
        if length > 0:
            perp_x, perp_y = -dy / length, dx / length
            offset = min(length * 0.2, 2.5)
            ctrl_lon = mid_lon + perp_x * offset
            ctrl_lat = mid_lat + perp_y * offset
        else:
            ctrl_lon, ctrl_lat = mid_lon, mid_lat
        for i in range(n_segments + 1):
            t = i / n_segments
            lon = (1 - t) ** 2 * o_lon + 2 * (1 - t) * t * ctrl_lon + t**2 * d_lon
            lat = (1 - t) ** 2 * o_lat + 2 * (1 - t) * t * ctrl_lat + t**2 * d_lat
            curves.append({"value": (lon, lat), "label": label})
        curves.append({"value": (None, None)})
    return curves


# Style — INK_SOFT for coastlines (neutral), then Okabe-Ito for data series
custom_style = Style(
    background=PAGE_BG,
    plot_background=PAGE_BG,
    foreground=INK,
    foreground_strong=INK,
    foreground_subtle=INK_MUTED,
    colors=(INK_SOFT,) + IMPRINT,
    title_font_size=66,
    label_font_size=56,
    major_label_font_size=44,
    legend_font_size=44,
    value_font_size=36,
    tooltip_font_size=36,
    font_family="sans-serif",
    stroke_width=2.5,
)

# Chart
chart = pygal.XY(
    width=3200,
    height=1800,
    style=custom_style,
    title="flowmap-origin-destination · python · pygal · anyplot.ai",
    x_title="Longitude",
    y_title="Latitude",
    show_legend=True,
    legend_at_bottom=False,
    legend_box_size=40,
    truncate_legend=-1,
    margin=80,
    margin_top=160,
    margin_bottom=120,
    margin_right=200,
    margin_left=180,
    range=(lat_min, lat_max),
    xrange=(lon_min, lon_max),
    show_dots=True,
    stroke=True,
    dots_size=16,
    tooltip_border_radius=10,
    show_x_guides=True,
    show_y_guides=True,
)

# Coastlines — drawn first (lowest z-order)
coastline_points = []
for segment in coastlines:
    for lon, lat in segment:
        coastline_points.append({"value": (lon, lat), "label": "Coastline"})
    coastline_points.append({"value": (None, None)})

chart.add("Coastlines", coastline_points, stroke=True, show_dots=False, stroke_style={"width": 2})

# Sort by magnitude so high flows are drawn last (on top)
sorted_flows = sorted(flow_data, key=lambda f: f["flow"])
low_flows = [f for f in sorted_flows if f["flow"] < 400]
medium_flows = [f for f in sorted_flows if 400 <= f["flow"] < 600]
high_flows = [f for f in sorted_flows if f["flow"] >= 600]

chart.add(
    "Low (220–399 units)",
    make_bezier_curves(low_flows),
    stroke=True,
    show_dots=False,
    stroke_style={"width": 6, "linecap": "round"},
)
chart.add(
    "Medium (400–599 units)",
    make_bezier_curves(medium_flows),
    stroke=True,
    show_dots=False,
    stroke_style={"width": 14, "linecap": "round"},
)
chart.add(
    "High (600–850 units)",
    make_bezier_curves(high_flows),
    stroke=True,
    show_dots=False,
    stroke_style={"width": 28, "linecap": "round"},
)

# Port cities — drawn last (on top of all arcs)
city_points = []
drawn_locations = set()
for flow in flow_data:
    o_key = (round(flow["origin_lat"], 2), round(flow["origin_lon"], 2))
    if o_key not in drawn_locations:
        city_points.append({"value": (flow["origin_lon"], flow["origin_lat"]), "label": flow["origin_name"]})
        drawn_locations.add(o_key)
    d_key = (round(flow["dest_lat"], 2), round(flow["dest_lon"], 2))
    if d_key not in drawn_locations:
        city_points.append({"value": (flow["dest_lon"], flow["dest_lat"]), "label": flow["dest_name"]})
        drawn_locations.add(d_key)

chart.add("Port Cities", city_points, dots_size=18, stroke=False)

# Save — inject arc transparency via CSS (pygal stroke_style doesn't expose opacity)
svg_bytes = chart.render()
svg_str = svg_bytes.decode("utf-8")
arc_opacity = ".serie-1{opacity:0.6;}.serie-2{opacity:0.6;}.serie-3{opacity:0.6;}"
svg_str = svg_str.replace("</style>", arc_opacity + "</style>", 1)
svg_out = svg_str.encode("utf-8")
cairosvg.svg2png(bytestring=svg_out, write_to=f"plot-{THEME}.png")
with open(f"plot-{THEME}.html", "wb") as f:
    f.write(svg_out)
Runnable source as JSON, for any HTTP client: https://api.anyplot.ai/specs/flowmap-origin-destination/pygal/code. Any spec id and library id listed in llms-full.txt fit the same URL shape; every URL below is complete and callable.
{
  "spec_id": "flowmap-origin-destination",
  "language": "python",
  "library": "pygal",
  "page": "https://anyplot.ai/flowmap-origin-destination/python/pygal",
  "hub": "https://anyplot.ai/flowmap-origin-destination",
  "code_json": "https://api.anyplot.ai/specs/flowmap-origin-destination/pygal/code",
  "spec_json": "https://api.anyplot.ai/specs/flowmap-origin-destination",
  "render_light_png": "https://storage.googleapis.com/anyplot-images/plots/flowmap-origin-destination/python/pygal/plot-light.png",
  "render_dark_png": "https://storage.googleapis.com/anyplot-images/plots/flowmap-origin-destination/python/pygal/plot-dark.png",
  "interactive_light_html": "https://storage.googleapis.com/anyplot-images/plots/flowmap-origin-destination/python/pygal/plot-light.html",
  "interactive_dark_html": "https://storage.googleapis.com/anyplot-images/plots/flowmap-origin-destination/python/pygal/plot-dark.html",
  "quality_score": 87.0,
  "license": "MIT",
  "guide": "https://anyplot.ai/llms.txt"
}
Part of Origin-Destination Flow Map on anyplot.ai.