The same plot in 14 other libraries — JavaScript: Chart.js, D3.js, Highcharts, MUI X Charts; Python: Altair, Bokeh, lets-plot, Matplotlib, Plotly, plotnine, Pygal, Seaborn; R: ggplot2; Julia: Makie.jl. Compare all 15 side by side: Origin-Destination Flow Map in Python, R, Julia and JavaScript.
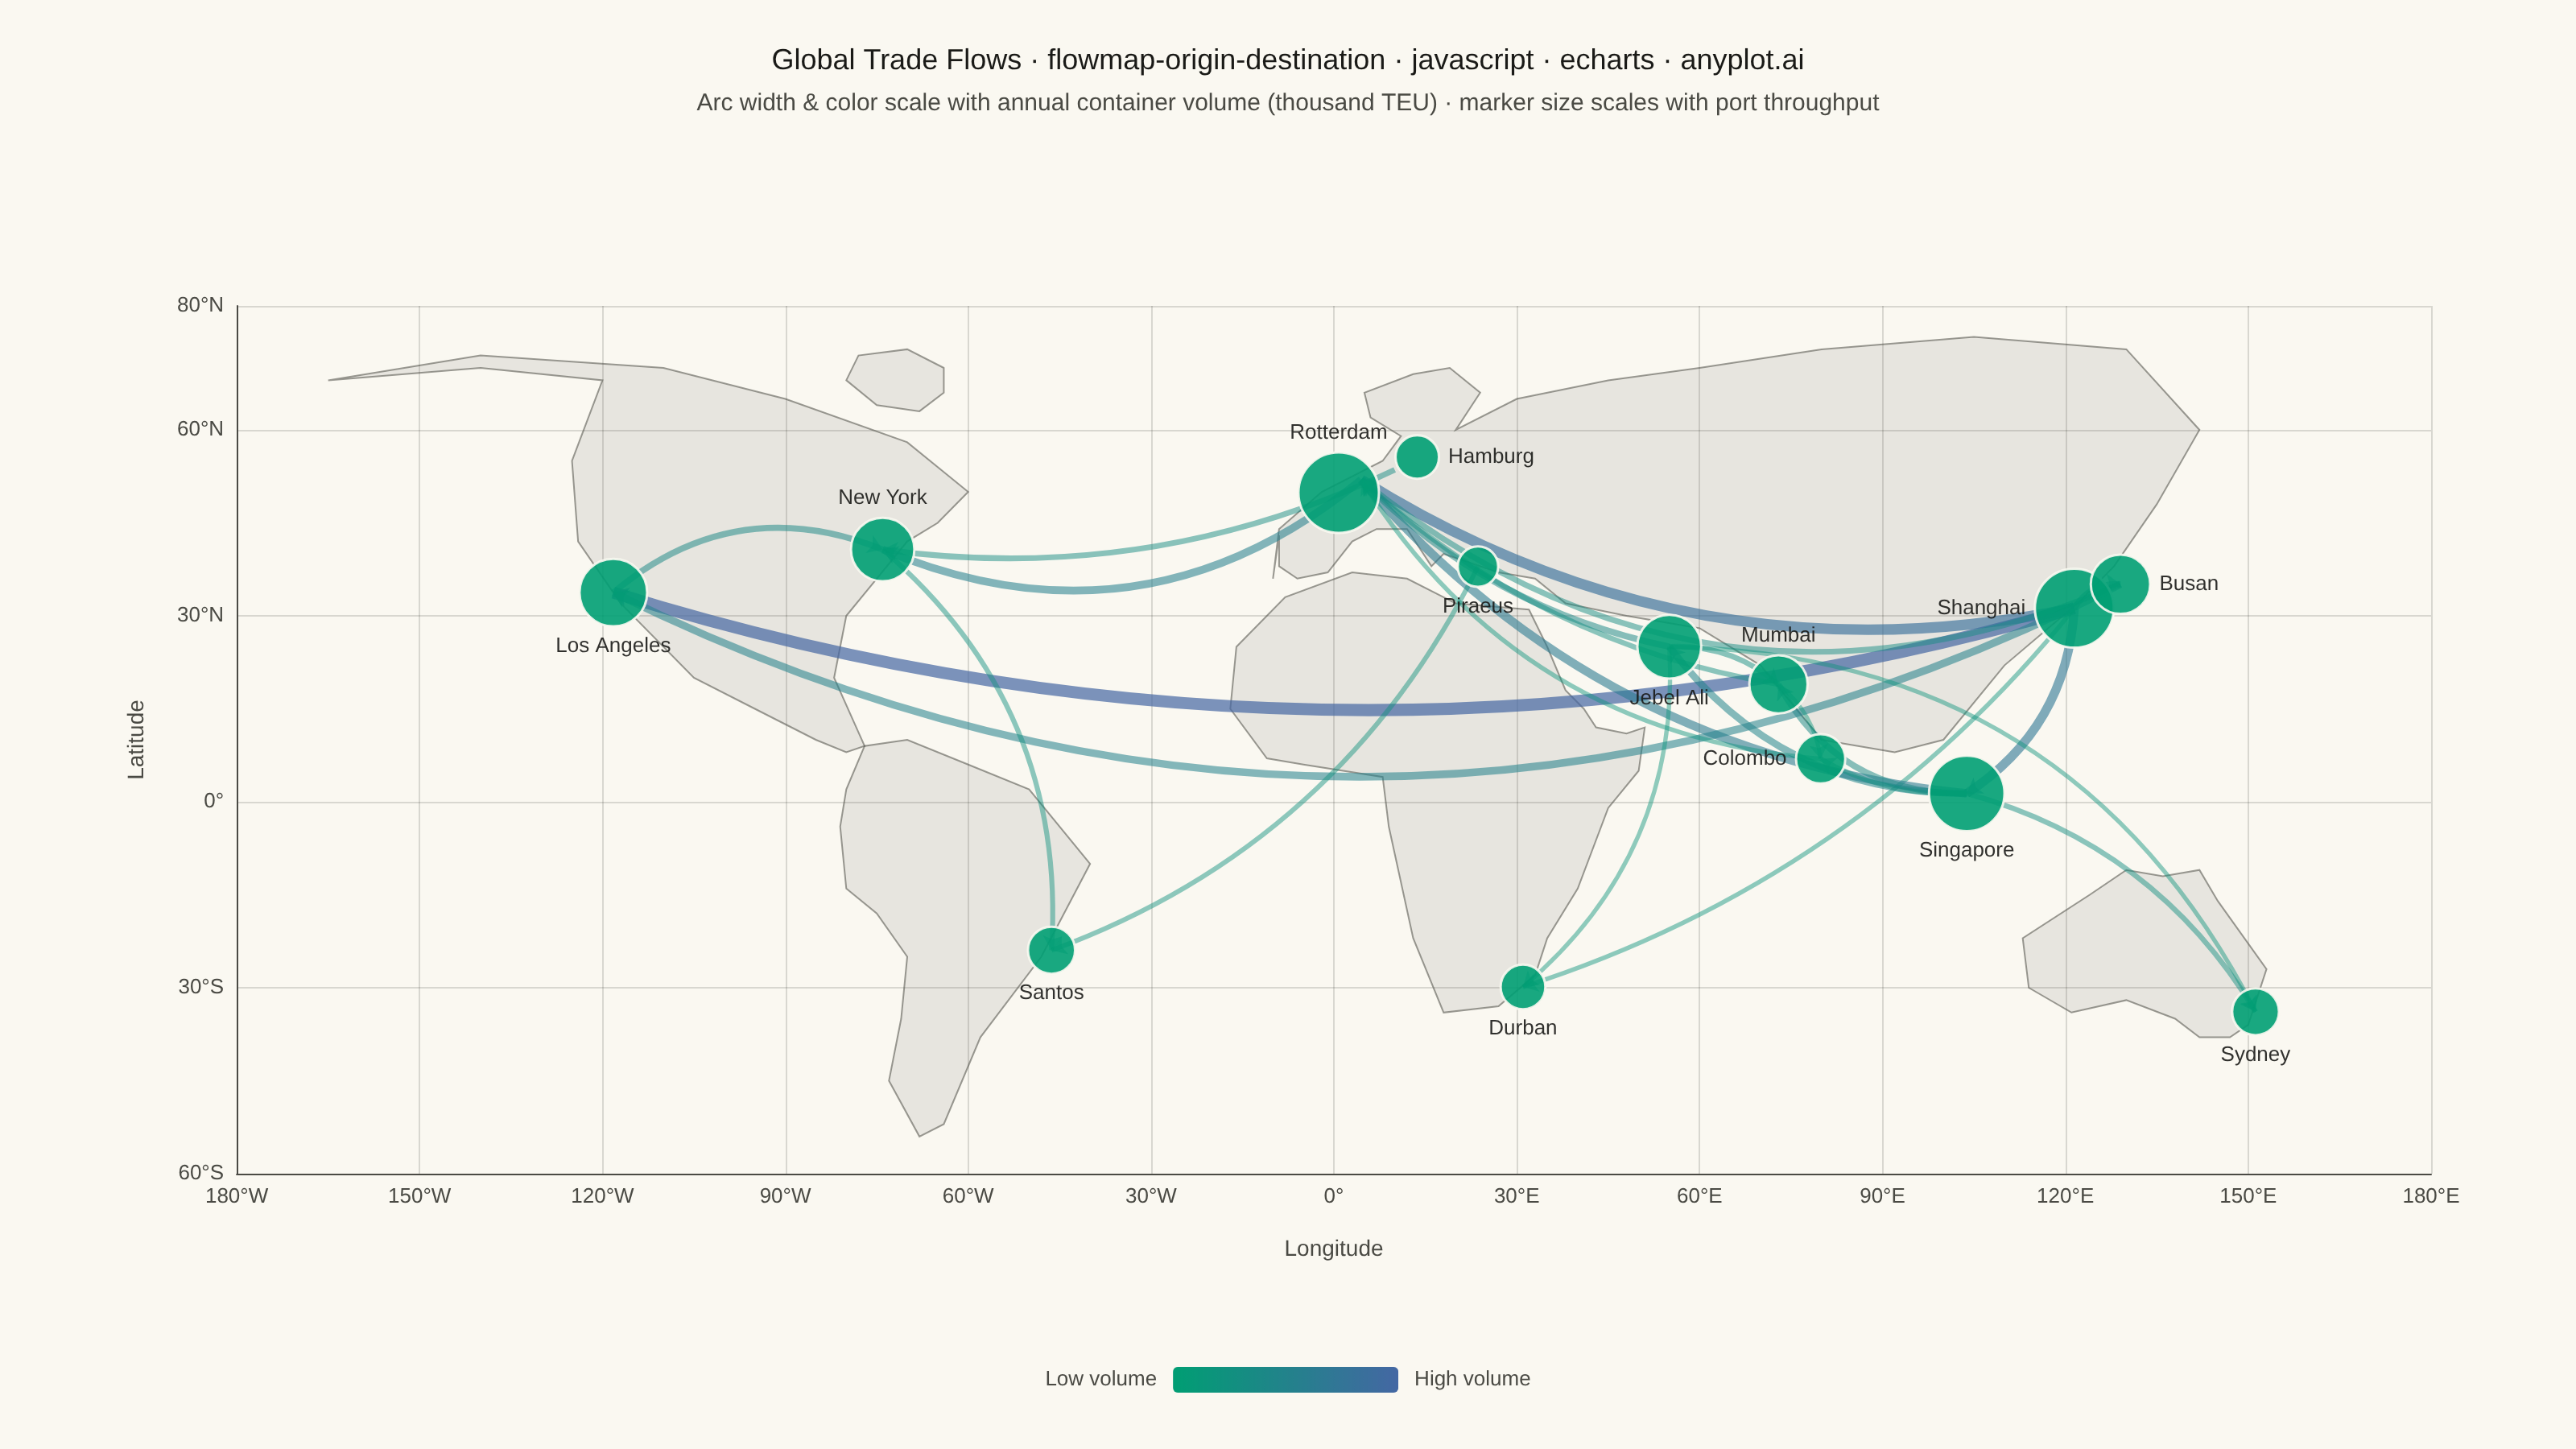
An origin-destination flow map visualizes movement or transfer between geographic locations using curved arcs overlaid on a map. Each arc connects an origin point to a destination point, with line thickness proportional to the flow magnitude. This visualization excels at revealing spatial patterns in migration, trade, or travel data, making it easy to identify major corridors, hub locations, and directional imbalances in movement between places.
// anyplot.ai
// flowmap-origin-destination: Origin-Destination Flow Map
// Library: echarts 6.1.0 | JavaScript 22.23.2
// Quality: 89/100 | Created: 2026-09-02

const t = window.ANYPLOT_TOKENS;

// --- Data (in-memory, deterministic): global container-shipping corridors --
const ports = [
  { code: "SHA", name: "Shanghai", lon: 121.47, lat: 31.23, label: "left" },
  { code: "SIN", name: "Singapore", lon: 103.82, lat: 1.35, label: "bottom" },
  { code: "BUS", name: "Busan", lon: 129.04, lat: 35.1, label: "right" },
  { code: "DXB", name: "Jebel Ali", lon: 55.02, lat: 25.02, label: "bottom" },
  { code: "BOM", name: "Mumbai", lon: 72.93, lat: 18.95, label: "top" },
  { code: "CMB", name: "Colombo", lon: 79.85, lat: 6.93, label: "left" },
  { code: "RTM", name: "Rotterdam", lon: 4.48, lat: 51.95, label: "top" },
  { code: "HAM", name: "Hamburg", lon: 9.97, lat: 53.55, label: "right" },
  { code: "PIR", name: "Piraeus", lon: 23.63, lat: 37.94, label: "bottom" },
  { code: "LAX", name: "Los Angeles", lon: -118.22, lat: 33.75, label: "bottom" },
  { code: "NYC", name: "New York", lon: -74.03, lat: 40.7, label: "top" },
  { code: "SSZ", name: "Santos", lon: -46.33, lat: -23.96, label: "bottom" },
  { code: "DUR", name: "Durban", lon: 31.02, lat: -29.87, label: "bottom" },
  { code: "SYD", name: "Sydney", lon: 151.2, lat: -33.87, label: "bottom" },
];

// [origin, destination, annual containerized volume in thousand TEU]
const routes = [
  ["SHA", "LAX", 3800],
  ["SHA", "RTM", 3200],
  ["SHA", "SIN", 2600],
  ["SHA", "BUS", 1400],
  ["SHA", "DUR", 800],
  ["SIN", "RTM", 2400],
  ["SIN", "DXB", 1800],
  ["SIN", "BOM", 1500],
  ["SIN", "CMB", 900],
  ["SIN", "SYD", 1100],
  ["BUS", "LAX", 2000],
  ["BUS", "RTM", 1300],
  ["DXB", "RTM", 1600],
  ["DXB", "BOM", 1200],
  ["DXB", "DUR", 700],
  ["DXB", "SYD", 750],
  ["BOM", "RTM", 1100],
  ["BOM", "CMB", 600],
  ["CMB", "RTM", 800],
  ["RTM", "NYC", 2100],
  ["HAM", "NYC", 1300],
  ["PIR", "SSZ", 900],
  ["NYC", "SSZ", 1000],
  ["LAX", "NYC", 1500],
];

const byCode = Object.fromEntries(ports.map((p) => [p.code, p]));
const maxFlow = Math.max(...routes.map((r) => r[2]));

const throughput = {};
for (const [origin, dest, teu] of routes) {
  throughput[origin] = (throughput[origin] || 0) + teu;
  throughput[dest] = (throughput[dest] || 0) + teu;
}
const maxThroughput = Math.max(...Object.values(throughput));

// Hand-simplified continent silhouettes (lon/lat vertex lists) so the arcs
// read against a basemap — no bundled world GeoJSON or network fetch is
// available to this offline browser runtime, so coastlines are coarse,
// low-vertex approximations rather than authoritative boundary data.
const NORTH_AMERICA = [
  [-165, 68], [-140, 70], [-120, 68], [-125, 55], [-124, 42], [-117, 32],
  [-105, 20], [-95, 15], [-85, 10], [-80, 8], [-77, 9], [-82, 20], [-80, 30],
  [-75, 36], [-70, 42], [-65, 45], [-60, 50], [-70, 58], [-90, 65],
  [-110, 70], [-140, 72], [-165, 68],
];
const SOUTH_AMERICA = [
  [-77, 9], [-80, 2], [-81, -4], [-80, -14], [-75, -18], [-70, -25],
  [-71, -35], [-73, -45], [-68, -54], [-64, -52], [-58, -38], [-48, -25],
  [-40, -10], [-50, 2], [-60, 6], [-70, 10], [-77, 9],
];
const EURASIA = [
  [-10, 36], [-9, 44], [-2, 50], [8, 55], [11, 59], [6, 62], [5, 66], [13, 69],
  [19, 70], [24, 66], [20, 60], [30, 65], [45, 68], [60, 70], [80, 73],
  [105, 75], [130, 73], [142, 60], [135, 48], [128, 38], [122, 32], [110, 22],
  [100, 10], [92, 8], [80, 10], [70, 22], [60, 28], [48, 30], [38, 32],
  [33, 36], [27, 37], [21, 39], [18, 40], [16, 38], [14, 41], [12, 44],
  [7, 44], [3, 42], [-1, 37], [-6, 36], [-9, 38], [-9, 43], [-10, 36],
];
const BAFFIN_ISLAND = [
  [-64, 70], [-70, 73], [-78, 72], [-80, 68], [-75, 64], [-68, 63], [-64, 66],
  [-64, 70],
];
const AFRICA = [
  [-17, 15], [-16, 25], [-8, 33], [3, 37], [12, 36], [20, 32], [32, 31],
  [35, 25], [38, 18], [41, 15], [43, 12], [48, 11], [51, 12], [50, 5],
  [45, -1], [40, -14], [35, -22], [33, -28], [27, -33], [18, -34], [13, -22],
  [9, -4], [8, 4], [-5, 6], [-11, 7], [-17, 15],
];
const AUSTRALIA = [
  [113, -22], [114, -30], [121, -34], [130, -32], [138, -35], [142, -38],
  [147, -38], [150, -36], [153, -27], [145, -16], [142, -11], [136, -12],
  [130, -11], [124, -15], [113, -22],
];
const CONTINENTS = [
  NORTH_AMERICA,
  BAFFIN_ISLAND,
  SOUTH_AMERICA,
  EURASIA,
  AFRICA,
  AUSTRALIA,
];

function renderLand(coords) {
  return (params, api) => ({
    type: "polygon",
    shape: { points: coords.map((p) => api.coord(p)) },
    style: { fill: t.grid, stroke: t.inkSoft, lineWidth: 1, opacity: 0.55 },
    silent: true,
  });
}

// Line width and opacity scale with flow share; curveness alternates so
// converging routes into the same hub stay visually separable.
const lineData = routes.map(([origin, dest, teu], i) => {
  const share = teu / maxFlow;
  return {
    coords: [
      [byCode[origin].lon, byCode[origin].lat],
      [byCode[dest].lon, byCode[dest].lat],
    ],
    value: teu,
    lineStyle: {
      width: 1.5 + share * 6,
      opacity: 0.4 + share * 0.3,
      curveness: 0.15 + (i % 4) * 0.05,
    },
  };
});

function portSize(volume) {
  const s0 = Math.sqrt(0);
  const s1 = Math.sqrt(maxThroughput);
  const ratio = Math.sqrt(volume) / s1;
  return 16 + ratio * 34;
}

// Rotterdam and Hamburg sit close enough in lon/lat that their throughput-
// scaled circles visually merge; nudge each marker apart on-screen (opposite
// directions, true coordinates untouched) so both stay individually visible.
const PORT_SYMBOL_OFFSET = {
  RTM: [-14, 8],
  HAM: [14, -8],
};

const nodeData = ports.map((p) => ({
  name: p.name,
  value: [p.lon, p.lat, throughput[p.code]],
  label: { position: p.label },
  symbolOffset: PORT_SYMBOL_OFFSET[p.code] || [0, 0],
}));

// --- Init --------------------------------------------------------------
const chart = echarts.init(document.getElementById("container"));

// --- Option --------------------------------------------------------------
const title = "Global Trade Flows · flowmap-origin-destination · javascript · echarts · anyplot.ai";
const titleFontSize = Math.round(22 * Math.min(1, 67 / title.length));
const routesSeriesIndex = CONTINENTS.length;

chart.setOption({
  animation: false,
  backgroundColor: "transparent",
  color: [t.palette[0]],
  title: {
    text: title,
    subtext: "Arc width & color scale with annual container volume (thousand TEU) · marker size scales with port throughput",
    left: "center",
    top: 24,
    textStyle: { color: t.ink, fontSize: titleFontSize, fontWeight: 500 },
    subtextStyle: { color: t.inkSoft, fontSize: 15 },
  },
  tooltip: {
    trigger: "item",
    formatter: (p) =>
      p.seriesType === "lines"
        ? `${p.data.value.toLocaleString()}k TEU/yr`
        : `${p.name}: ${p.value[2].toLocaleString()}k TEU/yr throughput`,
  },
  visualMap: {
    type: "continuous",
    min: 0,
    max: maxFlow,
    seriesIndex: routesSeriesIndex,
    calculable: false,
    orient: "horizontal",
    left: "center",
    bottom: 20,
    itemWidth: 16,
    itemHeight: 140,
    text: ["High volume", "Low volume"],
    textStyle: { color: t.inkSoft, fontSize: 13 },
    inRange: { color: t.seq },
  },
  grid: { left: 110, right: 90, top: 190, bottom: 150, containLabel: true },
  xAxis: {
    type: "value",
    min: -180,
    max: 180,
    interval: 30,
    name: "Longitude",
    nameLocation: "middle",
    nameGap: 40,
    nameTextStyle: { color: t.inkSoft, fontSize: 14 },
    axisLabel: {
      color: t.inkSoft,
      fontSize: 13,
      formatter: (v) => `${Math.abs(v)}°${v > 0 ? "E" : v < 0 ? "W" : ""}`,
    },
    axisLine: { onZero: false, lineStyle: { color: t.inkSoft } },
    axisTick: { show: false },
    splitLine: { show: true, lineStyle: { color: t.grid } },
  },
  yAxis: {
    type: "value",
    min: -60,
    max: 80,
    interval: 30,
    name: "Latitude",
    nameLocation: "middle",
    nameGap: 55,
    nameTextStyle: { color: t.inkSoft, fontSize: 14 },
    axisLabel: {
      color: t.inkSoft,
      fontSize: 13,
      formatter: (v) => `${Math.abs(v)}°${v > 0 ? "N" : v < 0 ? "S" : ""}`,
    },
    axisLine: { onZero: false, lineStyle: { color: t.inkSoft } },
    axisTick: { show: false },
    splitLine: { show: true, lineStyle: { color: t.grid } },
  },
  series: [
    ...CONTINENTS.map((coords, i) => ({
      name: `Basemap ${i}`,
      type: "custom",
      coordinateSystem: "cartesian2d",
      renderItem: renderLand(coords),
      data: [0],
      silent: true,
      tooltip: { show: false },
      z: 1,
    })),
    {
      name: "Trade routes",
      type: "lines",
      coordinateSystem: "cartesian2d",
      symbol: ["none", "arrow"],
      symbolSize: [0, 9],
      data: lineData,
      z: 2,
    },
    {
      name: "Ports",
      type: "scatter",
      data: nodeData,
      symbolSize: (val) => portSize(val[2]),
      itemStyle: { color: t.palette[0], opacity: 0.9, borderColor: t.pageBg, borderWidth: 1.5 },
      label: { show: true, formatter: "{b}", color: t.ink, fontSize: 13, fontWeight: 500 },
      z: 3,
    },
  ],
});
Runnable source as JSON, for any HTTP client: https://api.anyplot.ai/specs/flowmap-origin-destination/echarts/code. Any spec id and library id listed in llms-full.txt fit the same URL shape; every URL below is complete and callable.
{
  "spec_id": "flowmap-origin-destination",
  "language": "javascript",
  "library": "echarts",
  "page": "https://anyplot.ai/flowmap-origin-destination/javascript/echarts",
  "hub": "https://anyplot.ai/flowmap-origin-destination",
  "code_json": "https://api.anyplot.ai/specs/flowmap-origin-destination/echarts/code",
  "spec_json": "https://api.anyplot.ai/specs/flowmap-origin-destination",
  "render_light_png": "https://storage.googleapis.com/anyplot-images/plots/flowmap-origin-destination/javascript/echarts/plot-light.png",
  "render_dark_png": "https://storage.googleapis.com/anyplot-images/plots/flowmap-origin-destination/javascript/echarts/plot-dark.png",
  "interactive_light_html": "https://storage.googleapis.com/anyplot-images/plots/flowmap-origin-destination/javascript/echarts/plot-light.html",
  "interactive_dark_html": "https://storage.googleapis.com/anyplot-images/plots/flowmap-origin-destination/javascript/echarts/plot-dark.html",
  "quality_score": 89.0,
  "license": "MIT",
  "guide": "https://anyplot.ai/llms.txt"
}
Part of Origin-Destination Flow Map on anyplot.ai.