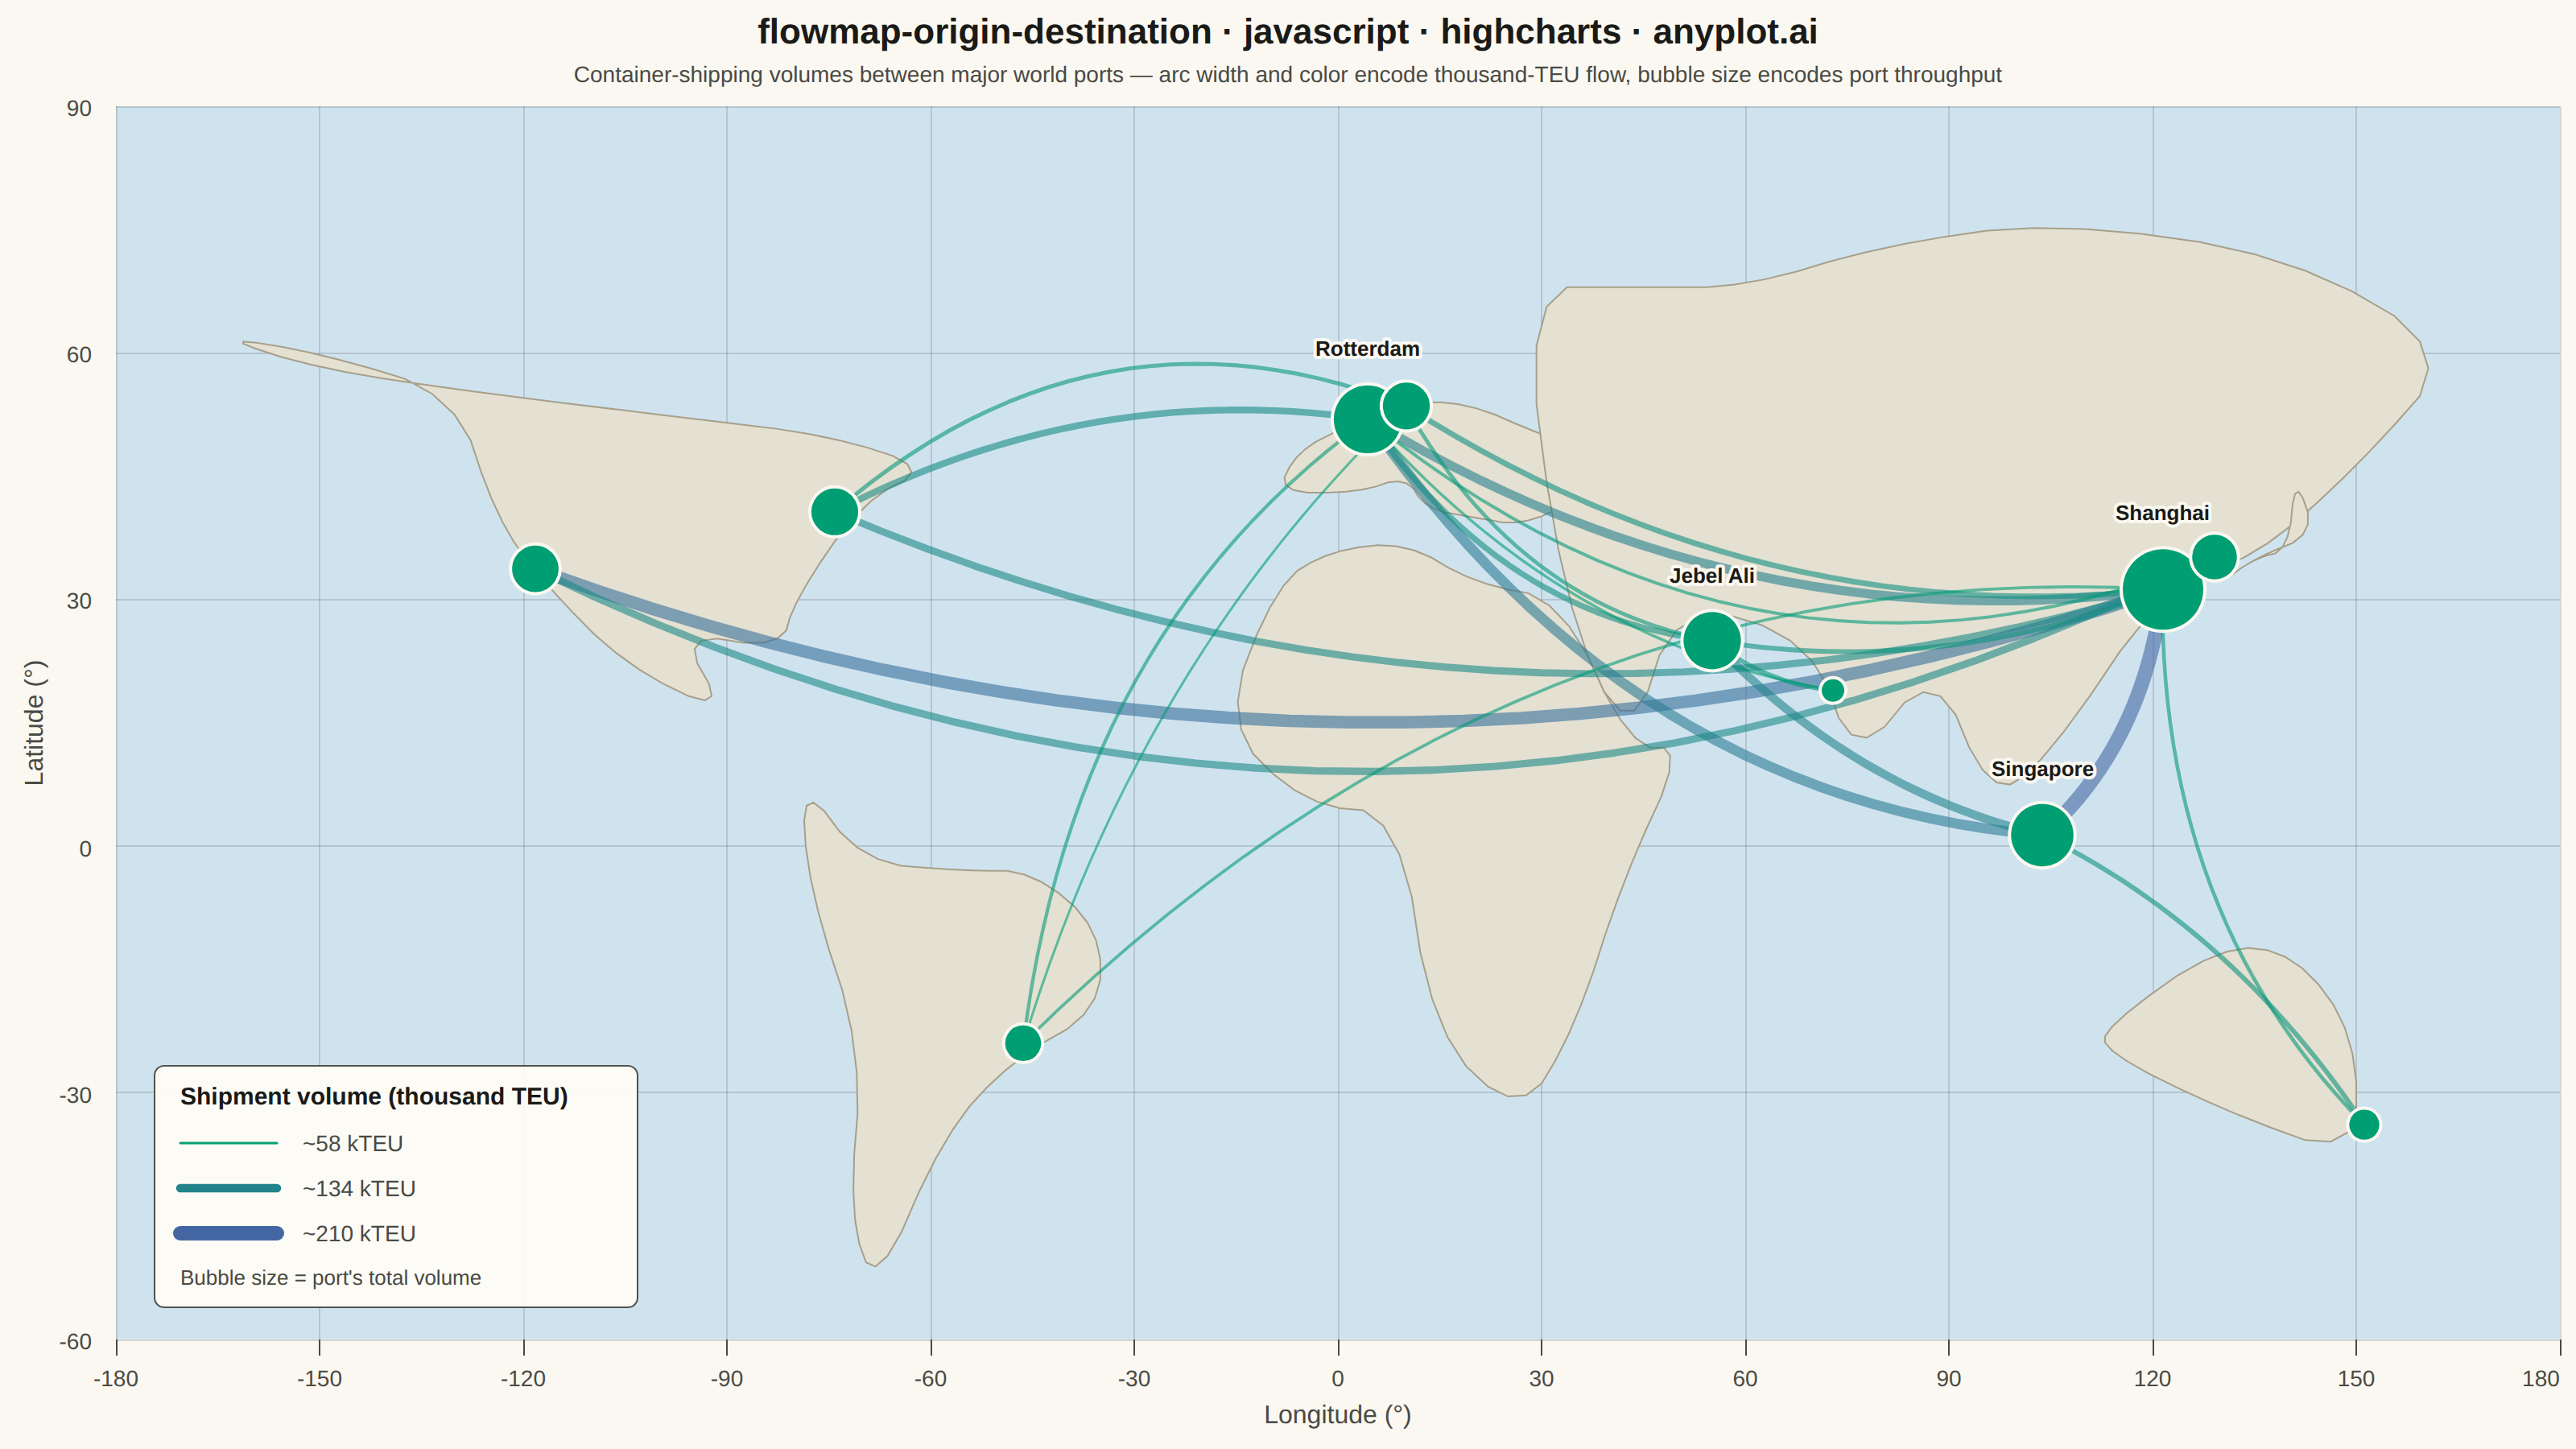
The same plot in 14 other libraries — JavaScript: Chart.js, D3.js, Apache ECharts, MUI X Charts; Python: Altair, Bokeh, lets-plot, Matplotlib, Plotly, plotnine, Pygal, Seaborn; R: ggplot2; Julia: Makie.jl. Compare all 15 side by side: Origin-Destination Flow Map in Python, R, Julia and JavaScript.
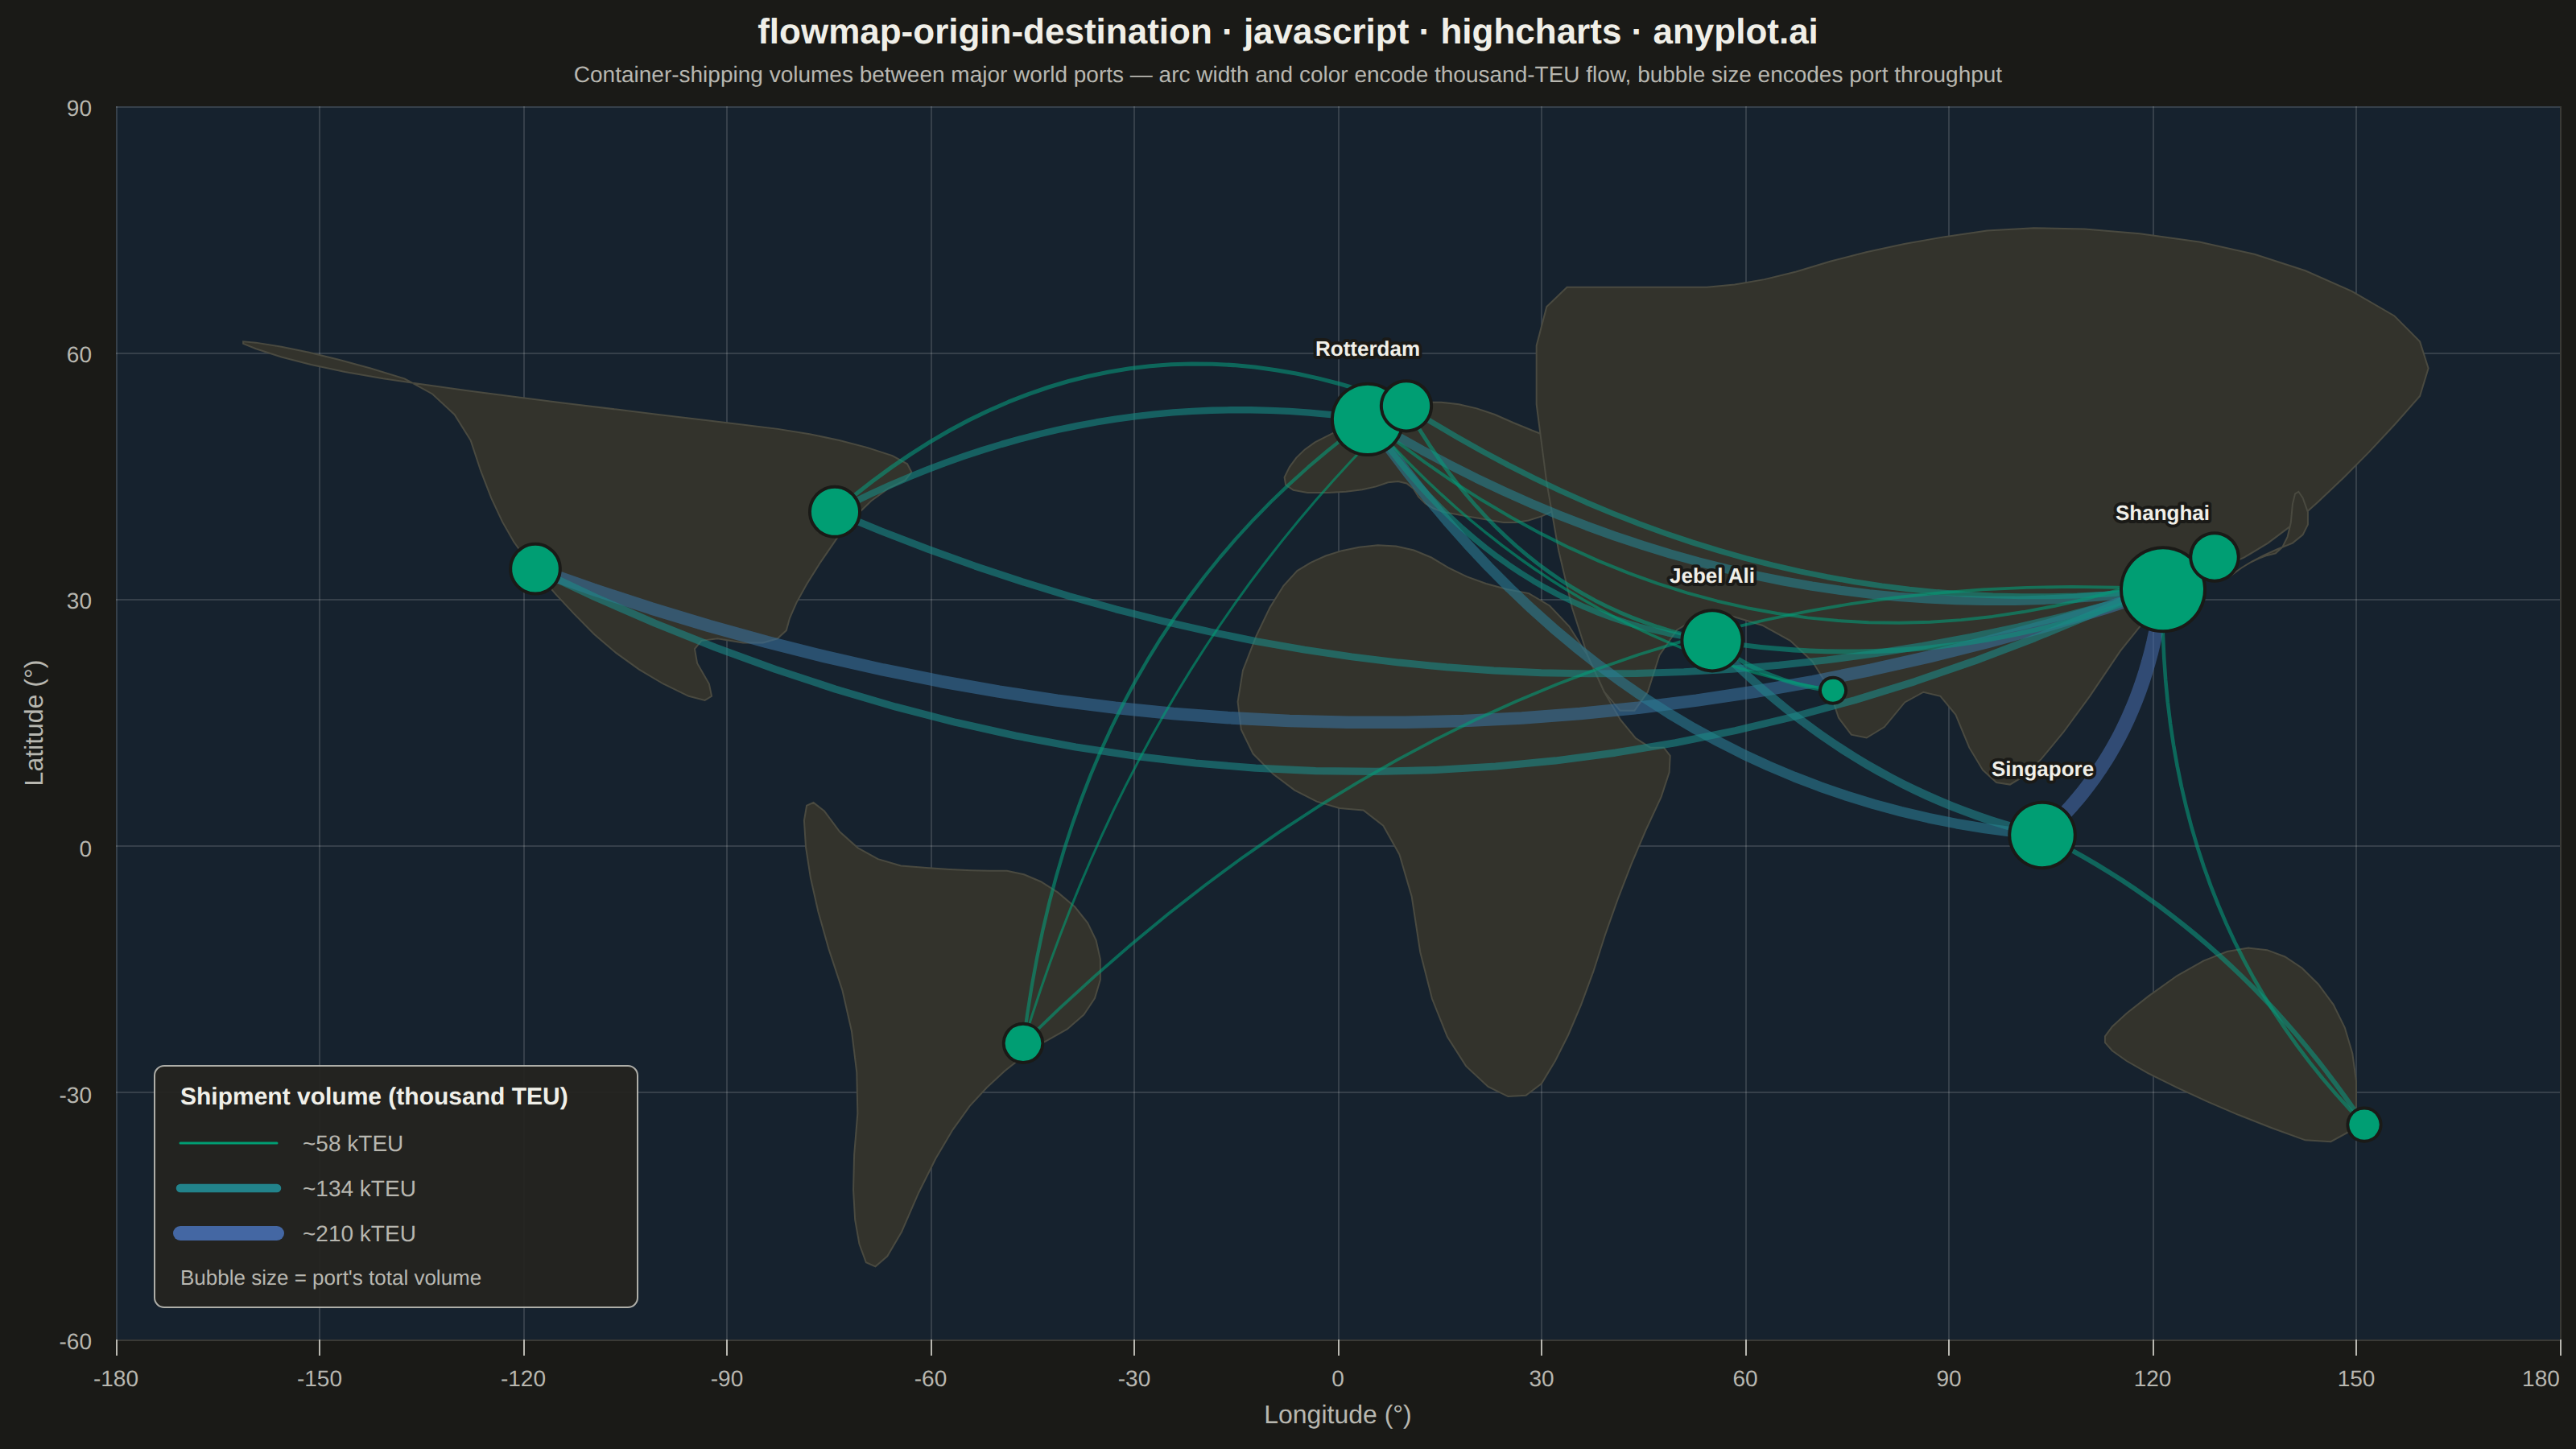
An origin-destination flow map visualizes movement or transfer between geographic locations using curved arcs overlaid on a map. Each arc connects an origin point to a destination point, with line thickness proportional to the flow magnitude. This visualization excels at revealing spatial patterns in migration, trade, or travel data, making it easy to identify major corridors, hub locations, and directional imbalances in movement between places.
// anyplot.ai
// flowmap-origin-destination: Origin-Destination Flow Map
// Library: highcharts 12.6.0 | JavaScript 22.23.2
// Quality: 93/100 | Created: 2026-09-02

const t = window.ANYPLOT_TOKENS;
const THEME = window.ANYPLOT_THEME;

// --- Basemap chrome (not data — Imprint palette only governs data colors) --
const LAND = THEME === "light" ? "#E4E0D2" : "#33332C";
const LAND_EDGE = THEME === "light" ? "#A79F8A" : "#4A4A40";
const OCEAN = THEME === "light" ? "#CFE3EF" : "#16222E";

// --- Data: container-shipping volumes between major world ports, thousand --
// --- TEU/year (twenty-foot equivalent units) — synthetic but realistic -----
const PORTS = {
  Shanghai: { lat: 31.23, lon: 121.47 },
  Singapore: { lat: 1.35, lon: 103.82 },
  Rotterdam: { lat: 51.92, lon: 4.48 },
  "Los Angeles": { lat: 33.73, lon: -118.26 },
  "Jebel Ali": { lat: 25.01, lon: 55.06 },
  Busan: { lat: 35.18, lon: 129.08 },
  Hamburg: { lat: 53.55, lon: 9.99 },
  Santos: { lat: -23.96, lon: -46.33 },
  "Nhava Sheva": { lat: 18.95, lon: 72.95 },
  Sydney: { lat: -33.87, lon: 151.21 },
  "New York": { lat: 40.67, lon: -74.14 },
};

const FLOWS = [
  { origin: "Shanghai", dest: "Los Angeles", teu: 185 },
  { origin: "Shanghai", dest: "Rotterdam", teu: 142 },
  { origin: "Shanghai", dest: "Hamburg", teu: 98 },
  { origin: "Shanghai", dest: "Singapore", teu: 210 },
  { origin: "Shanghai", dest: "New York", teu: 118 },
  { origin: "Shanghai", dest: "Jebel Ali", teu: 89 },
  { origin: "Singapore", dest: "Rotterdam", teu: 156 },
  { origin: "Singapore", dest: "Jebel Ali", teu: 133 },
  { origin: "Singapore", dest: "Sydney", teu: 88 },
  { origin: "Busan", dest: "Los Angeles", teu: 120 },
  { origin: "Busan", dest: "Shanghai", teu: 95 },
  { origin: "Busan", dest: "Rotterdam", teu: 68 },
  { origin: "Jebel Ali", dest: "Rotterdam", teu: 101 },
  { origin: "Jebel Ali", dest: "Hamburg", teu: 76 },
  { origin: "Nhava Sheva", dest: "Jebel Ali", teu: 84 },
  { origin: "Nhava Sheva", dest: "Rotterdam", teu: 63 },
  { origin: "Santos", dest: "Rotterdam", teu: 71 },
  { origin: "Santos", dest: "Hamburg", teu: 58 },
  { origin: "Santos", dest: "Shanghai", teu: 66 },
  { origin: "New York", dest: "Rotterdam", teu: 112 },
  { origin: "New York", dest: "Hamburg", teu: 79 },
  { origin: "Sydney", dest: "Shanghai", teu: 74 },
];

const teuValues = FLOWS.map((flow) => flow.teu);
const teuMin = Math.min(...teuValues);
const teuMax = Math.max(...teuValues);

// --- Simplified world coastlines (equirectangular lon/lat vertices), used --
// --- only as geographic context — not the data being visualized -----------
const CONTINENTS = [
  [
    [-165, 62],
    [-150, 60],
    [-130, 55],
    [-124, 40],
    [-117, 32],
    [-105, 22],
    [-90, 16],
    [-97, 26],
    [-82, 24],
    [-80, 30],
    [-70, 42],
    [-60, 46],
    [-75, 50],
    [-95, 52],
    [-125, 55],
    [-150, 58],
    [-165, 62],
  ],
  [
    [-79, 8],
    [-70, -2],
    [-55, -3],
    [-45, -3],
    [-35, -10],
    [-35, -20],
    [-48, -26],
    [-58, -35],
    [-68, -54],
    [-72, -45],
    [-70, -25],
    [-78, -5],
    [-79, 8],
  ],
  [
    [-9, 43],
    [3, 43],
    [10, 45],
    [13, 41],
    [20, 40],
    [27, 39],
    [35, 42],
    [41, 47],
    [30, 50],
    [19, 54],
    [9, 54],
    [1, 51],
    [-6, 48],
    [-9, 43],
  ],
  [
    [-17, 15],
    [-9, 32],
    [-1, 36],
    [10, 37],
    [20, 32],
    [33, 30],
    [43, 12],
    [51, 12],
    [42, -4],
    [35, -22],
    [27, -33],
    [14, -23],
    [9, 4],
    [-5, 5],
    [-17, 15],
  ],
  [
    [27, 68],
    [45, 68],
    [60, 68],
    [80, 73],
    [105, 76],
    [140, 72],
    [165, 60],
    [150, 46],
    [135, 35],
    [122, 32],
    [104, 10],
    [96, 6],
    [88, 22],
    [76, 10],
    [70, 25],
    [50, 30],
    [43, 12],
    [33, 30],
    [27, 68],
  ],
  [
    [130, 32],
    [135, 35],
    [140, 36],
    [141, 45],
    [144, 38],
    [135, 35],
    [130, 32],
  ],
  [
    [113, -22],
    [130, -12],
    [141, -13],
    [150, -23],
    [150, -38],
    [130, -32],
    [113, -25],
    [113, -22],
  ],
];

function smoothPolygon(points, iterations) {
  let pts = points;
  for (let iter = 0; iter < iterations; iter++) {
    const refined = [];
    for (let i = 0; i < pts.length - 1; i++) {
      const [x0, y0] = pts[i];
      const [x1, y1] = pts[i + 1];
      refined.push([x0 + 0.25 * (x1 - x0), y0 + 0.25 * (y1 - y0)]);
      refined.push([x0 + 0.75 * (x1 - x0), y0 + 0.75 * (y1 - y0)]);
    }
    refined.push(refined[0]);
    pts = refined;
  }
  return pts;
}

function drawContinents(chart) {
  const xAxis = chart.xAxis[0];
  const yAxis = chart.yAxis[0];
  CONTINENTS.forEach((polygon) => {
    const smoothed = smoothPolygon(polygon, 2);
    const path = smoothed.map((point, i) => [
      i === 0 ? "M" : "L",
      xAxis.toPixels(point[0], false),
      yAxis.toPixels(point[1], false),
    ]);
    path.push(["Z"]);
    chart.renderer
      .path(path)
      .attr({ fill: LAND, stroke: LAND_EDGE, "stroke-width": 1, zIndex: 1 })
      .add();
  });
}

// --- Great-arc approximation: quadratic Bezier bowed toward the north, ------
// --- sampled into a polyline so it renders as a native, hoverable series ---
const CURVATURE_MIN = 0.1;
const CURVATURE_MAX = 0.26;

function hashStr(str) {
  let h = 0;
  for (let i = 0; i < str.length; i++) {
    h = (h * 31 + str.charCodeAt(i)) >>> 0;
  }
  return h;
}

// Deterministic per-pair jitter keeps the curvature within a fixed band so
// every arc still bows toward the same rotational sense, but arcs sharing a
// hub endpoint fan apart instead of stacking on top of one another.
function curvatureFor(origin, dest) {
  const frac = (hashStr(`${origin}->${dest}`) % 1000) / 1000;
  return CURVATURE_MIN + frac * (CURVATURE_MAX - CURVATURE_MIN);
}

function arcPoints(lon1, lat1, lon2, lat2, steps, curvature) {
  const mx = (lon1 + lon2) / 2;
  const my = (lat1 + lat2) / 2;
  const dx = lon2 - lon1;
  const dy = lat2 - lat1;
  const dist = Math.sqrt(dx * dx + dy * dy) || 1;
  // Perpendicular offset (always the same rotational sense) bows every arc
  // consistently, which is what makes a flow map read as a coherent set.
  const nx = -dy / dist;
  const ny = dx / dist;
  const cx = mx + nx * dist * curvature;
  const cy = my + ny * dist * curvature;
  const points = [];
  for (let i = 0; i <= steps; i++) {
    const tt = i / steps;
    const u = 1 - tt;
    points.push({
      x: u * u * lon1 + 2 * u * tt * cx + tt * tt * lon2,
      y: u * u * lat1 + 2 * u * tt * cy + tt * tt * lat2,
    });
  }
  return points;
}

function lerpColor(hexA, hexB, frac) {
  const a = [1, 3, 5].map((i) => parseInt(hexA.slice(i, i + 2), 16));
  const b = [1, 3, 5].map((i) => parseInt(hexB.slice(i, i + 2), 16));
  const [r, g, bl] = a.map((c, i) => Math.round(c + (b[i] - c) * frac));
  return `${r}, ${g}, ${bl}`;
}

const MIN_WIDTH = 1.5;
const MAX_WIDTH = 9;

const flowSeries = FLOWS.map((flow) => {
  const origin = PORTS[flow.origin];
  const dest = PORTS[flow.dest];
  const norm = (flow.teu - teuMin) / (teuMax - teuMin);
  const rgb = lerpColor(t.seq[0], t.seq[1], norm);
  const curvature = curvatureFor(flow.origin, flow.dest);
  return {
    type: "line",
    name: `${flow.origin} → ${flow.dest}`,
    data: arcPoints(origin.lon, origin.lat, dest.lon, dest.lat, 28, curvature),
    color: `rgba(${rgb}, 0.6)`,
    lineWidth: MIN_WIDTH + (MAX_WIDTH - MIN_WIDTH) * norm,
    marker: { enabled: false },
    enableMouseTracking: true,
    showInLegend: false,
    zIndex: 3,
    flowMeta: { origin: flow.origin, dest: flow.dest, teu: flow.teu },
  };
});

// --- Port markers: bubble radius scaled by total handled volume (origin + --
// --- destination combined) — reveals which ports are the major hubs -------
const portTotals = {};
Object.keys(PORTS).forEach((name) => {
  portTotals[name] = FLOWS.filter(
    (flow) => flow.origin === name || flow.dest === name,
  ).reduce((sum, flow) => sum + flow.teu, 0);
});
const totalMin = Math.min(...Object.values(portTotals));
const totalMax = Math.max(...Object.values(portTotals));
const MIN_R = 8;
const MAX_R = 26;

// Direct-label the busiest hubs so the major corridors read without hovering.
const HUB_NAMES = Object.entries(portTotals)
  .sort((a, b) => b[1] - a[1])
  .slice(0, 4)
  .map(([name]) => name);

const portSeries = {
  type: "scatter",
  name: "Port",
  data: Object.entries(PORTS).map(([name, coord]) => {
    const norm = (portTotals[name] - totalMin) / (totalMax - totalMin);
    const radius = MIN_R + (MAX_R - MIN_R) * Math.sqrt(norm);
    return {
      x: coord.lon,
      y: coord.lat,
      name,
      total: portTotals[name],
      marker: {
        symbol: "circle",
        radius,
        fillColor: t.palette[0],
        lineColor: t.pageBg,
        lineWidth: 2,
      },
      dataLabels: HUB_NAMES.includes(name)
        ? {
            enabled: true,
            format: name,
            allowOverlap: true,
            y: -(radius + 10),
            style: {
              color: t.ink,
              fontSize: "13px",
              fontWeight: "600",
              textOutline: `2px ${t.pageBg}`,
            },
          }
        : undefined,
    };
  }),
  color: t.palette[0],
  showInLegend: false,
  zIndex: 5,
};

// --- Manual legend: core Highcharts has no gradient/width legend widget ----
function drawLegend(chart) {
  const boxW = 300;
  const boxH = 150;
  const boxX = chart.plotLeft + 24;
  const boxY = chart.plotTop + chart.plotHeight - boxH - 20;

  chart.renderer
    .rect(boxX, boxY, boxW, boxH, 6)
    .attr({
      fill: t.elevatedBg,
      stroke: t.inkSoft,
      "stroke-width": 1,
      zIndex: 6,
      opacity: 0.94,
    })
    .add();

  chart.renderer
    .text("Shipment volume (thousand TEU)", boxX + 16, boxY + 24)
    .attr({ zIndex: 7 })
    .css({ color: t.ink, fontSize: "15px", fontWeight: "600" })
    .add();

  const sampleTeu = [teuMin, Math.round((teuMin + teuMax) / 2), teuMax];
  let cursorY = boxY + 48;
  sampleTeu.forEach((teu) => {
    const norm = (teu - teuMin) / (teuMax - teuMin);
    const rgb = lerpColor(t.seq[0], t.seq[1], norm);
    const width = MIN_WIDTH + (MAX_WIDTH - MIN_WIDTH) * norm;
    chart.renderer
      .path([
        ["M", boxX + 16, cursorY],
        ["L", boxX + 76, cursorY],
      ])
      .attr({
        stroke: `rgb(${rgb})`,
        "stroke-width": width,
        "stroke-linecap": "round",
        zIndex: 7,
      })
      .add();
    chart.renderer
      .text(`~${teu} kTEU`, boxX + 92, cursorY + 5)
      .attr({ zIndex: 7 })
      .css({ color: t.inkSoft, fontSize: "14px" })
      .add();
    cursorY += 28;
  });

  chart.renderer
    .text("Bubble size = port's total volume", boxX + 16, boxY + boxH - 14)
    .attr({ zIndex: 7 })
    .css({ color: t.inkSoft, fontSize: "13px" })
    .add();
}

// --- Chart -------------------------------------------------------------------
Highcharts.chart("container", {
  chart: {
    type: "line",
    backgroundColor: "transparent",
    plotBackgroundColor: OCEAN,
    animation: false,
    style: { fontFamily: "inherit" },
    events: {
      load: function () {
        drawContinents(this);
        drawLegend(this);
      },
    },
  },
  credits: { enabled: false },
  title: {
    text: "flowmap-origin-destination · javascript · highcharts · anyplot.ai",
    style: { color: t.ink, fontSize: "22px", fontWeight: "600" },
  },
  subtitle: {
    text: "Container-shipping volumes between major world ports — arc width and color encode thousand-TEU flow, bubble size encodes port throughput",
    style: { color: t.inkSoft, fontSize: "14px" },
  },
  xAxis: {
    min: -180,
    max: 180,
    tickInterval: 30,
    title: {
      text: "Longitude (°)",
      style: { color: t.inkSoft, fontSize: "16px" },
    },
    lineWidth: 0,
    tickColor: t.inkSoft,
    gridLineWidth: 1,
    gridLineColor: t.grid,
    labels: { style: { color: t.inkSoft, fontSize: "14px" } },
  },
  yAxis: {
    min: -55,
    max: 75,
    tickInterval: 30,
    title: {
      text: "Latitude (°)",
      style: { color: t.inkSoft, fontSize: "16px" },
    },
    lineWidth: 0,
    tickColor: t.inkSoft,
    gridLineWidth: 1,
    gridLineColor: t.grid,
    labels: { style: { color: t.inkSoft, fontSize: "14px" } },
  },
  legend: { enabled: false },
  tooltip: {
    headerFormat: "",
    formatter: function () {
      const meta = this.series.options.flowMeta;
      if (meta) {
        return `<b>${meta.origin} → ${meta.dest}</b><br/>${meta.teu.toLocaleString()} thousand TEU/year`;
      }
      return `<b>${this.point.name}</b><br/>Total volume: ${this.point.total.toLocaleString()} thousand TEU/year`;
    },
  },
  plotOptions: {
    series: {
      animation: false,
      states: { hover: { enabled: false } },
    },
  },
  series: [...flowSeries, portSeries],
});
Runnable source as JSON, for any HTTP client: https://api.anyplot.ai/specs/flowmap-origin-destination/highcharts/code. Any spec id and library id listed in llms-full.txt fit the same URL shape; every URL below is complete and callable.
{
  "spec_id": "flowmap-origin-destination",
  "language": "javascript",
  "library": "highcharts",
  "page": "https://anyplot.ai/flowmap-origin-destination/javascript/highcharts",
  "hub": "https://anyplot.ai/flowmap-origin-destination",
  "code_json": "https://api.anyplot.ai/specs/flowmap-origin-destination/highcharts/code",
  "spec_json": "https://api.anyplot.ai/specs/flowmap-origin-destination",
  "render_light_png": "https://storage.googleapis.com/anyplot-images/plots/flowmap-origin-destination/javascript/highcharts/plot-light.png",
  "render_dark_png": "https://storage.googleapis.com/anyplot-images/plots/flowmap-origin-destination/javascript/highcharts/plot-dark.png",
  "interactive_light_html": "https://storage.googleapis.com/anyplot-images/plots/flowmap-origin-destination/javascript/highcharts/plot-light.html",
  "interactive_dark_html": "https://storage.googleapis.com/anyplot-images/plots/flowmap-origin-destination/javascript/highcharts/plot-dark.html",
  "quality_score": 93.0,
  "license": "MIT",
  "guide": "https://anyplot.ai/llms.txt"
}
Part of Origin-Destination Flow Map on anyplot.ai.