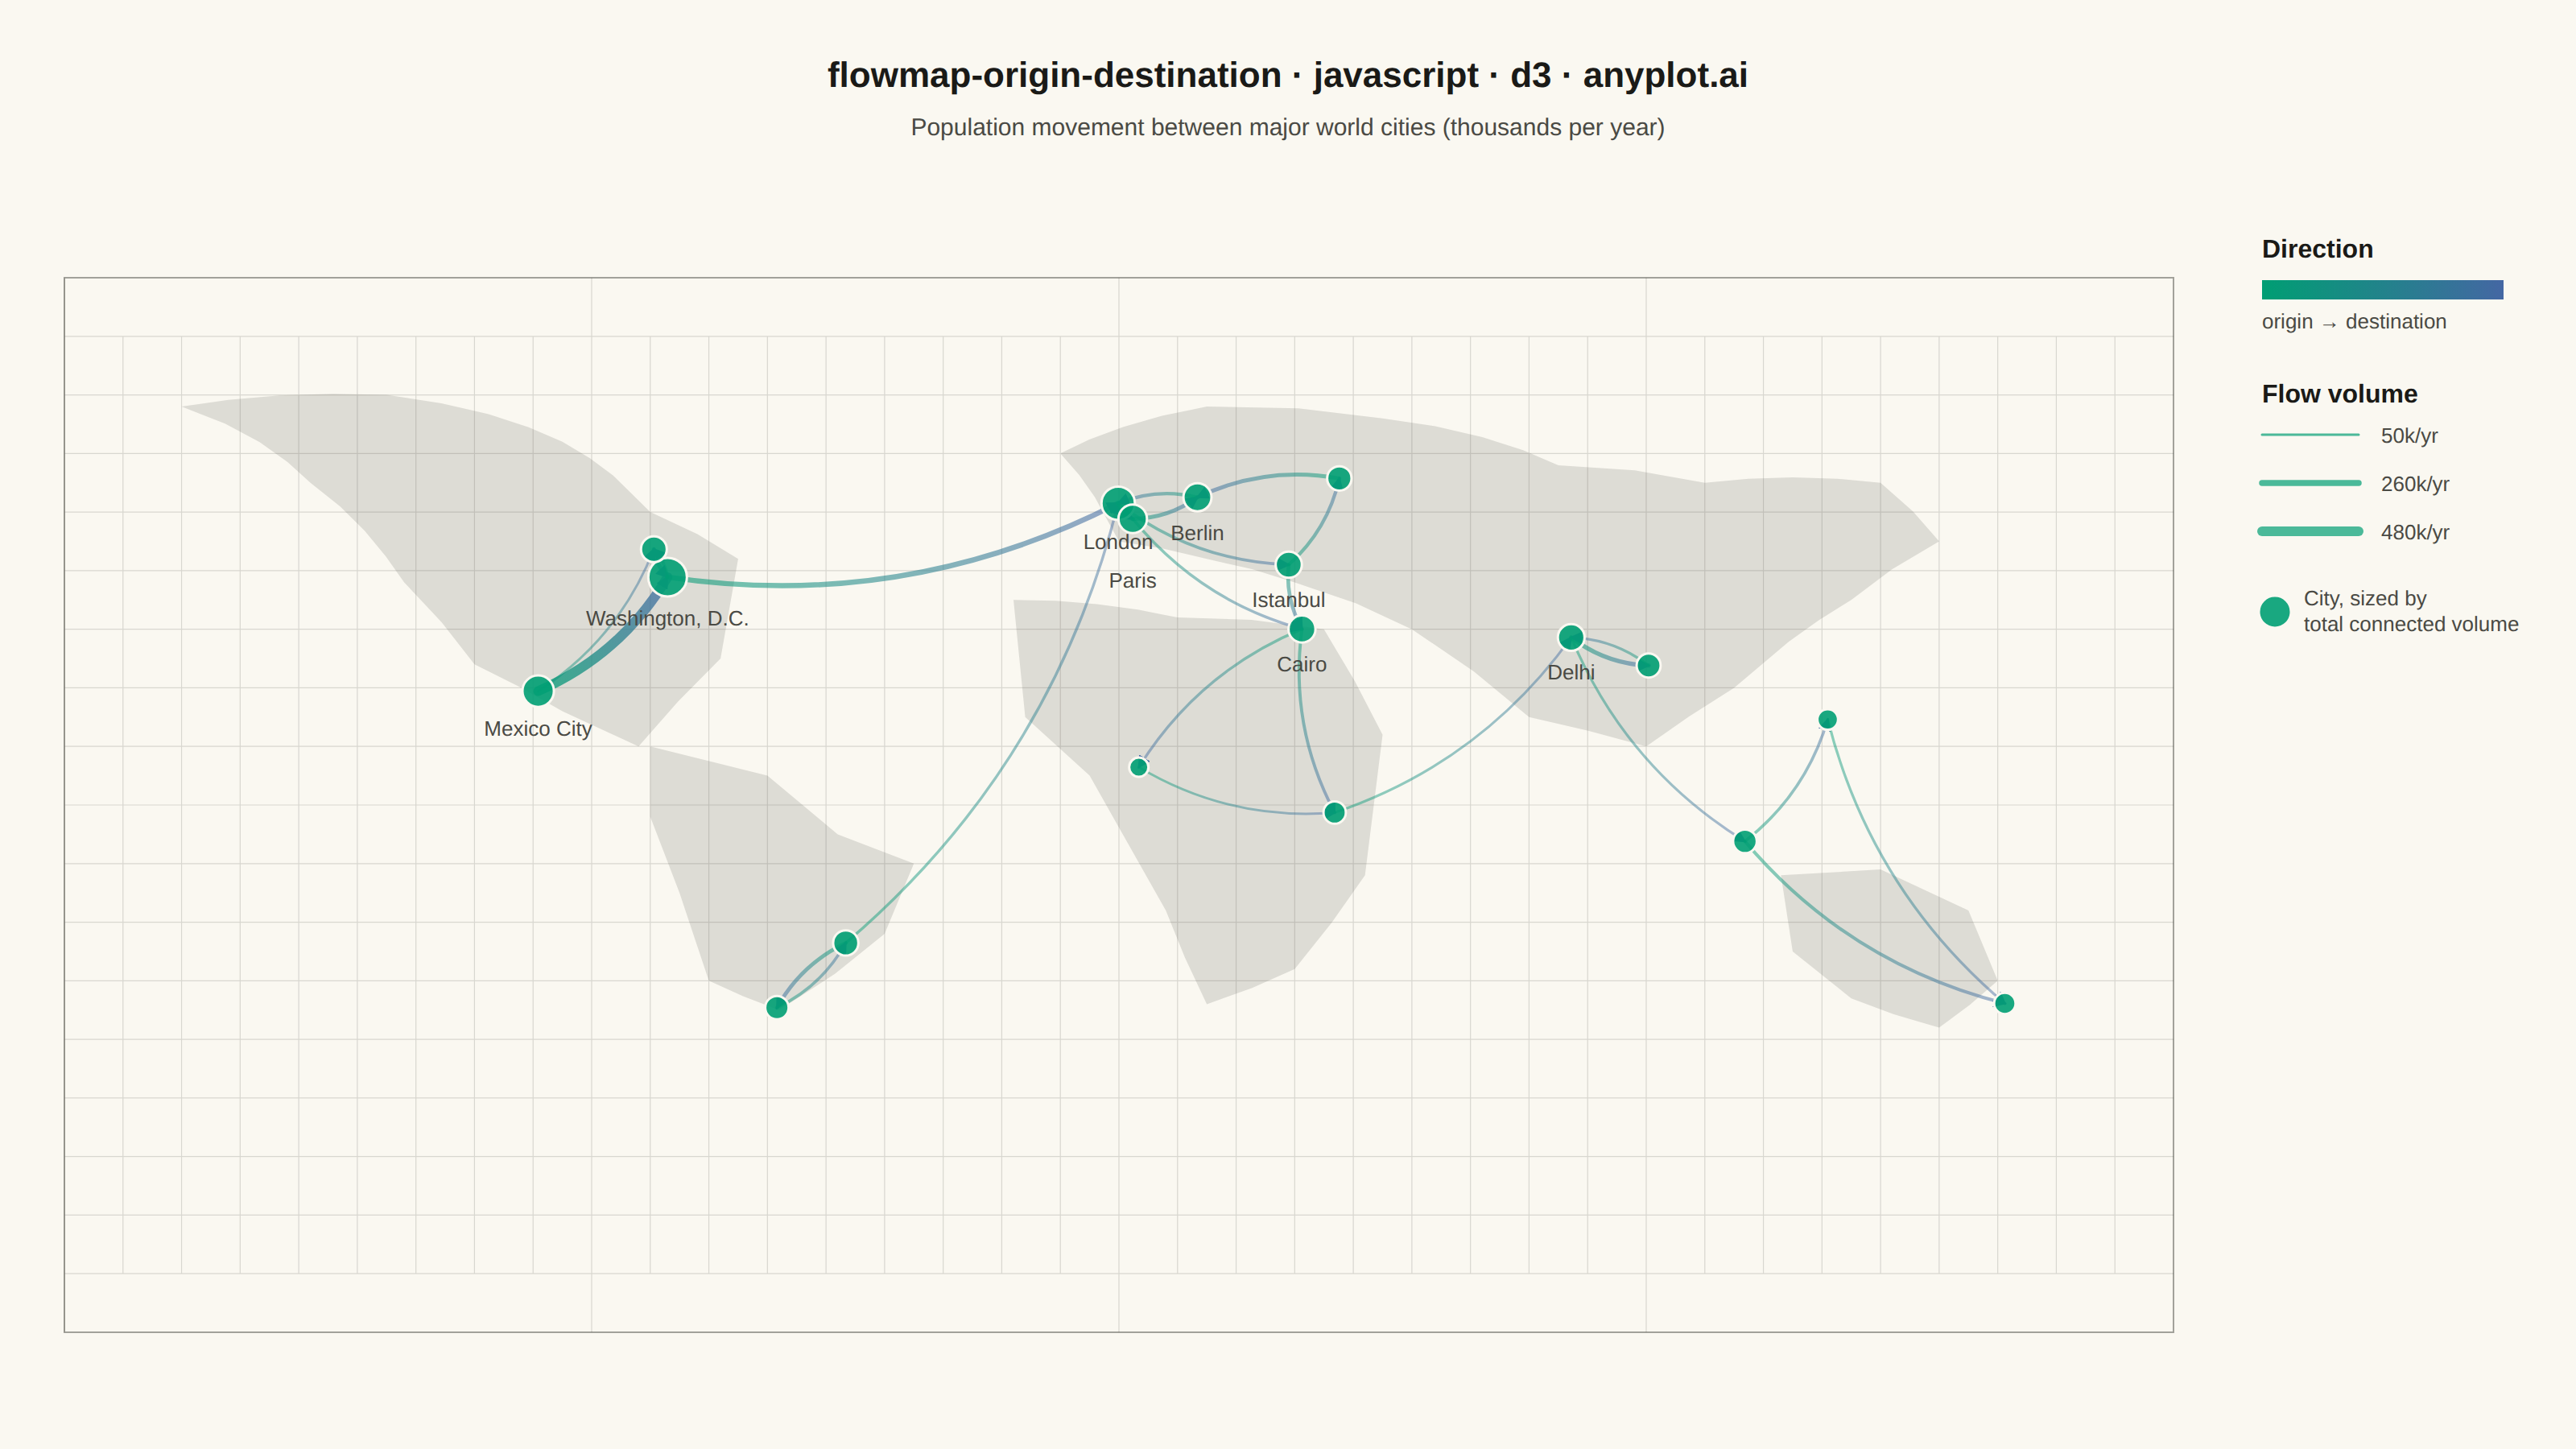
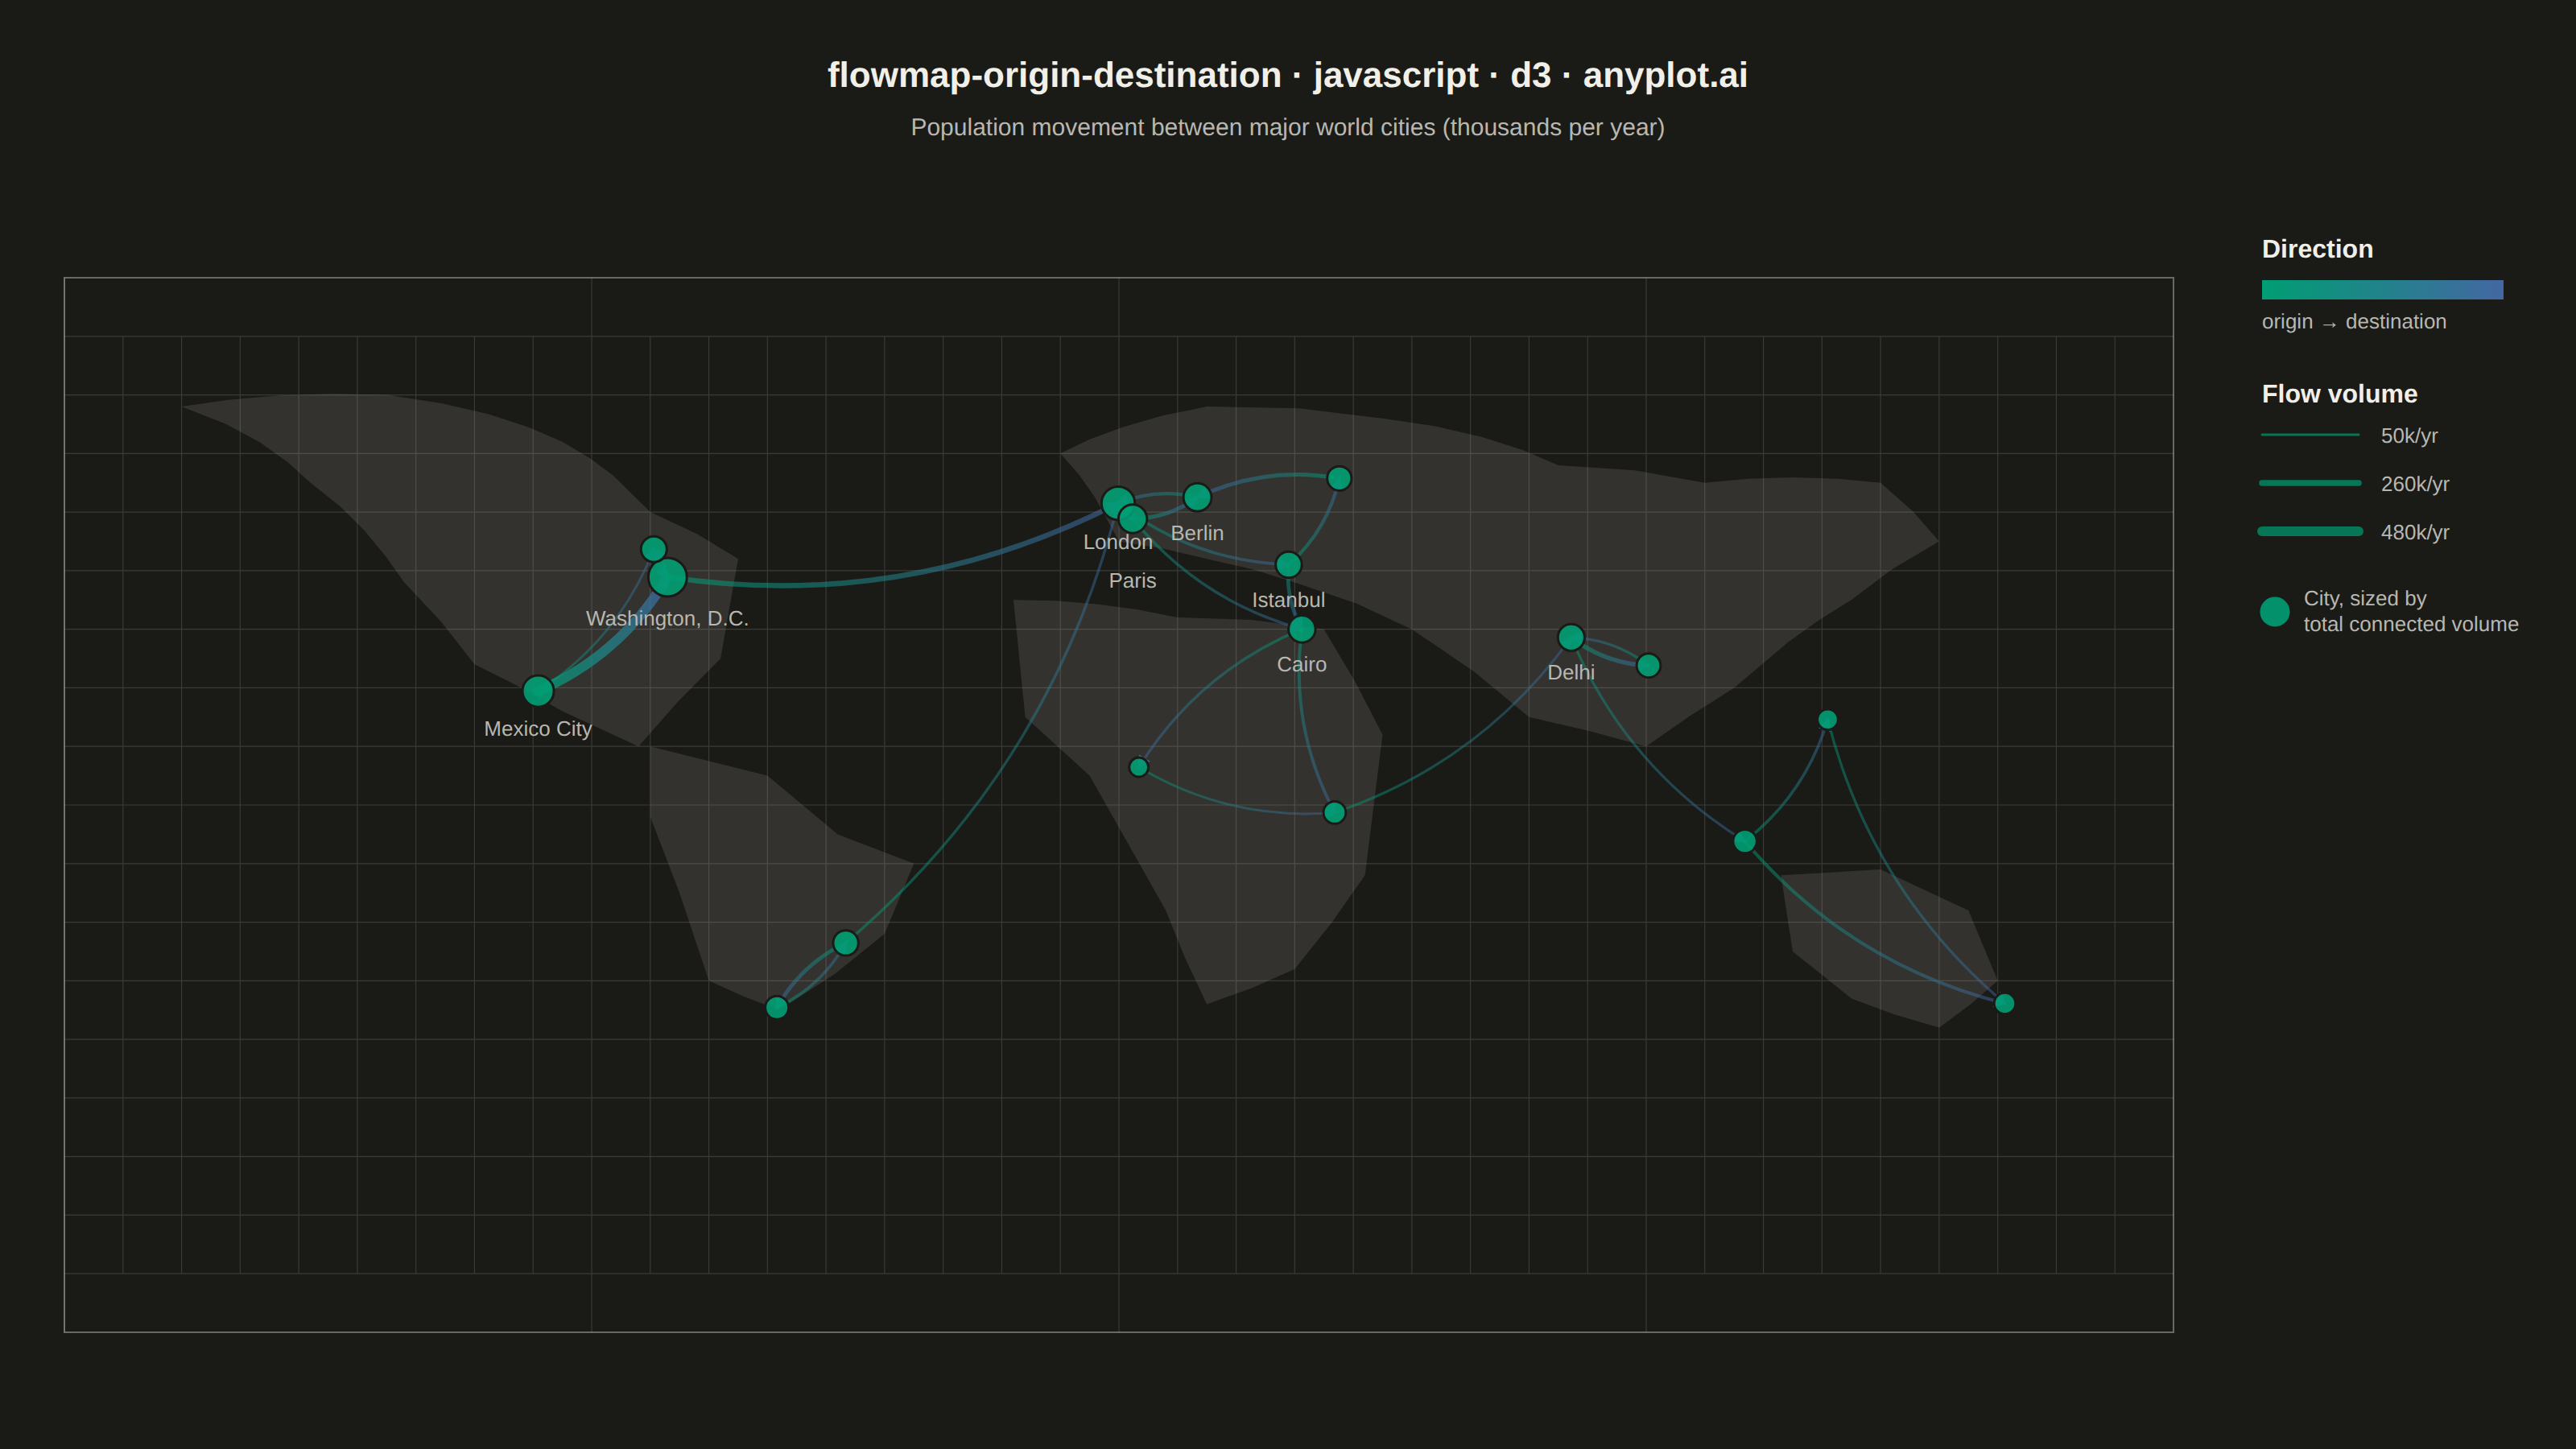
The same plot in 14 other libraries — JavaScript: Chart.js, Apache ECharts, Highcharts, MUI X Charts; Python: Altair, Bokeh, lets-plot, Matplotlib, Plotly, plotnine, Pygal, Seaborn; R: ggplot2; Julia: Makie.jl. Compare all 15 side by side: Origin-Destination Flow Map in Python, R, Julia and JavaScript.
An origin-destination flow map visualizes movement or transfer between geographic locations using curved arcs overlaid on a map. Each arc connects an origin point to a destination point, with line thickness proportional to the flow magnitude. This visualization excels at revealing spatial patterns in migration, trade, or travel data, making it easy to identify major corridors, hub locations, and directional imbalances in movement between places.
// anyplot.ai
// flowmap-origin-destination: Origin-Destination Flow Map
// Library: d3 7.9.0 | JavaScript 22.23.2
// Quality: 87/100 | Created: 2026-09-02

const t = window.ANYPLOT_TOKENS;
const { width, height } = window.ANYPLOT_SIZE;

// --- Data: illustrative population-movement volumes between world cities --
// (thousands of people/year, synthetic but realistically proportioned)
const cities = [
  { id: "MEX", name: "Mexico City", lon: -99.13, lat: 19.43 },
  { id: "WAS", name: "Washington, D.C.", lon: -77.04, lat: 38.9 },
  { id: "TOR", name: "Toronto", lon: -79.38, lat: 43.65 },
  { id: "SAO", name: "São Paulo", lon: -46.63, lat: -23.55 },
  { id: "BUE", name: "Buenos Aires", lon: -58.38, lat: -34.6 },
  { id: "LON", name: "London", lon: -0.13, lat: 51.5 },
  { id: "PAR", name: "Paris", lon: 2.35, lat: 48.85 },
  { id: "BER", name: "Berlin", lon: 13.4, lat: 52.52 },
  { id: "IST", name: "Istanbul", lon: 28.98, lat: 41.01 },
  { id: "CAI", name: "Cairo", lon: 31.24, lat: 30.04 },
  { id: "LAG", name: "Lagos", lon: 3.39, lat: 6.45 },
  { id: "NAI", name: "Nairobi", lon: 36.82, lat: -1.29 },
  { id: "MOW", name: "Moscow", lon: 37.62, lat: 55.75 },
  { id: "DEL", name: "Delhi", lon: 77.2, lat: 28.6 },
  { id: "DAC", name: "Dhaka", lon: 90.41, lat: 23.81 },
  { id: "JAK", name: "Jakarta", lon: 106.85, lat: -6.2 },
  { id: "MNL", name: "Manila", lon: 120.98, lat: 14.6 },
  { id: "SYD", name: "Sydney", lon: 151.21, lat: -33.87 },
];
const cityById = new Map(cities.map((c) => [c.id, c]));

const flows = [
  { from: "MEX", to: "WAS", flow: 480 },
  { from: "TOR", to: "WAS", flow: 150 },
  { from: "WAS", to: "TOR", flow: 90 },
  { from: "MEX", to: "TOR", flow: 40 },
  { from: "SAO", to: "BUE", flow: 130 },
  { from: "BUE", to: "SAO", flow: 70 },
  { from: "SAO", to: "LON", flow: 60 },
  { from: "WAS", to: "LON", flow: 210 },
  { from: "LON", to: "PAR", flow: 180 },
  { from: "PAR", to: "BER", flow: 140 },
  { from: "BER", to: "LON", flow: 95 },
  { from: "LON", to: "IST", flow: 75 },
  { from: "PAR", to: "CAI", flow: 65 },
  { from: "IST", to: "CAI", flow: 120 },
  { from: "CAI", to: "LAG", flow: 55 },
  { from: "LAG", to: "NAI", flow: 40 },
  { from: "CAI", to: "NAI", flow: 85 },
  { from: "NAI", to: "DEL", flow: 45 },
  { from: "IST", to: "MOW", flow: 100 },
  { from: "MOW", to: "BER", flow: 130 },
  { from: "DEL", to: "DAC", flow: 160 },
  { from: "DAC", to: "DEL", flow: 60 },
  { from: "DEL", to: "JAK", flow: 50 },
  { from: "JAK", to: "MNL", flow: 70 },
  { from: "MNL", to: "SYD", flow: 55 },
  { from: "JAK", to: "SYD", flow: 90 },
];

const nodeTotals = new Map();
for (const f of flows) {
  nodeTotals.set(f.from, (nodeTotals.get(f.from) || 0) + f.flow);
  nodeTotals.set(f.to, (nodeTotals.get(f.to) || 0) + f.flow);
}

// --- Layout ------------------------------------------------------------
const margin = { top: 140, right: 250, bottom: 40, left: 40 };
const mapW = width - margin.left - margin.right;
const mapH = height - margin.top - margin.bottom;

// --- Projection: flat equirectangular grid, fit to the map area ------------
const projection = d3.geoEquirectangular().fitExtent(
  [
    [0, 0],
    [mapW, mapH],
  ],
  { type: "Sphere" },
);
const geoPath = d3.geoPath(projection);
const graticule = d3.geoGraticule10();

// --- Scales --------------------------------------------------------------
const flowExtent = d3.extent(flows, (d) => d.flow);
const arcWidth = d3.scaleLinear().domain(flowExtent).range([1.5, 6]);
const arcOpacity = d3.scaleLinear().domain(flowExtent).range([0.45, 0.75]);
const nodeRadius = d3
  .scaleSqrt()
  .domain(d3.extent(Array.from(nodeTotals.values())))
  .range([6, 12]);

// --- SVG mount -----------------------------------------------------------
const svg = d3.select("#container").append("svg").attr("width", width).attr("height", height);
const g = svg.append("g").attr("transform", `translate(${margin.left},${margin.top})`);
const mapG = g.append("g");

// Sphere outline — the map's bounding frame under the equirectangular grid
mapG
  .append("path")
  .datum({ type: "Sphere" })
  .attr("d", geoPath)
  .attr("fill", t.pageBg)
  .attr("stroke", t.inkSoft)
  .attr("stroke-width", 1)
  .attr("stroke-opacity", 0.5);

// Graticule — subtle 20-degree lon/lat grid for geographic context
mapG
  .append("path")
  .datum(graticule)
  .attr("d", geoPath)
  .attr("fill", "none")
  .attr("stroke", t.grid)
  .attr("stroke-width", 0.6);

// Simplified landmass silhouettes — coarse, non-political shapes that give the
// grid geographic context without claiming coastline accuracy. Each ring is
// authored as [lon, lat] control points in the winding order d3-geo's
// spherical clipping expects for a small enclosed patch (verified against the
// projected bounds — the wrong winding would fill the whole sphere instead).
function landmass(points) {
  const ring = points.slice();
  ring.push(ring[0]);
  return { type: "Polygon", coordinates: [ring] };
}

const landmasses = [
  landmass([
    [-160, 68], [-125, 70], [-95, 62], [-80, 50], [-65, 42], [-68, 25],
    [-82, 10], [-95, 16], [-110, 24], [-122, 38], [-138, 55],
  ]),
  landmass([
    [-80, 10], [-60, 5], [-48, -5], [-35, -10], [-40, -22], [-58, -35],
    [-70, -30], [-75, -15], [-80, -2],
  ]),
  landmass([
    [-18, 35], [10, 32], [35, 30], [45, 12], [42, -12], [30, -28],
    [15, -34], [8, -18], [-5, 5], [-16, 15],
  ]),
  landmass([
    [-10, 60], [15, 68], [45, 66], [75, 58], [100, 55], [130, 55],
    [140, 45], [125, 35], [105, 20], [90, 10], [70, 15], [50, 30],
    [30, 38], [15, 42], [0, 45],
  ]),
  landmass([
    [113, -12], [130, -11], [145, -18], [150, -30], [140, -38], [125, -33],
    [115, -25],
  ]),
];

mapG
  .selectAll("path.landmass")
  .data(landmasses)
  .join("path")
  .attr("class", "landmass")
  .attr("d", geoPath)
  .attr("fill", t.inkSoft)
  .attr("fill-opacity", 0.16)
  .attr("stroke", "none");

// Direction gradient + arrowhead — every arc fades brand green (origin) into
// blue (destination), so color alone encodes flow direction independent of
// magnitude (width/opacity encode magnitude instead).
const defs = svg.append("defs");
// markerUnits="userSpaceOnUse" pins the arrowhead to a small fixed pixel size
// (8x8) independent of each arc's stroke-width, so high-flow arcs no longer
// balloon a wedge over the destination city circle.
defs
  .append("marker")
  .attr("id", "flow-arrow")
  .attr("viewBox", "0 0 10 10")
  .attr("refX", 8.5)
  .attr("refY", 5)
  .attr("markerUnits", "userSpaceOnUse")
  .attr("markerWidth", 8)
  .attr("markerHeight", 8)
  .attr("orient", "auto")
  .append("path")
  .attr("d", "M0,0 L10,5 L0,10 Z")
  .attr("fill", t.palette[2]);

// --- Curved origin-destination arcs (quadratic Bezier, not great-circle) ---
// Each arc bows toward the same side (perpendicular offset proportional to
// distance) — the classic flow-map look, distinct from a geodesic path.
function arcPath(x0, y0, x1, y1) {
  const dx = x1 - x0;
  const dy = y1 - y0;
  const dist = Math.hypot(dx, dy) || 1;
  const bow = dist * 0.16;
  const mx = (x0 + x1) / 2 - (dy / dist) * bow;
  const my = (y0 + y1) / 2 + (dx / dist) * bow;
  return `M${x0},${y0} Q${mx},${my} ${x1},${y1}`;
}

const arcLayer = mapG.append("g");
flows.forEach((d, i) => {
  const o = cityById.get(d.from);
  const e = cityById.get(d.to);
  const [x0, y0] = projection([o.lon, o.lat]);
  const [x1, y1] = projection([e.lon, e.lat]);

  defs
    .append("linearGradient")
    .attr("id", `flow-grad-${i}`)
    .attr("gradientUnits", "userSpaceOnUse")
    .attr("x1", x0).attr("y1", y0).attr("x2", x1).attr("y2", y1)
    .selectAll("stop")
    .data([
      { offset: "0%", color: t.palette[0] },
      { offset: "100%", color: t.palette[2] },
    ])
    .join("stop")
    .attr("offset", (s) => s.offset)
    .attr("stop-color", (s) => s.color);

  arcLayer
    .append("path")
    .datum(d)
    .attr("d", arcPath(x0, y0, x1, y1))
    .attr("fill", "none")
    .attr("stroke", `url(#flow-grad-${i})`)
    .attr("stroke-width", arcWidth(d.flow))
    .attr("stroke-opacity", arcOpacity(d.flow))
    .attr("stroke-linecap", "round")
    .attr("marker-end", "url(#flow-arrow)");
});

// Tooltip — real hover, only live in the exported interactive HTML
const tooltip = d3
  .select("#container")
  .append("div")
  .style("position", "fixed")
  .style("pointer-events", "none")
  .style("opacity", 0)
  .style("background", t.elevatedBg)
  .style("color", t.ink)
  .style("border", `1px solid ${t.grid}`)
  .style("border-radius", "6px")
  .style("padding", "8px 10px")
  .style("font-size", "13px")
  .style("font-family", "sans-serif")
  .style("line-height", "1.5")
  .style("box-shadow", "0 2px 8px rgba(0,0,0,0.25)")
  .style("transition", "opacity 0.1s linear");

arcLayer
  .selectAll("path")
  .style("cursor", "pointer")
  .on("mouseenter", function (event, d) {
    d3.select(this).attr("stroke-opacity", 1);
    tooltip.style("opacity", 1);
  })
  .on("mousemove", function (event, d) {
    const o = cityById.get(d.from);
    const e = cityById.get(d.to);
    tooltip
      .style("left", `${event.clientX + 16}px`)
      .style("top", `${event.clientY + 16}px`)
      .html(`<strong>${o.name} → ${e.name}</strong><br>${d.flow}k people/yr`);
  })
  .on("mouseleave", function (event, d) {
    d3.select(this).attr("stroke-opacity", arcOpacity(d.flow));
    tooltip.style("opacity", 0);
  });

// City markers — sized by total connected volume (inbound + outbound)
const nodeLayer = mapG.append("g");
nodeLayer
  .selectAll("circle.city")
  .data(cities)
  .join("circle")
  .attr("class", "city")
  .attr("cx", (d) => projection([d.lon, d.lat])[0])
  .attr("cy", (d) => projection([d.lon, d.lat])[1])
  .attr("r", (d) => nodeRadius(nodeTotals.get(d.id) || 0))
  .attr("fill", t.palette[0])
  .attr("fill-opacity", 0.9)
  .attr("stroke", t.pageBg)
  .attr("stroke-width", 1.5)
  .style("cursor", "pointer")
  .on("mouseenter", function () {
    d3.select(this).attr("stroke", t.ink);
    tooltip.style("opacity", 1);
  })
  .on("mousemove", function (event, d) {
    tooltip
      .style("left", `${event.clientX + 16}px`)
      .style("top", `${event.clientY + 16}px`)
      .html(`<strong>${d.name}</strong><br>${nodeTotals.get(d.id)}k connected/yr`);
  })
  .on("mouseleave", function () {
    d3.select(this).attr("stroke", t.pageBg);
    tooltip.style("opacity", 0);
  });

// City labels — static, for the top movers only (keeps the map legible).
// Default placement is below the marker (least likely to cross an arc); a
// greedy nudge-down pass then resolves any remaining overlap against labels
// already placed, using real getBBox() measurements from the browser layout.
const topCities = cities
  .slice()
  .sort((a, b) => (nodeTotals.get(b.id) || 0) - (nodeTotals.get(a.id) || 0))
  .slice(0, 8);
const placedLabelBoxes = [];
const overlaps = (a, b) =>
  a.x < b.x + b.width && b.x < a.x + a.width && a.y < b.y + b.height && b.y < a.y + a.height;

nodeLayer
  .selectAll("text.city-label")
  .data(topCities)
  .join("text")
  .attr("class", "city-label")
  .attr("text-anchor", "middle")
  .attr("fill", t.inkSoft)
  .style("font-size", "13px")
  .text((d) => d.name)
  .each(function (d) {
    const [px, py] = projection([d.lon, d.lat]);
    const r = nodeRadius(nodeTotals.get(d.id) || 0);
    const sel = d3.select(this).attr("x", px).attr("y", py + r + 18);
    let box = this.getBBox();
    let attempts = 0;
    while (placedLabelBoxes.some((b) => overlaps(box, b)) && attempts < 6) {
      sel.attr("y", py + r + 18 + (attempts + 1) * 16);
      box = this.getBBox();
      attempts += 1;
    }
    placedLabelBoxes.push(box);
  });

// --- Legend: direction gradient + magnitude width -------------------------
const legendX = mapW + 55;
const legendG = g.append("g").attr("transform", `translate(${legendX},20)`);

legendG
  .append("text")
  .attr("fill", t.ink)
  .style("font-size", "16px")
  .style("font-weight", "600")
  .text("Direction");

legendG
  .append("defs")
  .append("linearGradient")
  .attr("id", "legend-direction")
  .attr("x1", "0%").attr("x2", "100%")
  .selectAll("stop")
  .data([
    { offset: "0%", color: t.palette[0] },
    { offset: "100%", color: t.palette[2] },
  ])
  .join("stop")
  .attr("offset", (s) => s.offset)
  .attr("stop-color", (s) => s.color);

legendG
  .append("rect")
  .attr("y", 14)
  .attr("width", 150)
  .attr("height", 12)
  .attr("fill", "url(#legend-direction)");
legendG
  .append("text")
  .attr("y", 44)
  .attr("fill", t.inkSoft)
  .style("font-size", "13px")
  .text("origin → destination");

legendG
  .append("text")
  .attr("y", 90)
  .attr("fill", t.ink)
  .style("font-size", "16px")
  .style("font-weight", "600")
  .text("Flow volume");

const widthLegend = [
  { label: "50k/yr", flow: flowExtent[0] },
  { label: "260k/yr", flow: (flowExtent[0] + flowExtent[1]) / 2 },
  { label: "480k/yr", flow: flowExtent[1] },
];
const wlG = legendG.append("g").attr("transform", "translate(0,110)");
widthLegend.forEach((d, i) => {
  const y = i * 30;
  wlG
    .append("line")
    .attr("x1", 0).attr("x2", 60).attr("y1", y).attr("y2", y)
    .attr("stroke", t.palette[0])
    .attr("stroke-opacity", 0.7)
    .attr("stroke-width", arcWidth(d.flow))
    .attr("stroke-linecap", "round");
  wlG
    .append("text")
    .attr("x", 74).attr("y", y + 5)
    .attr("fill", t.inkSoft)
    .style("font-size", "13px")
    .text(d.label);
});

legendG
  .append("circle")
  .attr("cx", 8)
  .attr("cy", 220)
  .attr("r", 10)
  .attr("fill", t.palette[0])
  .attr("fill-opacity", 0.9)
  .attr("stroke", t.pageBg)
  .attr("stroke-width", 1.5);
legendG
  .append("text")
  .attr("x", 26)
  .attr("y", 216)
  .attr("fill", t.inkSoft)
  .style("font-size", "13px")
  .text("City, sized by");
legendG
  .append("text")
  .attr("x", 26)
  .attr("y", 232)
  .attr("fill", t.inkSoft)
  .style("font-size", "13px")
  .text("total connected volume");

// --- Title -----------------------------------------------------------------
svg
  .append("text")
  .attr("x", width / 2)
  .attr("y", 54)
  .attr("text-anchor", "middle")
  .attr("fill", t.ink)
  .style("font-size", "22px")
  .style("font-weight", "600")
  .text("flowmap-origin-destination · javascript · d3 · anyplot.ai");

svg
  .append("text")
  .attr("x", width / 2)
  .attr("y", 84)
  .attr("text-anchor", "middle")
  .attr("fill", t.inkSoft)
  .style("font-size", "15px")
  .text("Population movement between major world cities (thousands per year)");
Runnable source as JSON, for any HTTP client: https://api.anyplot.ai/specs/flowmap-origin-destination/d3/code. Any spec id and library id listed in llms-full.txt fit the same URL shape; every URL below is complete and callable.
{
  "spec_id": "flowmap-origin-destination",
  "language": "javascript",
  "library": "d3",
  "page": "https://anyplot.ai/flowmap-origin-destination/javascript/d3",
  "hub": "https://anyplot.ai/flowmap-origin-destination",
  "code_json": "https://api.anyplot.ai/specs/flowmap-origin-destination/d3/code",
  "spec_json": "https://api.anyplot.ai/specs/flowmap-origin-destination",
  "render_light_png": "https://storage.googleapis.com/anyplot-images/plots/flowmap-origin-destination/javascript/d3/plot-light.png",
  "render_dark_png": "https://storage.googleapis.com/anyplot-images/plots/flowmap-origin-destination/javascript/d3/plot-dark.png",
  "interactive_light_html": "https://storage.googleapis.com/anyplot-images/plots/flowmap-origin-destination/javascript/d3/plot-light.html",
  "interactive_dark_html": "https://storage.googleapis.com/anyplot-images/plots/flowmap-origin-destination/javascript/d3/plot-dark.html",
  "quality_score": 87.0,
  "license": "MIT",
  "guide": "https://anyplot.ai/llms.txt"
}
Part of Origin-Destination Flow Map on anyplot.ai.