The same plot in 14 other libraries — JavaScript: Chart.js, D3.js, Apache ECharts, Highcharts; Python: Altair, Bokeh, lets-plot, Matplotlib, Plotly, plotnine, Pygal, Seaborn; R: ggplot2; Julia: Makie.jl. Compare all 15 side by side: Origin-Destination Flow Map in Python, R, Julia and JavaScript.
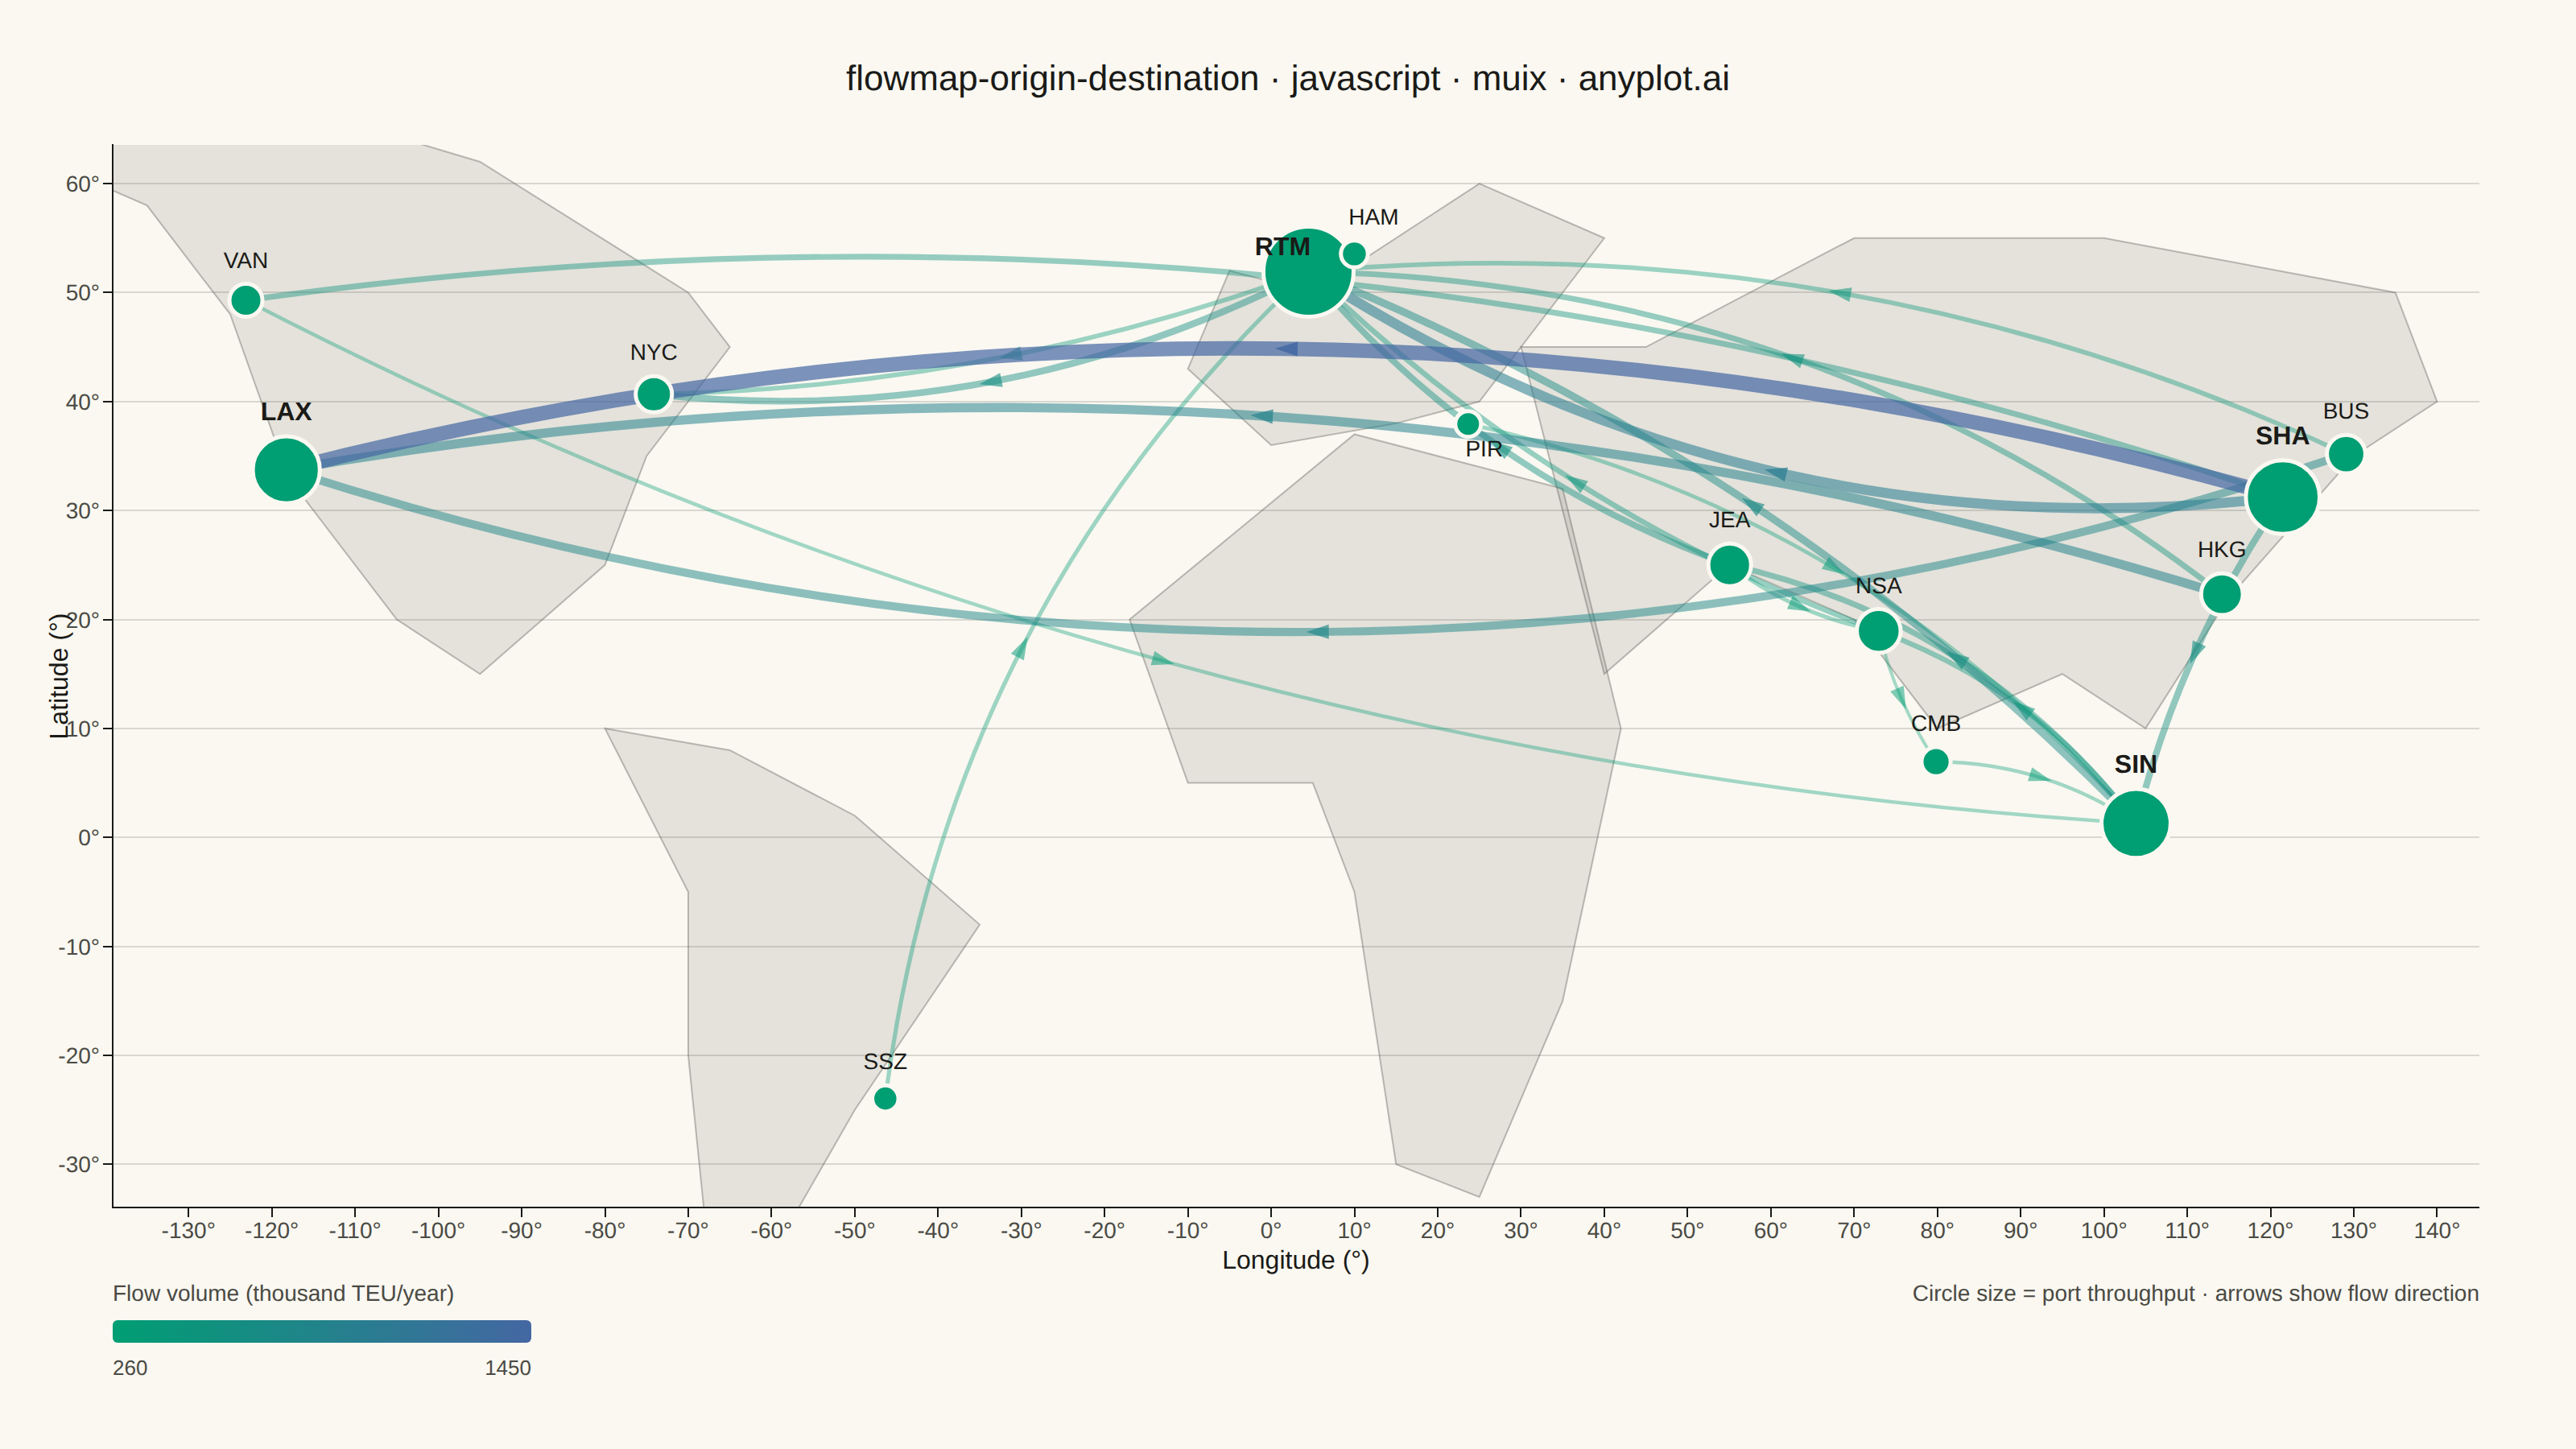
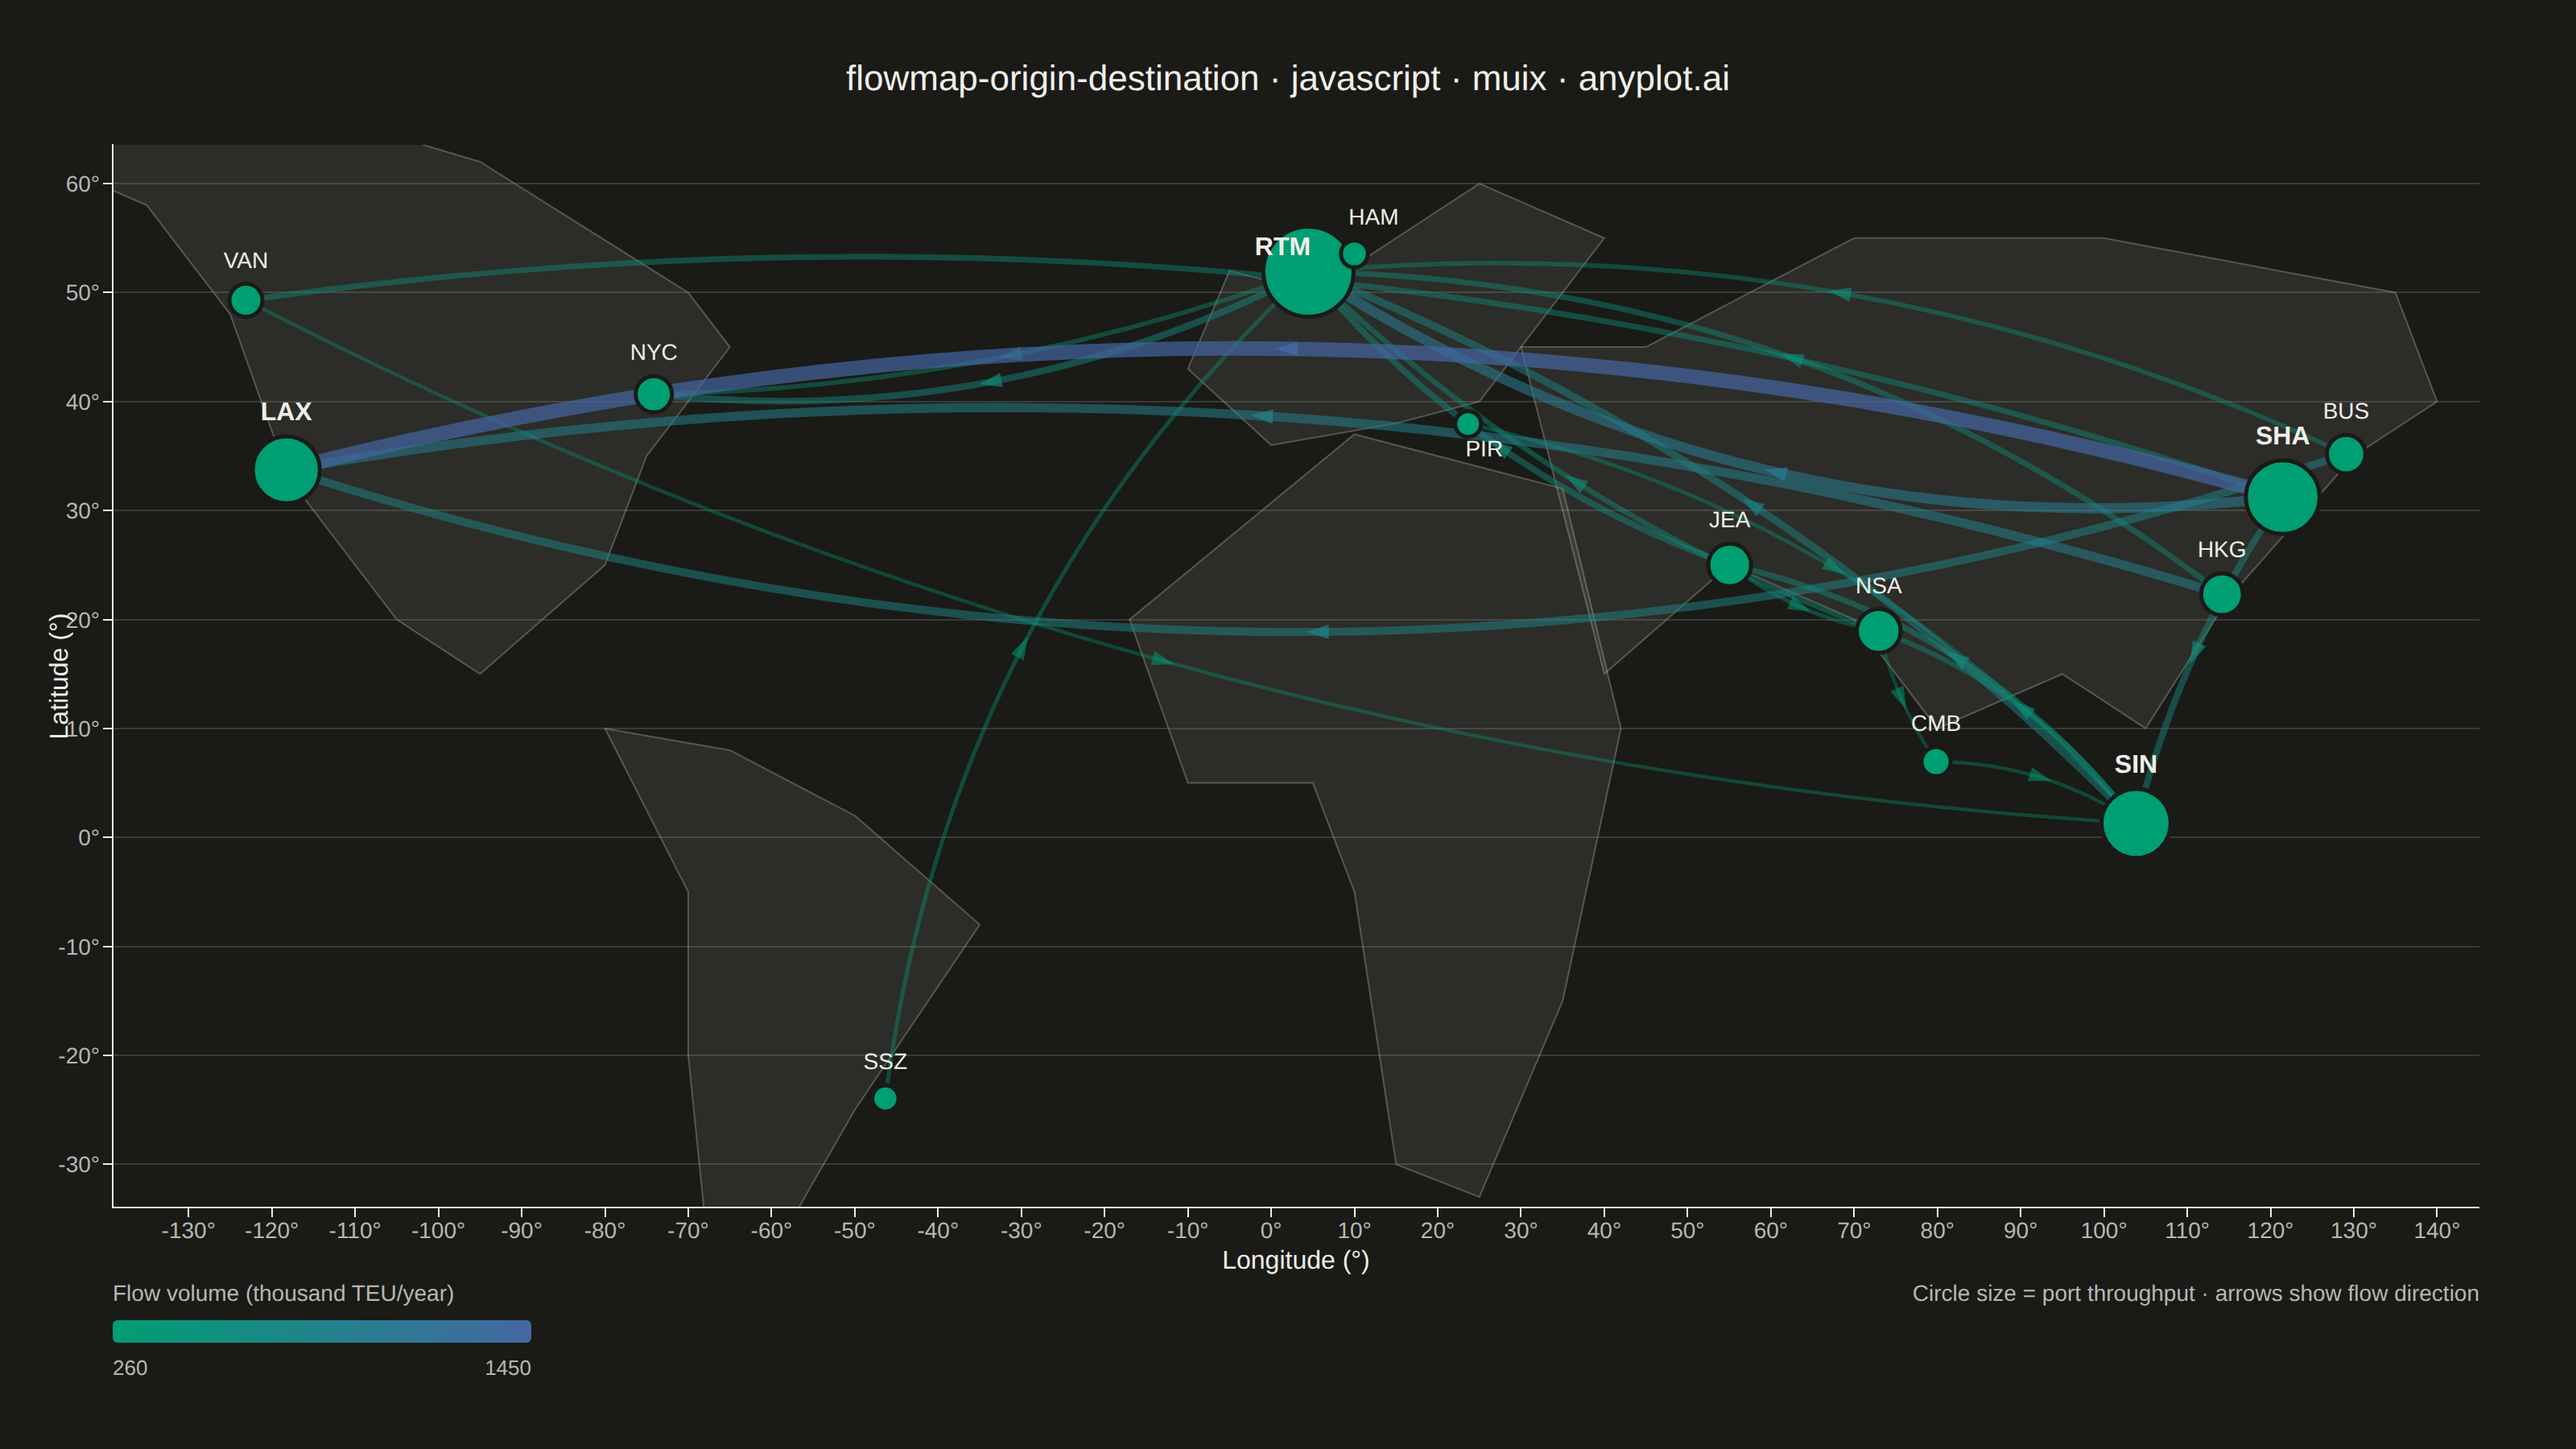
An origin-destination flow map visualizes movement or transfer between geographic locations using curved arcs overlaid on a map. Each arc connects an origin point to a destination point, with line thickness proportional to the flow magnitude. This visualization excels at revealing spatial patterns in migration, trade, or travel data, making it easy to identify major corridors, hub locations, and directional imbalances in movement between places.
// anyplot.ai
// flowmap-origin-destination: Origin-Destination Flow Map
// Library: muix 7.29.1 | JavaScript 22.23.2
// Quality: 89/100 | Created: 2026-09-02
import { useState } from "react";
import { ChartContainer } from "@mui/x-charts/ChartContainer";
import { ChartsXAxis } from "@mui/x-charts/ChartsXAxis";
import { ChartsYAxis } from "@mui/x-charts/ChartsYAxis";
import { ChartsGrid } from "@mui/x-charts/ChartsGrid";
import { useXScale, useYScale, useDrawingArea } from "@mui/x-charts/hooks";

const t = window.ANYPLOT_TOKENS;
const TITLE = "flowmap-origin-destination · javascript · muix · anyplot.ai";

// --- Data: major container ports (in-memory, deterministic) -----------------
const ports = {
  SHA: { name: "Shanghai", lat: 31.23, lon: 121.47 },
  SIN: { name: "Singapore", lat: 1.29, lon: 103.85 },
  BUS: { name: "Busan", lat: 35.18, lon: 129.08 },
  HKG: { name: "Hong Kong", lat: 22.32, lon: 114.17 },
  RTM: { name: "Rotterdam", lat: 51.92, lon: 4.48 },
  LAX: { name: "Los Angeles", lat: 33.73, lon: -118.26 },
  JEA: { name: "Jebel Ali", lat: 25.01, lon: 55.06 },
  HAM: { name: "Hamburg", lat: 53.55, lon: 9.99 },
  NYC: { name: "New York", lat: 40.67, lon: -74.13 },
  SSZ: { name: "Santos", lat: -23.96, lon: -46.33 },
  NSA: { name: "Mumbai", lat: 18.95, lon: 72.95 },
  CMB: { name: "Colombo", lat: 6.95, lon: 79.84 },
  PIR: { name: "Piraeus", lat: 37.94, lon: 23.65 },
  VAN: { name: "Vancouver", lat: 49.29, lon: -123.11 },
};

// Container shipping volumes: thousand TEU/year between port pairs
const flows = [
  { from: "SHA", to: "LAX", volume: 1450 },
  { from: "SHA", to: "RTM", volume: 980 },
  { from: "SHA", to: "SIN", volume: 620 },
  { from: "SIN", to: "RTM", volume: 710 },
  { from: "SIN", to: "JEA", volume: 540 },
  { from: "SIN", to: "NSA", volume: 460 },
  { from: "HKG", to: "LAX", volume: 890 },
  { from: "HKG", to: "RTM", volume: 520 },
  { from: "BUS", to: "LAX", volume: 780 },
  { from: "BUS", to: "RTM", volume: 410 },
  { from: "RTM", to: "NYC", volume: 630 },
  { from: "JEA", to: "RTM", volume: 590 },
  { from: "JEA", to: "NSA", volume: 350 },
  { from: "NSA", to: "RTM", volume: 480 },
  { from: "NSA", to: "CMB", volume: 260 },
  { from: "CMB", to: "SIN", volume: 300 },
  { from: "HAM", to: "NYC", volume: 410 },
  { from: "PIR", to: "SIN", volume: 330 },
  { from: "SSZ", to: "RTM", volume: 360 },
  { from: "VAN", to: "SHA", volume: 520 },
  { from: "VAN", to: "SIN", volume: 300 },
];

const volumes = flows.map((f) => f.volume);
const MIN_VOLUME = Math.min(...volumes);
const MAX_VOLUME = Math.max(...volumes);

// Hub throughput = total volume touching a port (both directions)
const throughputByPort = {};
flows.forEach((f) => {
  throughputByPort[f.from] = (throughputByPort[f.from] || 0) + f.volume;
  throughputByPort[f.to] = (throughputByPort[f.to] || 0) + f.volume;
});
const throughputValues = Object.values(throughputByPort);
const MIN_THROUGHPUT = Math.min(...throughputValues);
const MAX_THROUGHPUT = Math.max(...throughputValues);

// Top hub ports get bolder, larger labels so the busiest nodes read as a
// clear typographic tier above the rest, sharpening the hierarchy.
const HUB_COUNT = 4;
const hubCodes = new Set(
  Object.entries(throughputByPort)
    .sort((a, b) => b[1] - a[1])
    .slice(0, HUB_COUNT)
    .map(([code]) => code),
);

// Flows are drawn largest-last so the dominant corridors stay on top of the
// pile-up around hub ports, and rendered with per-arc bow sign/magnitude so
// arcs sharing a hub fan out instead of stacking on one identical curve.
const sortedFlows = [...flows].sort((a, b) => a.volume - b.volume);

// Manual label nudges so the closely clustered European ports don't collide
// — markers stay at their true coordinates, only the text shifts.
const labelNudge = {
  RTM: { dx: -16, dy: -10 },
  HAM: { dx: 12, dy: -18 },
  PIR: { dx: 10, dy: 20 },
};

const lons = Object.values(ports).map((p) => p.lon);
const lats = Object.values(ports).map((p) => p.lat);
const LON_MIN = Math.min(...lons) - 16;
const LON_MAX = Math.max(...lons) + 16;
const LAT_MIN = Math.min(...lats) - 10;
const LAT_MAX = Math.max(...lats) + 10;

// Interpolate along the Imprint sequential ramp (brand green -> blue) to
// encode flow magnitude in the arc color, per default-style-guide.md
// "Continuous Data" (imprint_seq is single-polarity, so it fits volume).
function lerpSeq(ratio) {
  const a = parseInt(t.seq[0].slice(1), 16);
  const b = parseInt(t.seq[1].slice(1), 16);
  const channel = (shift) => {
    const va = (a >> shift) & 255;
    const vb = (b >> shift) & 255;
    return Math.round(va + (vb - va) * ratio);
  };
  return `rgb(${channel(16)}, ${channel(8)}, ${channel(0)})`;
}

// Simplified continent silhouettes (low-poly, hand-traced) so the chart reads
// as a map rather than a bare lon/lat grid. Rendered through the same
// xScale/yScale hooks as the flow arcs and clipped to the drawing area.
const CONTINENTS = [
  [
    [-165, 68], [-135, 58], [-125, 48], [-118, 33], [-105, 20], [-95, 15], [-80, 25],
    [-75, 35], [-65, 45], [-70, 50], [-95, 62], [-130, 70], [-165, 68],
  ], // North America
  [
    [-80, 10], [-70, -5], [-70, -20], [-68, -35], [-70, -50], [-65, -45], [-50, -25],
    [-35, -8], [-50, 2], [-65, 8], [-80, 10],
  ], // South America
  [
    [-10, 43], [0, 36], [15, 38], [25, 40], [30, 45], [40, 55], [25, 60],
    [5, 50], [-5, 52], [-10, 43],
  ], // Europe
  [
    [-17, 20], [-10, 5], [5, 5], [10, -5], [15, -30], [25, -33], [35, -15],
    [42, 10], [35, 32], [10, 37], [-17, 20],
  ], // Africa
  [
    [30, 45], [40, 15], [55, 25], [70, 20], [80, 10], [95, 15], [105, 10],
    [115, 22], [130, 35], [140, 40], [135, 50], [100, 55], [70, 55], [45, 45], [30, 45],
  ], // Asia
];

// --- Overlay: title drawn in the reserved top margin -------------------------
// Plain SVG <text>, not ChartsText: ChartsText applies its own measured-width
// anchor offset on top of the native SVG text-anchor, which for a long
// middle-anchored string like this double-shifts it off-center.
function MapTitle() {
  const { width } = window.ANYPLOT_SIZE;
  return (
    <text x={width / 2} y={40} textAnchor="middle" dominantBaseline="hanging" fontSize={22} fontWeight={500} fill={t.ink}>
      {TITLE}
    </text>
  );
}

// --- Overlay: simplified continent silhouettes behind the flow arcs ---------
function WorldOutline() {
  const xScale = useXScale();
  const yScale = useYScale();
  const drawingArea = useDrawingArea();
  return (
    <g>
      <defs>
        <clipPath id="worldClip">
          <rect x={drawingArea.left} y={drawingArea.top} width={drawingArea.width} height={drawingArea.height} />
        </clipPath>
      </defs>
      <g clipPath="url(#worldClip)">
        {CONTINENTS.map((points, i) => {
          const d = points.map(([lon, lat], j) => `${j === 0 ? "M" : "L"} ${xScale(lon)},${yScale(lat)}`).join(" ") + " Z";
          return <path key={i} d={d} fill={t.inkSoft} fillOpacity={0.12} stroke={t.inkSoft} strokeWidth={1} strokeOpacity={0.35} />;
        })}
      </g>
    </g>
  );
}

// --- Overlay: origin-destination flow arcs, direction arrows, port nodes ----
function FlowOverlay({ onHoverChange }) {
  const xScale = useXScale();
  const yScale = useYScale();

  return (
    <g>
      {sortedFlows.map((flow, i) => {
        const origin = ports[flow.from];
        const dest = ports[flow.to];
        const x1 = xScale(origin.lon);
        const y1 = yScale(origin.lat);
        const x2 = xScale(dest.lon);
        const y2 = yScale(dest.lat);

        const dx = x2 - x1;
        const dy = y2 - y1;
        const dist = Math.sqrt(dx * dx + dy * dy) || 1;
        const midX = (x1 + x2) / 2;
        const midY = (y1 + y2) / 2;
        // Perpendicular bow approximates a great-circle arc on the flat projection.
        // Sign/magnitude vary per arc so flows sharing a hub fan out instead of
        // stacking on one identical curve through the hub circle.
        const ux = -dy / dist;
        const uy = dx / dist;
        const bowSign = i % 2 === 0 ? 1 : -1;
        const bowMagnitude = 0.09 + ((i * 53) % 7) * 0.015;
        const bow = dist * bowMagnitude * bowSign;
        const controlX = midX + ux * bow;
        const controlY = midY + uy * bow;

        const ratio = (flow.volume - MIN_VOLUME) / (MAX_VOLUME - MIN_VOLUME || 1);
        const strokeWidth = 2 + ratio * 7;
        const strokeOpacity = 0.35 + ratio * 0.35;
        const color = lerpSeq(ratio);

        // A quadratic Bezier's tangent at t=0.5 equals the chord direction
        // (P2 - P0), so the arrowhead angle is simply atan2(dy, dx); the
        // on-curve midpoint itself is the weighted blend below.
        const arrowX = 0.25 * x1 + 0.5 * controlX + 0.25 * x2;
        const arrowY = 0.25 * y1 + 0.5 * controlY + 0.25 * y2;
        const angleDeg = (Math.atan2(dy, dx) * 180) / Math.PI;

        const flowTooltip = {
          label: `${origin.name} → ${dest.name}`,
          detail: `${flow.volume.toLocaleString()} thousand TEU/year`,
          x: arrowX,
          y: arrowY,
        };

        return (
          <g key={`${flow.from}-${flow.to}-${i}`}>
            <path
              d={`M ${x1},${y1} Q ${controlX},${controlY} ${x2},${y2}`}
              fill="none"
              stroke={color}
              strokeWidth={strokeWidth}
              strokeOpacity={strokeOpacity}
              strokeLinecap="round"
            />
            {/* Wider transparent hit path: the visible stroke is often too thin to hover reliably. */}
            <path
              d={`M ${x1},${y1} Q ${controlX},${controlY} ${x2},${y2}`}
              fill="none"
              stroke="transparent"
              strokeWidth={Math.max(strokeWidth, 16)}
              style={{ cursor: "pointer" }}
              onMouseEnter={() => onHoverChange(flowTooltip)}
              onMouseLeave={() => onHoverChange(null)}
            />
            <polygon
              points="-7,-4.5 7,0 -7,4.5"
              transform={`translate(${arrowX}, ${arrowY}) rotate(${angleDeg})`}
              fill={color}
              fillOpacity={Math.min(strokeOpacity + 0.15, 0.9)}
            />
          </g>
        );
      })}
      {Object.entries(ports).map(([code, port]) => {
        const cx = xScale(port.lon);
        const cy = yScale(port.lat);
        const throughput = throughputByPort[code] || 0;
        const throughputRatio = (throughput - MIN_THROUGHPUT) / (MAX_THROUGHPUT - MIN_THROUGHPUT || 1);
        const radius = 8 + throughputRatio * 20;
        const nudge = labelNudge[code] || { dx: 0, dy: -(radius + 10) };
        const isHub = hubCodes.has(code);
        const portTooltip = {
          label: port.name,
          detail: `Throughput: ${throughput.toLocaleString()} thousand TEU/year`,
          x: cx,
          y: cy - radius - 8,
        };
        return (
          <g key={code}>
            <circle
              cx={cx}
              cy={cy}
              r={radius}
              fill={t.palette[0]}
              stroke={t.pageBg}
              strokeWidth={2.5}
              style={{ cursor: "pointer" }}
              onMouseEnter={() => onHoverChange(portTooltip)}
              onMouseLeave={() => onHoverChange(null)}
            />
            <text
              x={cx + nudge.dx}
              y={cy + nudge.dy}
              textAnchor="middle"
              fontSize={isHub ? 16 : 14}
              fontWeight={isHub ? 700 : 500}
              fill={t.ink}
              style={{ pointerEvents: "none" }}
            >
              {code}
            </text>
          </g>
        );
      })}
    </g>
  );
}

// --- Overlay: hover tooltip for flow arcs and port circles ------------------
function HoverTooltip({ hover }) {
  if (!hover) return null;
  const charWidth = 7.2;
  const width = Math.max(hover.label.length, hover.detail.length) * charWidth + 20;
  const height = 44;
  const x = hover.x - width / 2;
  const y = hover.y - height - 12;
  return (
    <g style={{ pointerEvents: "none" }}>
      <rect x={x} y={y} width={width} height={height} rx={6} fill={t.elevatedBg} stroke={t.inkSoft} strokeOpacity={0.4} />
      <text x={hover.x} y={y + 18} textAnchor="middle" fontSize={13} fontWeight={600} fill={t.ink}>
        {hover.label}
      </text>
      <text x={hover.x} y={y + 34} textAnchor="middle" fontSize={12} fill={t.inkSoft}>
        {hover.detail}
      </text>
    </g>
  );
}

// --- Overlay: color-ramp legend for flow volume, plus a usage caption -------
function Legend() {
  const drawingArea = useDrawingArea();
  const barX = drawingArea.left;
  const barY = drawingArea.top + drawingArea.height + 70;
  const barWidth = 260;
  const barHeight = 14;

  return (
    <g>
      <defs>
        <linearGradient id="flowLegendGradient" x1="0%" x2="100%" y1="0%" y2="0%">
          <stop offset="0%" stopColor={t.seq[0]} />
          <stop offset="100%" stopColor={t.seq[1]} />
        </linearGradient>
      </defs>
      <text x={barX} y={barY - 12} textAnchor="start" fontSize={14} fontWeight={400} fill={t.inkSoft}>
        Flow volume (thousand TEU/year)
      </text>
      <rect x={barX} y={barY} width={barWidth} height={barHeight} fill="url(#flowLegendGradient)" rx={3} />
      <text x={barX} y={barY + barHeight + 20} textAnchor="start" fontSize={13} fill={t.inkSoft}>
        {MIN_VOLUME}
      </text>
      <text x={barX + barWidth} y={barY + barHeight + 20} textAnchor="end" fontSize={13} fill={t.inkSoft}>
        {MAX_VOLUME}
      </text>
      <text
        x={drawingArea.left + drawingArea.width}
        y={barY - 12}
        textAnchor="end"
        fontSize={14}
        fill={t.inkSoft}
      >
        Circle size = port throughput · arrows show flow direction
      </text>
    </g>
  );
}

// --- Chart (default-exported component — the harness mounts it) -------------
export default function Chart() {
  const [hover, setHover] = useState(null);
  return (
    <ChartContainer
      width={window.ANYPLOT_SIZE.width}
      height={window.ANYPLOT_SIZE.height}
      margin={{ top: 90, right: 60, bottom: 150, left: 70 }}
      series={[]}
      skipAnimation
      disableAxisListener
      xAxis={[
        {
          scaleType: "linear",
          min: LON_MIN,
          max: LON_MAX,
          label: "Longitude (°)",
          valueFormatter: (v) => `${v}°`,
          labelStyle: { fontSize: 16, fill: t.ink },
          tickLabelStyle: { fontSize: 14, fill: t.inkSoft },
        },
      ]}
      yAxis={[
        {
          scaleType: "linear",
          min: LAT_MIN,
          max: LAT_MAX,
          label: "Latitude (°)",
          valueFormatter: (v) => `${v}°`,
          labelStyle: { fontSize: 16, fill: t.ink },
          tickLabelStyle: { fontSize: 14, fill: t.inkSoft },
        },
      ]}
    >
      {/* Horizontal-only reference lines: the continent silhouettes already carry
          geographic context, so a vertical grid would just compete with the arcs. */}
      <ChartsGrid horizontal />
      <WorldOutline />
      <FlowOverlay onHoverChange={setHover} />
      <ChartsXAxis />
      <ChartsYAxis />
      <MapTitle />
      <Legend />
      <HoverTooltip hover={hover} />
    </ChartContainer>
  );
}
Runnable source as JSON, for any HTTP client: https://api.anyplot.ai/specs/flowmap-origin-destination/muix/code. Any spec id and library id listed in llms-full.txt fit the same URL shape; every URL below is complete and callable.
{
  "spec_id": "flowmap-origin-destination",
  "language": "javascript",
  "library": "muix",
  "page": "https://anyplot.ai/flowmap-origin-destination/javascript/muix",
  "hub": "https://anyplot.ai/flowmap-origin-destination",
  "code_json": "https://api.anyplot.ai/specs/flowmap-origin-destination/muix/code",
  "spec_json": "https://api.anyplot.ai/specs/flowmap-origin-destination",
  "render_light_png": "https://storage.googleapis.com/anyplot-images/plots/flowmap-origin-destination/javascript/muix/plot-light.png",
  "render_dark_png": "https://storage.googleapis.com/anyplot-images/plots/flowmap-origin-destination/javascript/muix/plot-dark.png",
  "interactive_light_html": "https://storage.googleapis.com/anyplot-images/plots/flowmap-origin-destination/javascript/muix/plot-light.html",
  "interactive_dark_html": "https://storage.googleapis.com/anyplot-images/plots/flowmap-origin-destination/javascript/muix/plot-dark.html",
  "quality_score": 89.0,
  "license": "MIT",
  "guide": "https://anyplot.ai/llms.txt"
}
Part of Origin-Destination Flow Map on anyplot.ai.