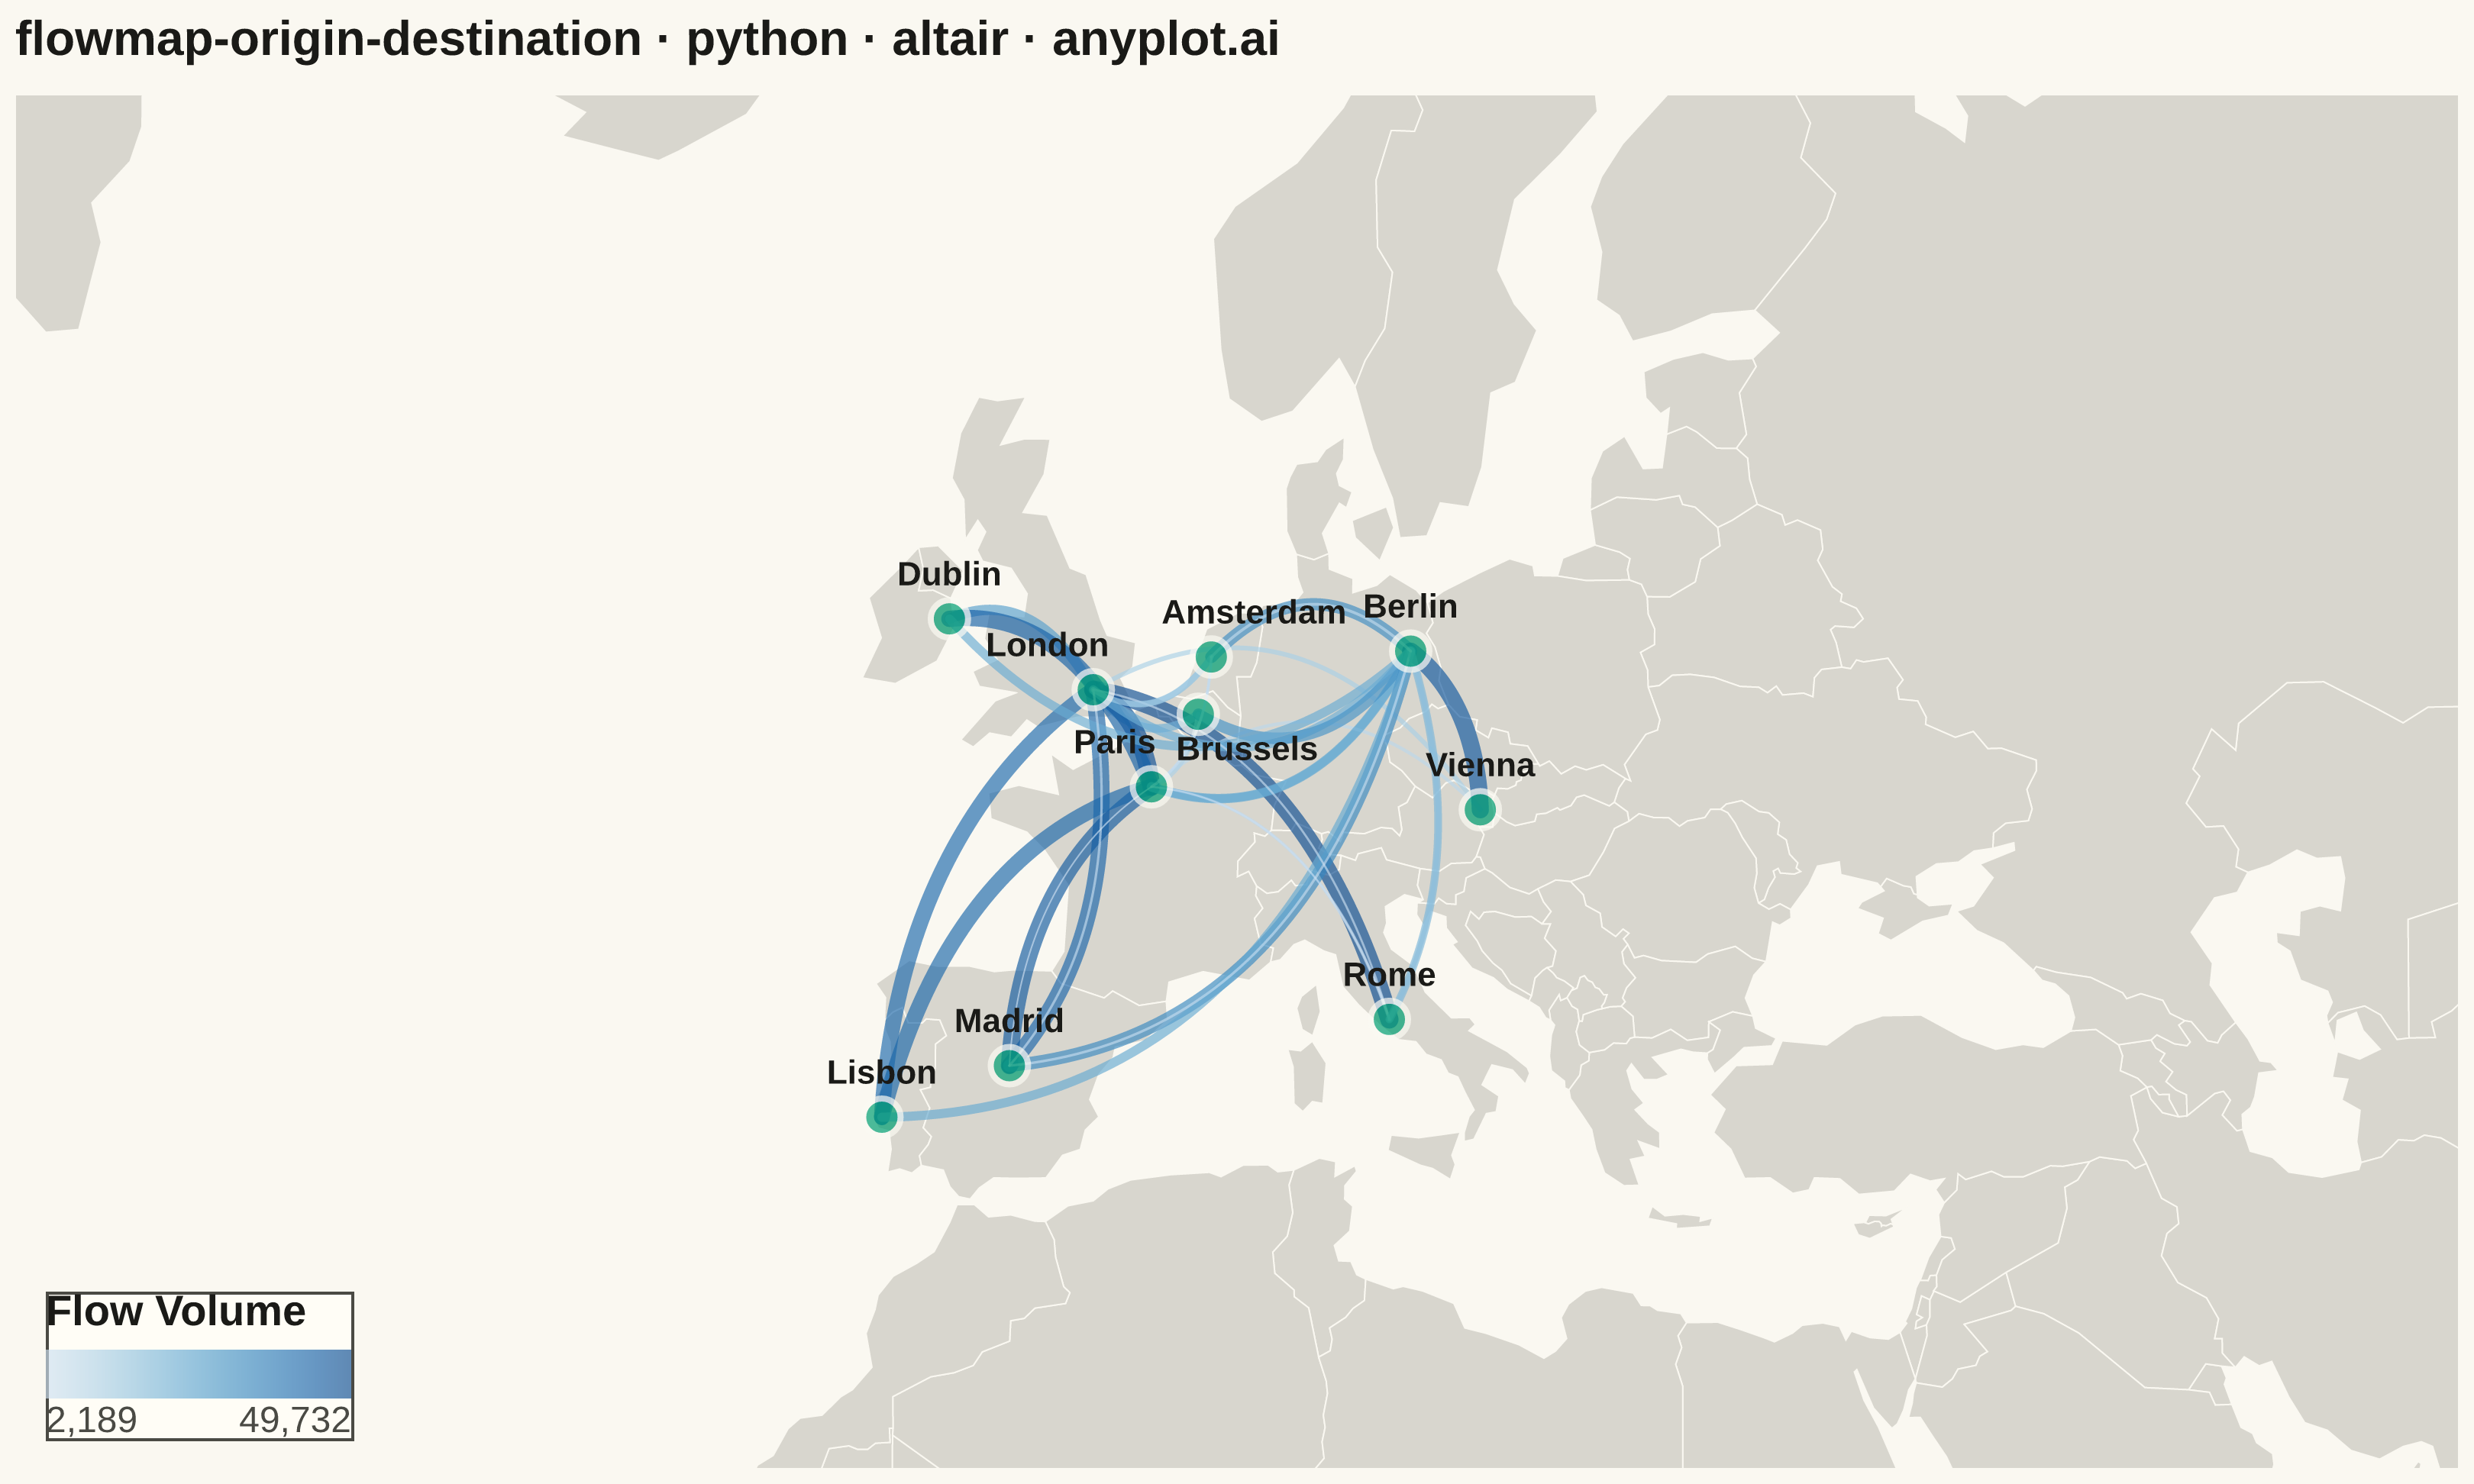
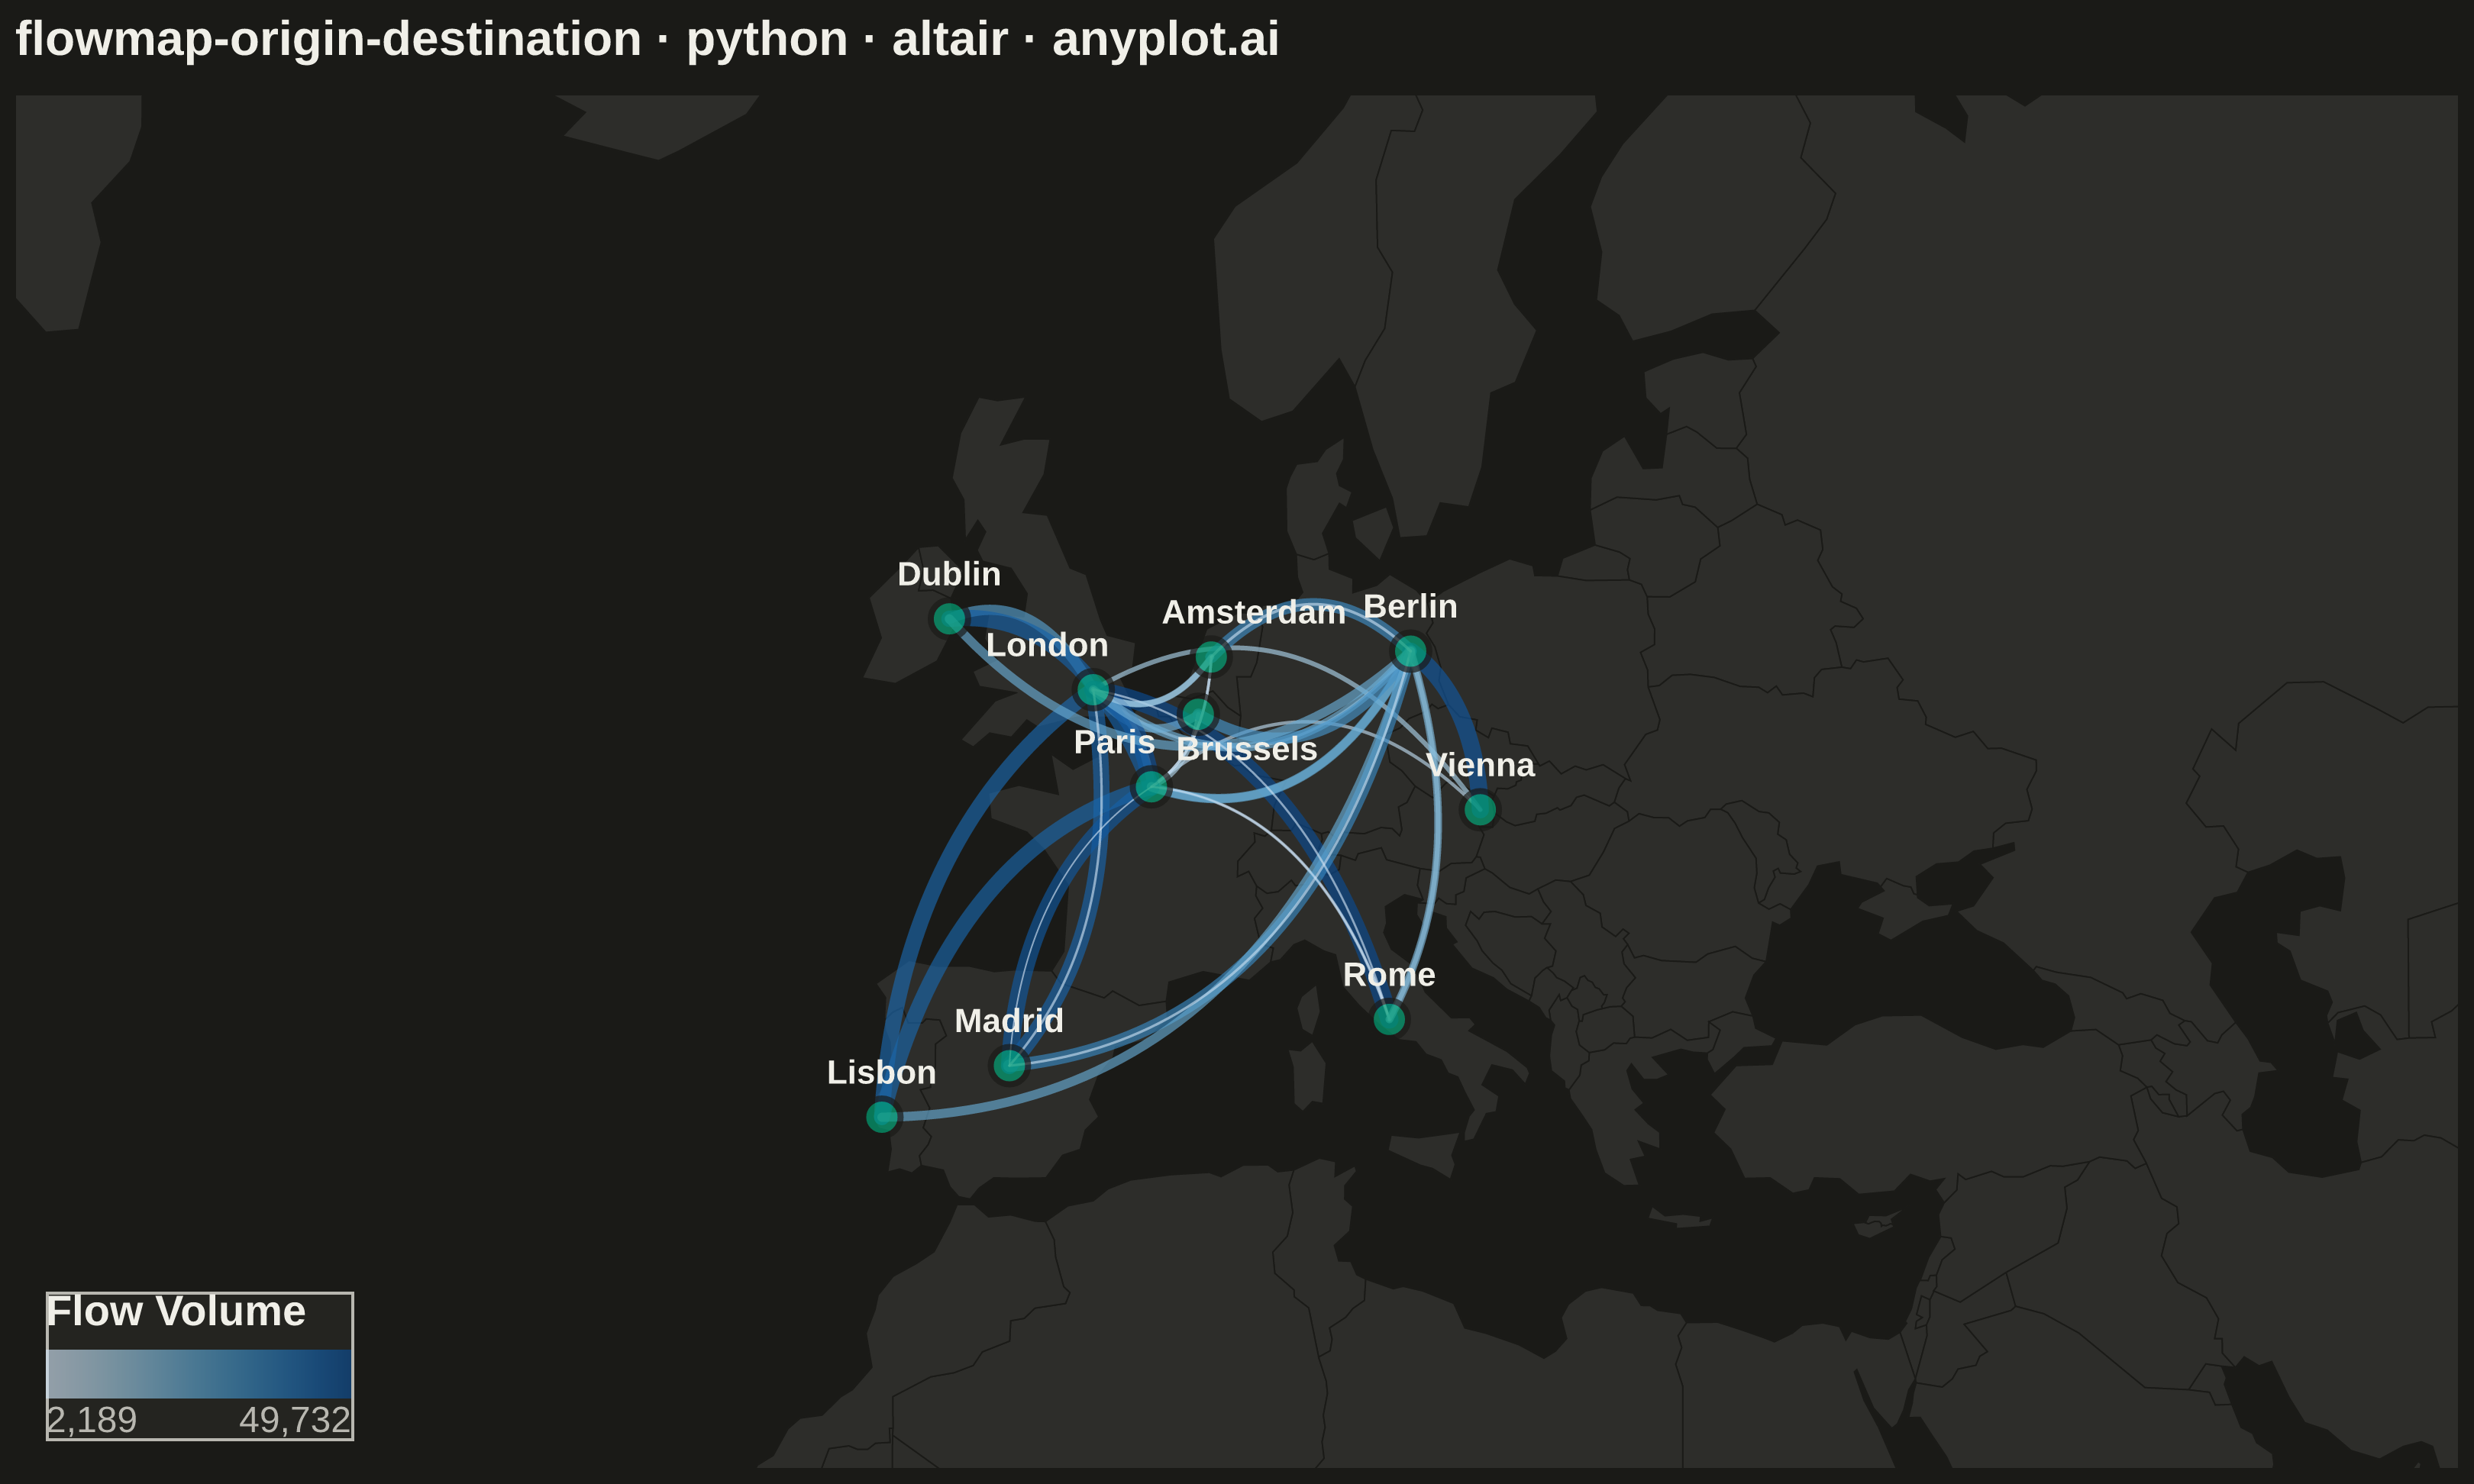
An origin-destination flow map visualizes movement or transfer between geographic locations using curved arcs overlaid on a map. Each arc connects an origin point to a destination point, with line thickness proportional to the flow magnitude. This visualization excels at revealing spatial patterns in migration, trade, or travel data, making it easy to identify major corridors, hub locations, and directional imbalances in movement between places.
""" anyplot.ai
flowmap-origin-destination: Origin-Destination Flow Map
Library: altair 6.1.0 | Python 3.13.13
Quality: 89/100 | Updated: 2026-05-20
"""

import os

import altair as alt
import numpy as np
import pandas as pd


# Theme tokens
THEME = os.getenv("ANYPLOT_THEME", "light")
PAGE_BG = "#FAF8F1" if THEME == "light" else "#1A1A17"
ELEVATED_BG = "#FFFDF6" if THEME == "light" else "#242420"
INK = "#1A1A17" if THEME == "light" else "#F0EFE8"
INK_SOFT = "#4A4A44" if THEME == "light" else "#B8B7B0"
MAP_FILL = "#D8D6CE" if THEME == "light" else "#2D2D2A"

# Data: Migration flows between major European cities
np.random.seed(42)

cities = {
    "London": (51.5074, -0.1278),
    "Paris": (48.8566, 2.3522),
    "Berlin": (52.5200, 13.4050),
    "Madrid": (40.4168, -3.7038),
    "Rome": (41.9028, 12.4964),
    "Amsterdam": (52.3676, 4.9041),
    "Vienna": (48.2082, 16.3738),
    "Brussels": (50.8503, 4.3517),
    "Lisbon": (38.7223, -9.1393),
    "Dublin": (53.3498, -6.2603),
}

flows = []
city_names = list(cities.keys())
hub_cities = ["London", "Paris", "Berlin"]

for hub in hub_cities:
    for dest in city_names:
        if hub != dest:
            flows.append(
                {
                    "origin": hub,
                    "origin_lat": cities[hub][0],
                    "origin_lon": cities[hub][1],
                    "dest": dest,
                    "dest_lat": cities[dest][0],
                    "dest_lon": cities[dest][1],
                    "flow": np.random.randint(5000, 50000),
                }
            )

for origin in ["Madrid", "Rome", "Amsterdam"]:
    for dest in hub_cities:
        flows.append(
            {
                "origin": origin,
                "origin_lat": cities[origin][0],
                "origin_lon": cities[origin][1],
                "dest": dest,
                "dest_lat": cities[dest][0],
                "dest_lon": cities[dest][1],
                "flow": np.random.randint(2000, 20000),
            }
        )

df_flows = pd.DataFrame(flows)
df_cities = pd.DataFrame([{"city": n, "lat": c[0], "lon": c[1]} for n, c in cities.items()])

# Generate Bezier arc paths; forward/reverse pairs curve in opposite directions
# to reduce overlap in dense corridors like London–Paris–Berlin
arc_data = []
for _, row in df_flows.iterrows():
    n_points = 50
    t = np.linspace(0, 1, n_points)
    x0, y0 = row["origin_lon"], row["origin_lat"]
    x1, y1 = row["dest_lon"], row["dest_lat"]
    mid_x, mid_y = (x0 + x1) / 2, (y0 + y1) / 2
    dx, dy = x1 - x0, y1 - y0

    # Deterministic sign: alphabetically first city curves one way, reverse curves other
    sign = 1 if sorted([row["origin"], row["dest"]])[0] == row["origin"] else -1
    ctrl_x = mid_x - dy * 0.3 * sign
    ctrl_y = mid_y + dx * 0.3 * sign

    x_c = (1 - t) ** 2 * x0 + 2 * (1 - t) * t * ctrl_x + t**2 * x1
    y_c = (1 - t) ** 2 * y0 + 2 * (1 - t) * t * ctrl_y + t**2 * y1

    fid = f"{row['origin']}-{row['dest']}"
    for j in range(n_points):
        arc_data.append(
            {
                "flow_id": fid,
                "order": j,
                "lon": x_c[j],
                "lat": y_c[j],
                "flow": row["flow"],
                "origin": row["origin"],
                "dest": row["dest"],
            }
        )

df_arcs = pd.DataFrame(arc_data)
max_flow, min_flow = df_flows["flow"].max(), df_flows["flow"].min()
df_arcs["stroke_width"] = 0.5 + 5.5 * (df_arcs["flow"] - min_flow) / (max_flow - min_flow)

# Per-city label groups to avoid crowding in the dense London/Paris/Brussels/Amsterdam cluster
# Brussels placed below its dot; London/Paris/Amsterdam offset horizontally
dense_cities = {"London", "Paris", "Amsterdam", "Brussels"}
df_labels_normal = df_cities[~df_cities["city"].isin(dense_cities)]
df_london = df_cities[df_cities["city"] == "London"]
df_paris = df_cities[df_cities["city"] == "Paris"]
df_amsterdam = df_cities[df_cities["city"] == "Amsterdam"]
df_brussels = df_cities[df_cities["city"] == "Brussels"]

# Plot — geographic projection centered on Europe, tightened to fill canvas
world_url = "https://cdn.jsdelivr.net/npm/world-atlas@2/countries-110m.json"
world = alt.topo_feature(world_url, "countries")
proj = {"type": "mercator", "scale": 440, "center": [6, 49], "clipExtent": [[0, 0], [800, 450]]}

base = (
    alt.Chart(world)
    .mark_geoshape(fill=MAP_FILL, stroke=PAGE_BG, strokeWidth=0.5)
    .project(**proj)
    .properties(width=800, height=450)
)

arcs = (
    alt.Chart(df_arcs)
    .mark_line(opacity=0.65, strokeCap="round")
    .encode(
        longitude="lon:Q",
        latitude="lat:Q",
        detail="flow_id:N",
        order="order:O",
        strokeWidth=alt.StrokeWidth("stroke_width:Q", scale=None, legend=None),
        color=alt.Color(
            "flow:Q",
            scale=alt.Scale(scheme="blues", domain=[min_flow, max_flow]),
            legend=alt.Legend(title="Flow Volume", titleFontSize=14, labelFontSize=12, orient="bottom-left", offset=10),
        ),
        tooltip=["origin:N", "dest:N", "flow:Q"],
    )
    .project(**proj)
)

points = (
    alt.Chart(df_cities)
    .mark_circle(size=150, color="#009E73", stroke=PAGE_BG, strokeWidth=2)
    .encode(longitude="lon:Q", latitude="lat:Q", tooltip=["city:N"])
    .project(**proj)
)

lbl_kw = {"fontSize": 11, "fontWeight": "bold", "color": INK}
lbl_enc = {"longitude": "lon:Q", "latitude": "lat:Q", "text": "city:N"}

labels_normal = alt.Chart(df_labels_normal).mark_text(dy=-14, **lbl_kw).encode(**lbl_enc).project(**proj)
labels_london = alt.Chart(df_london).mark_text(dx=-15, dy=-14, **lbl_kw).encode(**lbl_enc).project(**proj)
labels_paris = alt.Chart(df_paris).mark_text(dx=-12, dy=-14, **lbl_kw).encode(**lbl_enc).project(**proj)
labels_amsterdam = alt.Chart(df_amsterdam).mark_text(dx=14, dy=-14, **lbl_kw).encode(**lbl_enc).project(**proj)
labels_brussels = alt.Chart(df_brussels).mark_text(dx=16, dy=12, **lbl_kw).encode(**lbl_enc).project(**proj)

chart = (
    (base + arcs + points + labels_normal + labels_london + labels_paris + labels_amsterdam + labels_brussels)
    .properties(
        title=alt.Title(
            "flowmap-origin-destination · python · altair · anyplot.ai", fontSize=16, anchor="start", offset=10
        ),
        background=PAGE_BG,
    )
    .configure_view(fill=PAGE_BG, strokeWidth=0)
    .configure_title(color=INK)
    .configure_legend(
        fillColor=ELEVATED_BG,
        strokeColor=INK_SOFT,
        labelColor=INK_SOFT,
        titleColor=INK,
        labelFontSize=12,
        titleFontSize=14,
    )
)

# Save
chart.save(f"plot-{THEME}.png", scale_factor=4.0)
chart.save(f"plot-{THEME}.html")
Runnable source as JSON, for any HTTP client: https://api.anyplot.ai/specs/flowmap-origin-destination/altair/code. Any spec id and library id listed in llms-full.txt fit the same URL shape; every URL below is complete and callable.
{
  "spec_id": "flowmap-origin-destination",
  "language": "python",
  "library": "altair",
  "page": "https://anyplot.ai/flowmap-origin-destination/python/altair",
  "hub": "https://anyplot.ai/flowmap-origin-destination",
  "code_json": "https://api.anyplot.ai/specs/flowmap-origin-destination/altair/code",
  "spec_json": "https://api.anyplot.ai/specs/flowmap-origin-destination",
  "render_light_png": "https://storage.googleapis.com/anyplot-images/plots/flowmap-origin-destination/python/altair/plot-light.png",
  "render_dark_png": "https://storage.googleapis.com/anyplot-images/plots/flowmap-origin-destination/python/altair/plot-dark.png",
  "interactive_light_html": "https://storage.googleapis.com/anyplot-images/plots/flowmap-origin-destination/python/altair/plot-light.html",
  "interactive_dark_html": "https://storage.googleapis.com/anyplot-images/plots/flowmap-origin-destination/python/altair/plot-dark.html",
  "quality_score": 89.0,
  "license": "MIT",
  "guide": "https://anyplot.ai/llms.txt"
}
Part of Origin-Destination Flow Map on anyplot.ai.