The same plot in 14 other libraries — JavaScript: D3.js, Apache ECharts, Highcharts, MUI X Charts; Python: Altair, Bokeh, lets-plot, Matplotlib, Plotly, plotnine, Pygal, Seaborn; R: ggplot2; Julia: Makie.jl. Compare all 15 side by side: Efficient Frontier for Portfolio Optimization in Python, R, Julia and JavaScript.
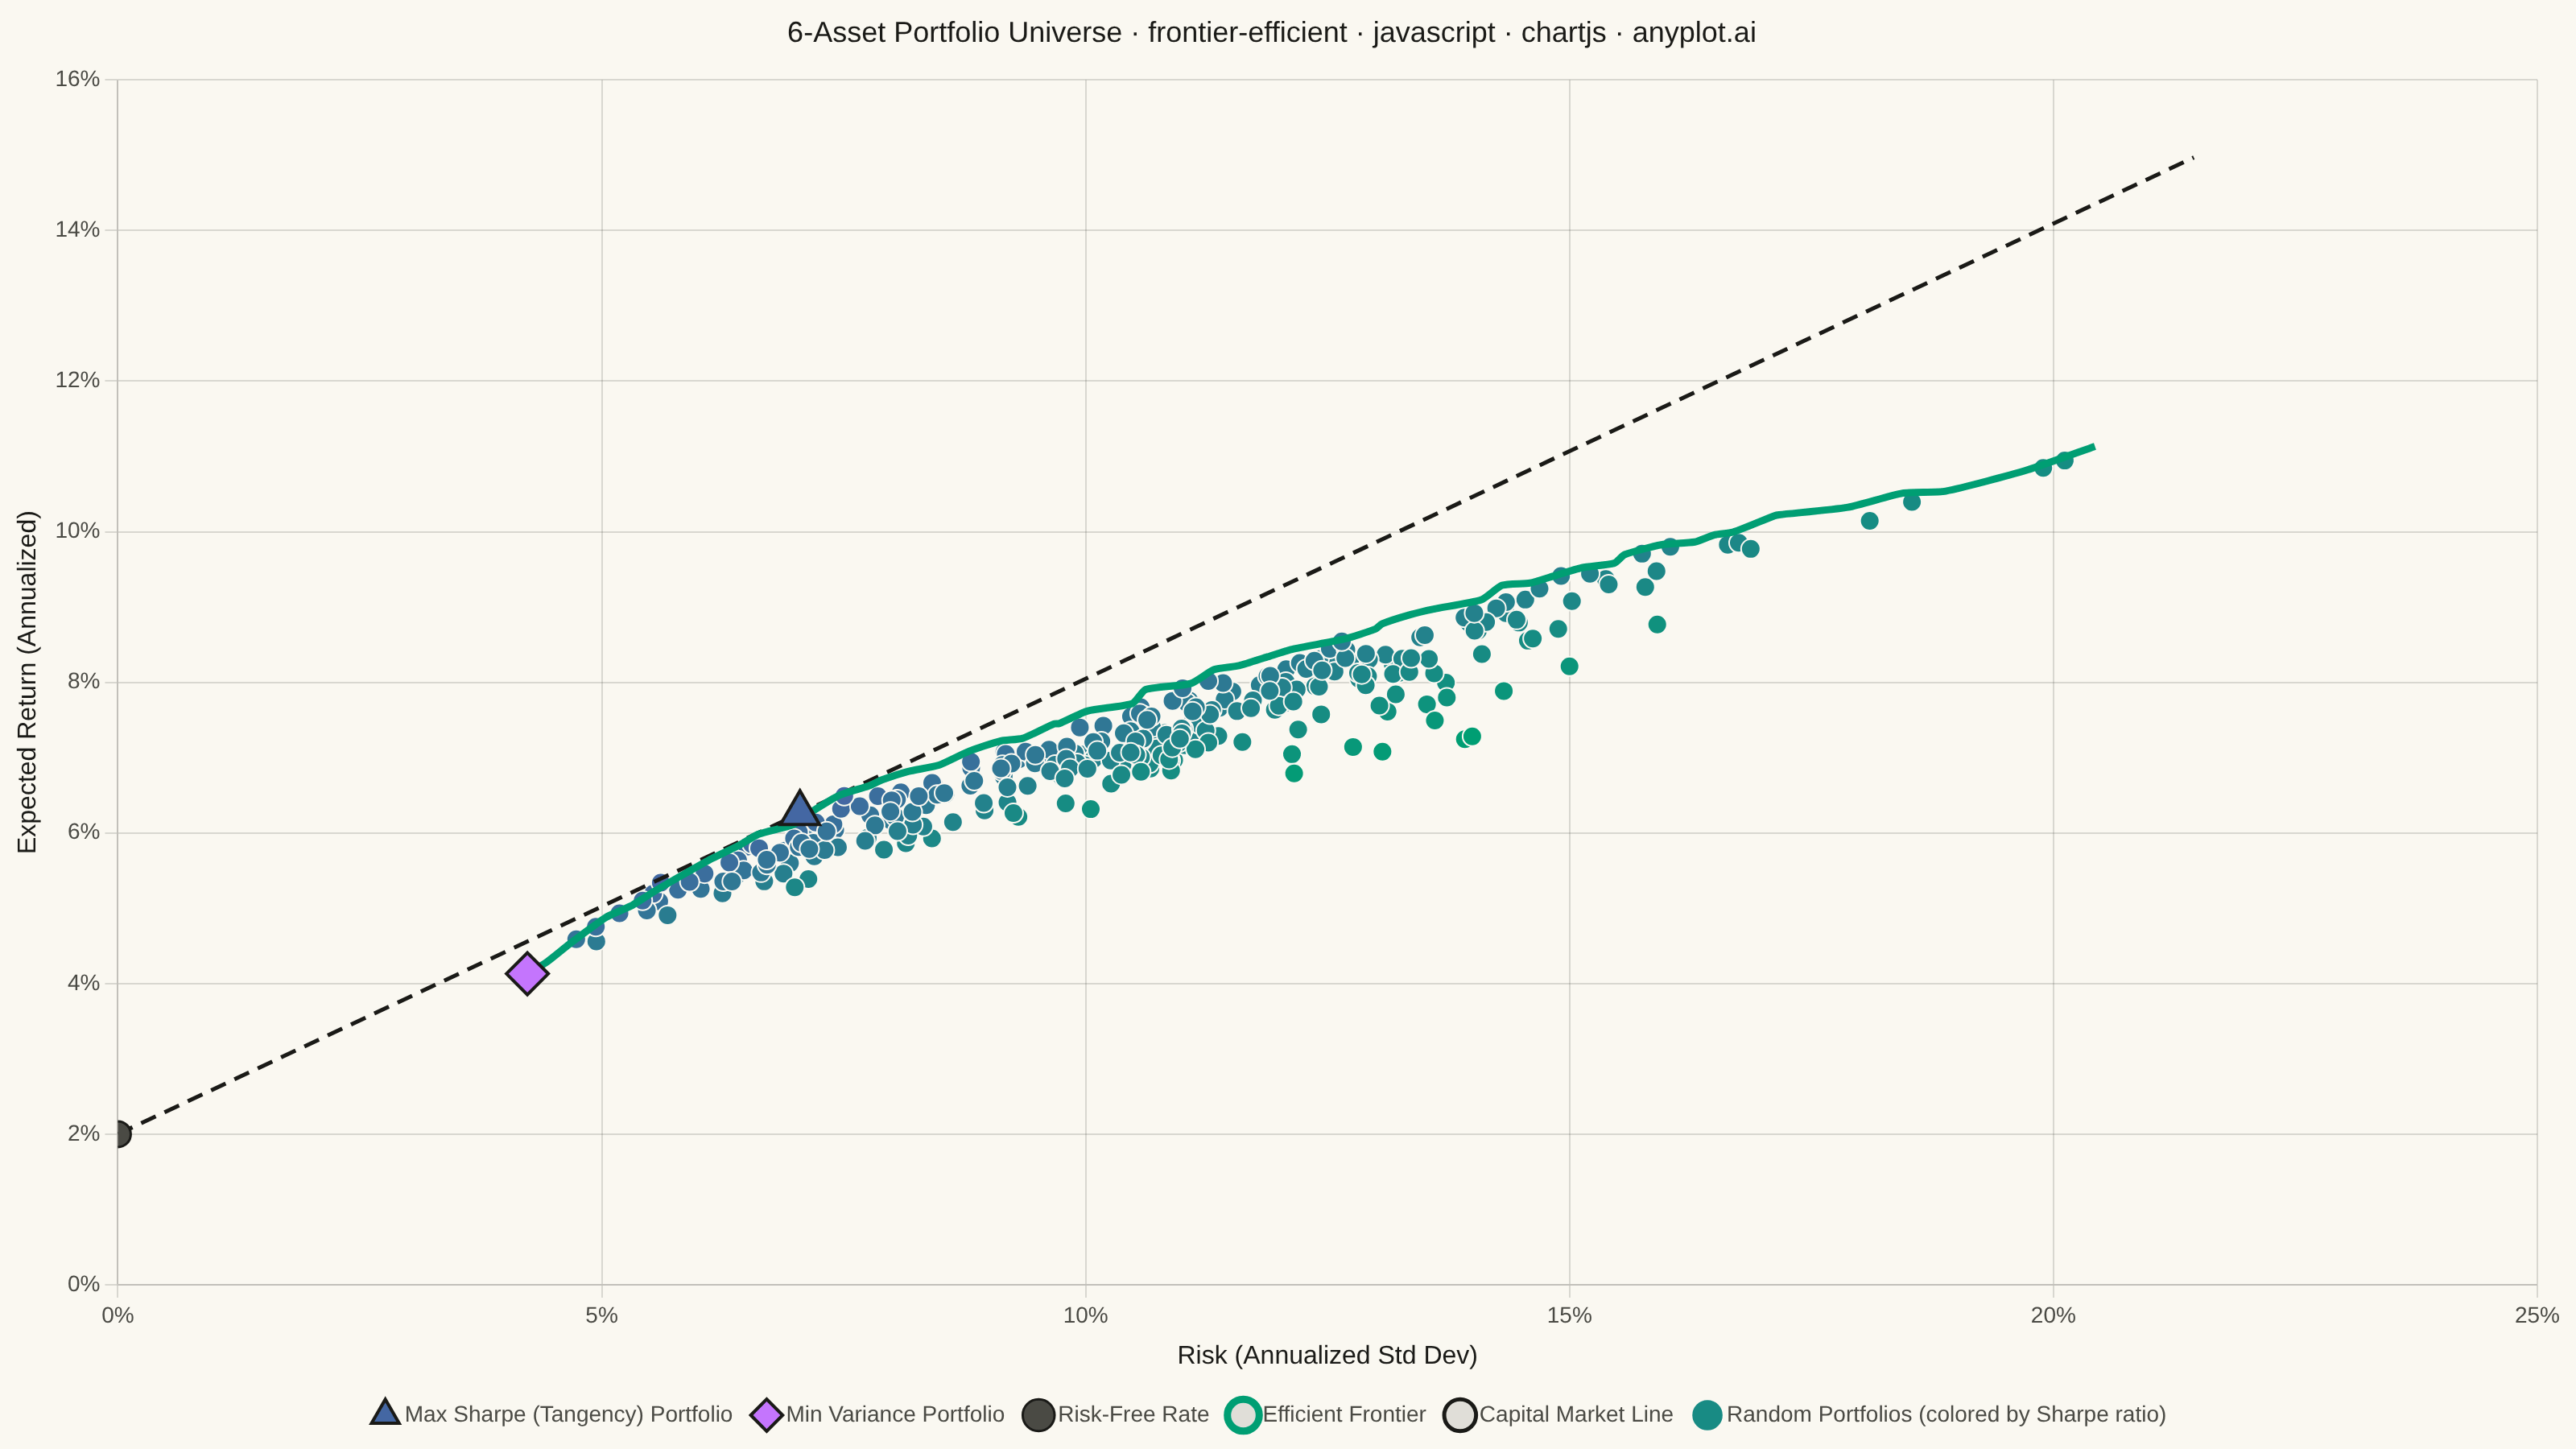
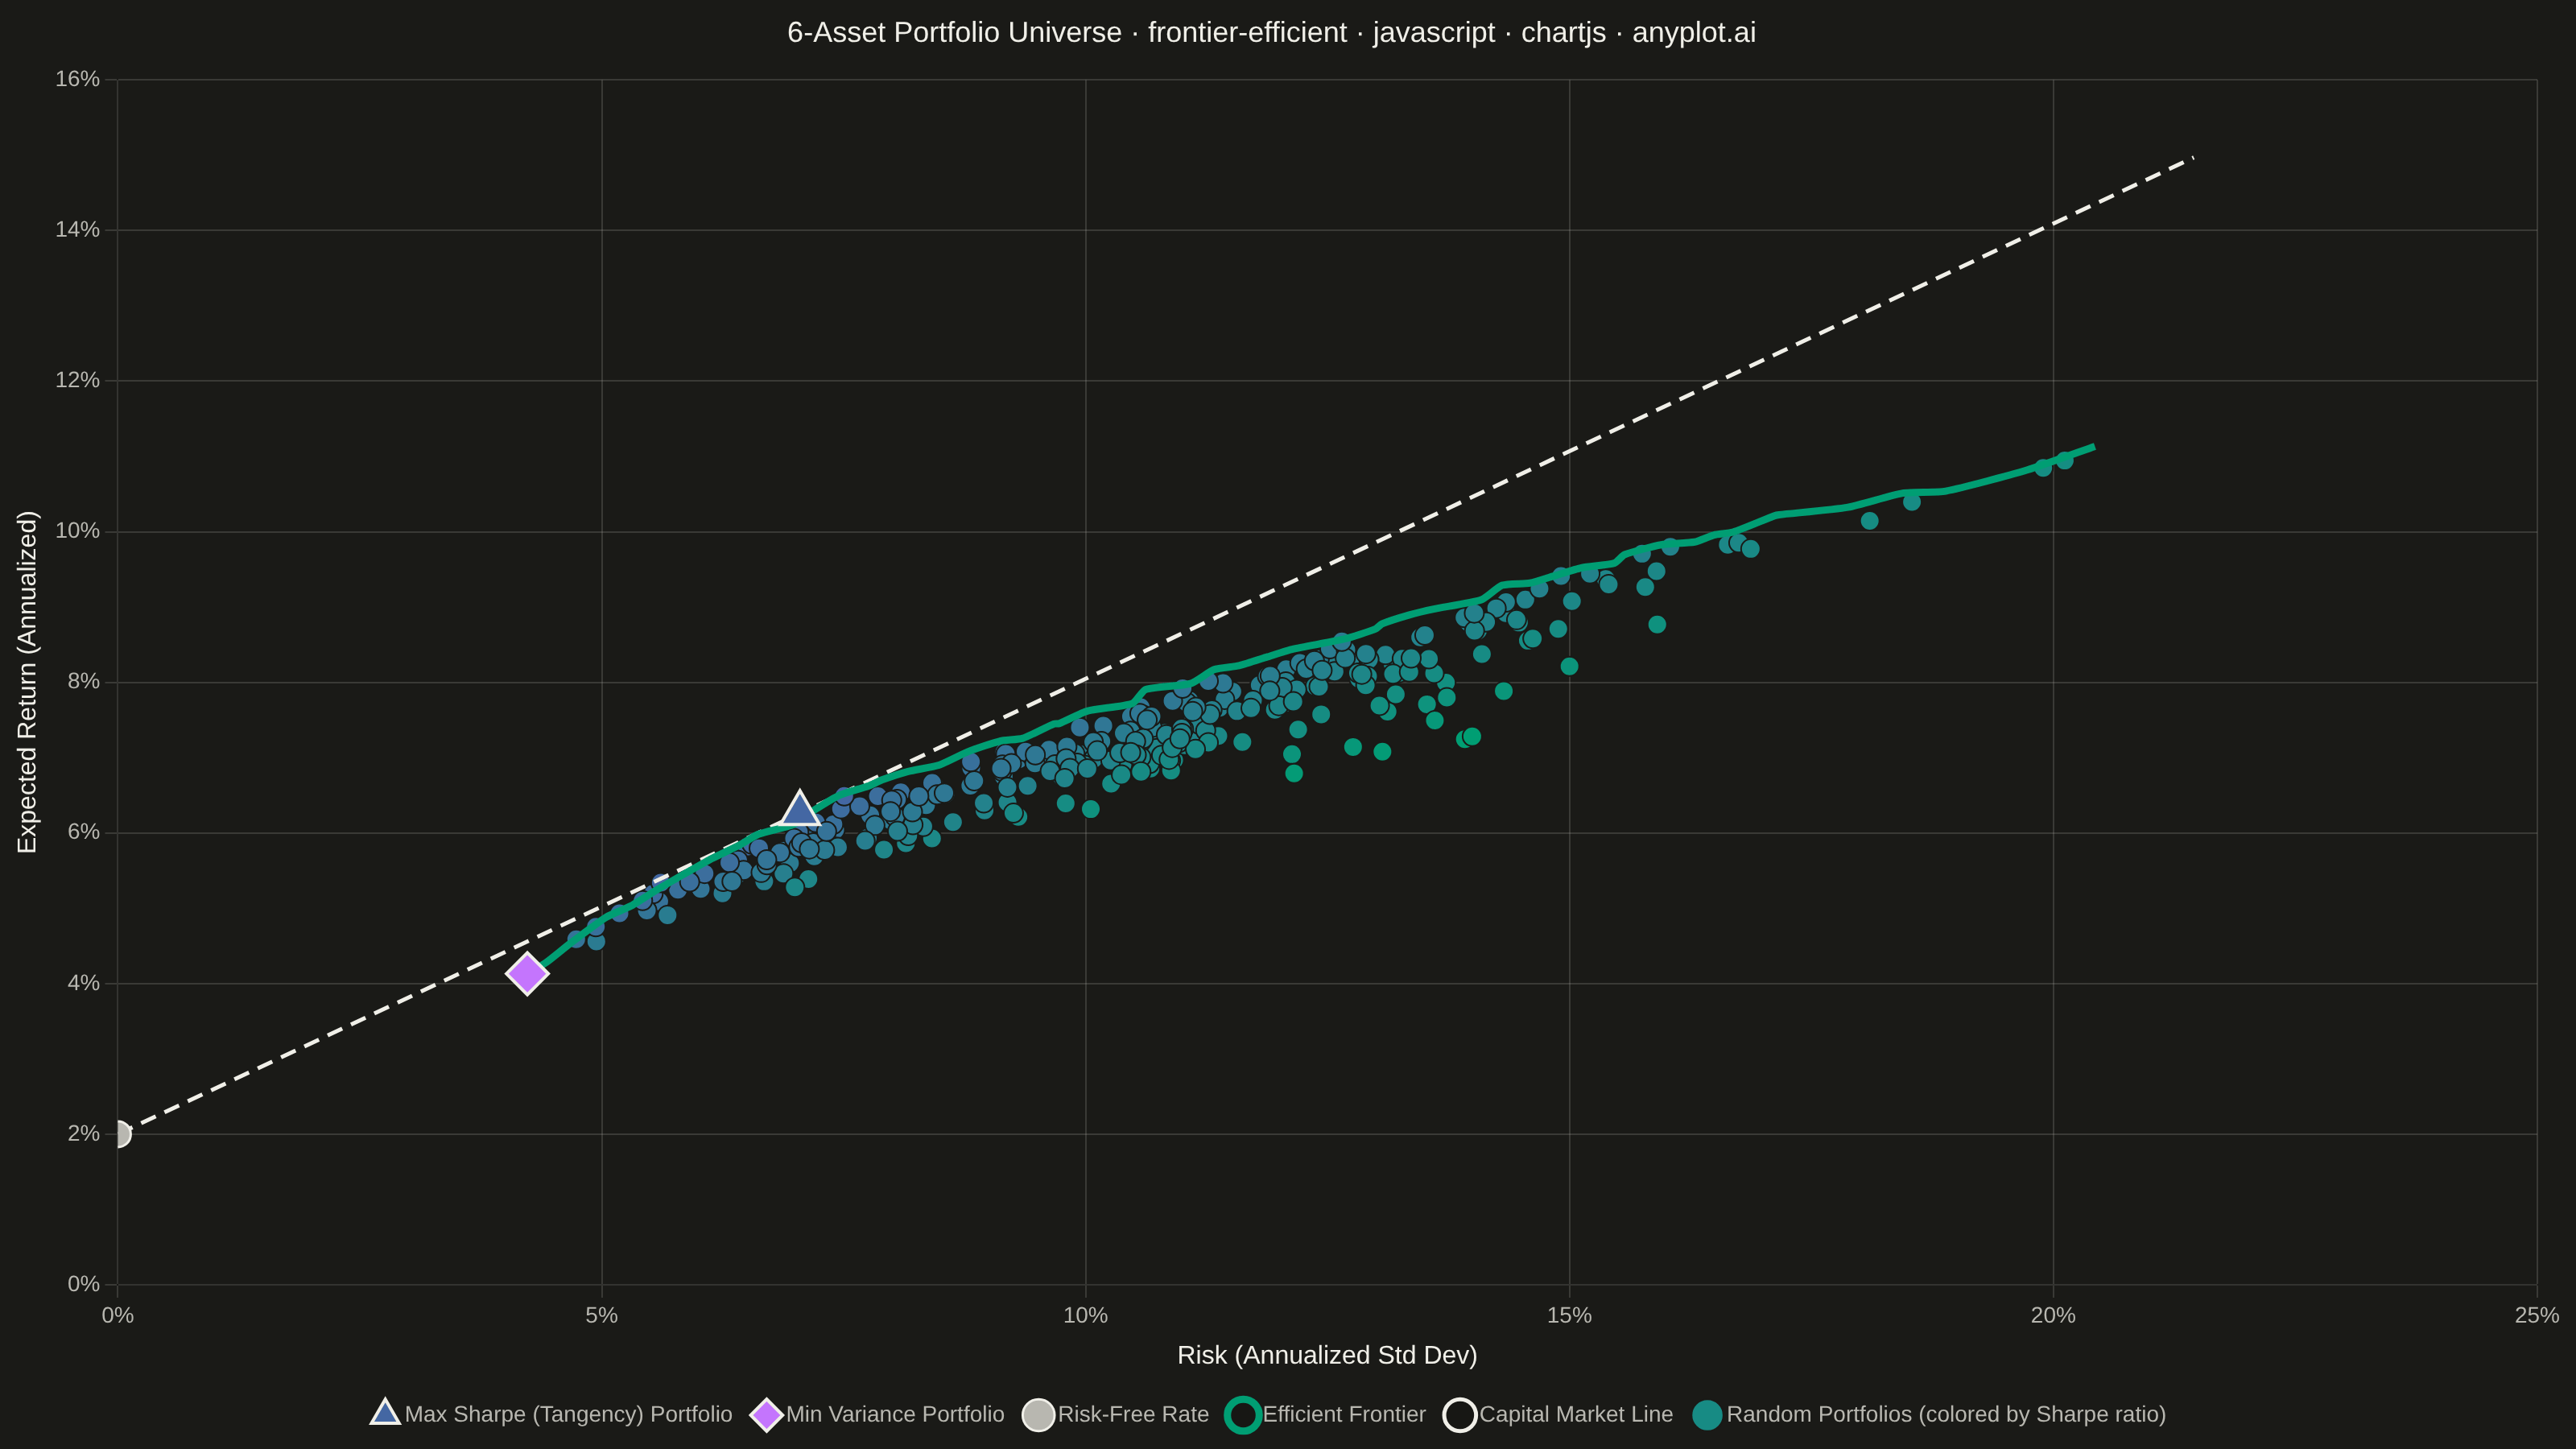
The efficient frontier is a fundamental visualization in Modern Portfolio Theory (MPT) that displays a curve of optimal portfolios offering the highest expected return for each level of risk (standard deviation). Portfolios on the frontier are "efficient" because no other portfolio exists with higher return for the same risk, or lower risk for the same return. This plot is essential for asset allocation decisions and understanding the risk-return tradeoff in investment portfolios.
// anyplot.ai
// frontier-efficient: Efficient Frontier for Portfolio Optimization
// Library: chartjs 4.4.7 | JavaScript 22.23.2
// Quality: 91/100 | Created: 2026-09-02

const t = window.ANYPLOT_TOKENS;

// --- Asset universe (in-memory, deterministic) ------------------------------
const ASSET_NAMES = ["Govt Bonds", "Corp Bonds", "REITs", "US Equity", "Intl Equity", "Emerging Mkts"];
const MU = [0.03, 0.045, 0.07, 0.09, 0.08, 0.12]; // annualized expected return
const VOL = [0.04, 0.06, 0.14, 0.16, 0.18, 0.24]; // annualized std dev
const CORR = [
  [1.0, 0.75, 0.1, 0.05, 0.0, -0.05],
  [0.75, 1.0, 0.2, 0.15, 0.1, 0.05],
  [0.1, 0.2, 1.0, 0.55, 0.45, 0.35],
  [0.05, 0.15, 0.55, 1.0, 0.7, 0.55],
  [0.0, 0.1, 0.45, 0.7, 1.0, 0.65],
  [-0.05, 0.05, 0.35, 0.55, 0.65, 1.0],
];
const N_ASSETS = ASSET_NAMES.length;
const COV = MU.map((_, i) => MU.map((__, j) => VOL[i] * VOL[j] * CORR[i][j]));
const RISK_FREE_RATE = 0.02;

// --- Deterministic PRNG (LCG) — Math.random() is not seedable in the browser
function makeLcg(seed) {
  let state = seed >>> 0;
  return () => {
    state = (1664525 * state + 1013904223) >>> 0;
    return (state >>> 8) / 16777216; // (0, 1)
  };
}

// Uniform sample from the N-simplex: normalize N exponential draws.
function samplePortfolioWeights(rng) {
  const draws = Array.from({ length: N_ASSETS }, () => -Math.log(1 - rng()));
  const total = draws.reduce((a, b) => a + b, 0);
  return draws.map((d) => d / total);
}

function portfolioStats(weights) {
  const ret = weights.reduce((sum, w, i) => sum + w * MU[i], 0);
  let variance = 0;
  for (let i = 0; i < N_ASSETS; i++) {
    for (let j = 0; j < N_ASSETS; j++) {
      variance += weights[i] * weights[j] * COV[i][j];
    }
  }
  const risk = Math.sqrt(variance);
  return { risk, return: ret, sharpe: (ret - RISK_FREE_RATE) / risk };
}

// --- Displayed scatter cloud (300 portfolios, within the spec's 50-500 range)
const displayRng = makeLcg(42);
const portfolios = Array.from({ length: 300 }, () => portfolioStats(samplePortfolioWeights(displayRng)));

// --- Frontier trace: a denser hidden simulation gives a smooth upper envelope
const frontierRng = makeLcg(1337);
const frontierSamples = Array.from({ length: 4000 }, () => portfolioStats(samplePortfolioWeights(frontierRng)));

const N_BINS = 60;
const risks = frontierSamples.map((p) => p.risk);
const minRisk = Math.min(...risks);
const maxRisk = Math.max(...risks);
const binWidth = (maxRisk - minRisk) / N_BINS;
const bins = new Array(N_BINS + 1).fill(null);
frontierSamples.forEach((p) => {
  const idx = Math.min(N_BINS, Math.floor((p.risk - minRisk) / binWidth));
  if (!bins[idx] || p.return > bins[idx].return) bins[idx] = p;
});
const efficientFrontier = [];
let runningMaxReturn = -Infinity;
bins.forEach((b) => {
  if (b && b.return > runningMaxReturn) {
    runningMaxReturn = b.return;
    efficientFrontier.push(b);
  }
});

const minVariancePortfolio = efficientFrontier[0];
const tangencyPortfolio = frontierSamples.reduce((best, p) => (p.sharpe > best.sharpe ? p : best));

// Capital market line: tangent from the risk-free rate through the tangency portfolio
const cmlMaxRisk = maxRisk * 1.05;
const capitalMarketLine = [
  { x: 0, y: RISK_FREE_RATE },
  { x: cmlMaxRisk, y: RISK_FREE_RATE + tangencyPortfolio.sharpe * cmlMaxRisk },
];

// --- Sharpe → color (imprint_seq gradient, continuous single-polarity data) --
function hexToRgb(hex) {
  const n = parseInt(hex.slice(1), 16);
  return [(n >> 16) & 255, (n >> 8) & 255, n & 255];
}
function lerpColor(hexLow, hexHigh, ratio) {
  const lo = hexToRgb(hexLow);
  const hi = hexToRgb(hexHigh);
  const mix = lo.map((c, i) => Math.round(c + (hi[i] - c) * ratio));
  return `rgb(${mix[0]}, ${mix[1]}, ${mix[2]})`;
}
const sharpeValues = portfolios.map((p) => p.sharpe);
const sharpeMin = Math.min(...sharpeValues);
const sharpeMax = Math.max(...sharpeValues);
const sharpeColors = sharpeValues.map((s) => lerpColor(t.seq[0], t.seq[1], (s - sharpeMin) / (sharpeMax - sharpeMin)));

// --- Mount -------------------------------------------------------------------
const canvas = document.createElement("canvas");
document.getElementById("container").appendChild(canvas);

// --- Title (scaled to length — see prompts/plot-generator.md) ---------------
const TITLE = "6-Asset Portfolio Universe · frontier-efficient · javascript · chartjs · anyplot.ai";
const TITLE_FONT_SIZE = Math.max(15, Math.round(22 * Math.min(1, 67 / TITLE.length)));

// --- Chart --------------------------------------------------------------------
new Chart(canvas, {
  type: "scatter",
  data: {
    datasets: [
      {
        label: "Random Portfolios (colored by Sharpe ratio)",
        data: portfolios.map((p) => ({ x: p.risk, y: p.return })),
        pointBackgroundColor: sharpeColors,
        pointBorderColor: t.pageBg,
        pointBorderWidth: 1,
        pointRadius: 6,
        pointHoverRadius: 6,
        showLine: false,
        order: 5,
      },
      {
        label: "Efficient Frontier",
        data: efficientFrontier.map((p) => ({ x: p.risk, y: p.return })),
        borderColor: t.palette[0],
        borderWidth: 4.5,
        pointRadius: 0,
        showLine: true,
        fill: false,
        tension: 0.2,
        order: 3,
      },
      {
        label: "Capital Market Line",
        data: capitalMarketLine,
        borderColor: t.ink,
        borderWidth: 2.5,
        borderDash: [10, 6],
        pointRadius: 0,
        showLine: true,
        fill: false,
        order: 4,
      },
      {
        label: "Min Variance Portfolio",
        data: [{ x: minVariancePortfolio.risk, y: minVariancePortfolio.return }],
        pointStyle: "rectRot",
        pointRadius: 13,
        pointBackgroundColor: t.palette[1],
        pointBorderColor: t.ink,
        pointBorderWidth: 2,
        showLine: false,
        order: 1,
      },
      {
        label: "Max Sharpe (Tangency) Portfolio",
        data: [{ x: tangencyPortfolio.risk, y: tangencyPortfolio.return }],
        pointStyle: "triangle",
        pointRadius: 14,
        pointBackgroundColor: t.palette[2],
        pointBorderColor: t.ink,
        pointBorderWidth: 2,
        showLine: false,
        order: 0,
      },
      {
        label: "Risk-Free Rate",
        data: [{ x: 0, y: RISK_FREE_RATE }],
        pointStyle: "circle",
        pointRadius: 8,
        pointBackgroundColor: t.inkSoft,
        pointBorderColor: t.ink,
        pointBorderWidth: 1.5,
        showLine: false,
        order: 2,
      },
    ],
  },
  options: {
    responsive: true,
    maintainAspectRatio: false,
    animation: false,
    layout: { padding: { top: 10, right: 24, bottom: 4, left: 4 } },
    plugins: {
      title: {
        display: true,
        text: TITLE,
        color: t.ink,
        font: { size: TITLE_FONT_SIZE, weight: "500" },
        padding: { bottom: 18 },
      },
      legend: {
        position: "bottom",
        labels: { color: t.inkSoft, font: { size: 14 }, usePointStyle: true, boxWidth: 10, padding: 16 },
      },
    },
    scales: {
      x: {
        min: 0,
        title: { display: true, text: "Risk (Annualized Std Dev)", color: t.ink, font: { size: 16 } },
        ticks: {
          color: t.inkSoft,
          font: { size: 14 },
          callback: (value) => `${Math.round(value * 100)}%`,
        },
        grid: { color: t.grid },
      },
      y: {
        min: 0,
        title: { display: true, text: "Expected Return (Annualized)", color: t.ink, font: { size: 16 } },
        ticks: {
          color: t.inkSoft,
          font: { size: 14 },
          callback: (value) => `${Math.round(value * 100)}%`,
        },
        grid: { color: t.grid },
      },
    },
  },
});
Runnable source as JSON, for any HTTP client: https://api.anyplot.ai/specs/frontier-efficient/chartjs/code. Any spec id and library id listed in llms-full.txt fit the same URL shape; every URL below is complete and callable.
{
  "spec_id": "frontier-efficient",
  "language": "javascript",
  "library": "chartjs",
  "page": "https://anyplot.ai/frontier-efficient/javascript/chartjs",
  "hub": "https://anyplot.ai/frontier-efficient",
  "code_json": "https://api.anyplot.ai/specs/frontier-efficient/chartjs/code",
  "spec_json": "https://api.anyplot.ai/specs/frontier-efficient",
  "render_light_png": "https://storage.googleapis.com/anyplot-images/plots/frontier-efficient/javascript/chartjs/plot-light.png",
  "render_dark_png": "https://storage.googleapis.com/anyplot-images/plots/frontier-efficient/javascript/chartjs/plot-dark.png",
  "interactive_light_html": "https://storage.googleapis.com/anyplot-images/plots/frontier-efficient/javascript/chartjs/plot-light.html",
  "interactive_dark_html": "https://storage.googleapis.com/anyplot-images/plots/frontier-efficient/javascript/chartjs/plot-dark.html",
  "quality_score": 91.0,
  "license": "MIT",
  "guide": "https://anyplot.ai/llms.txt"
}
Part of Efficient Frontier for Portfolio Optimization on anyplot.ai.