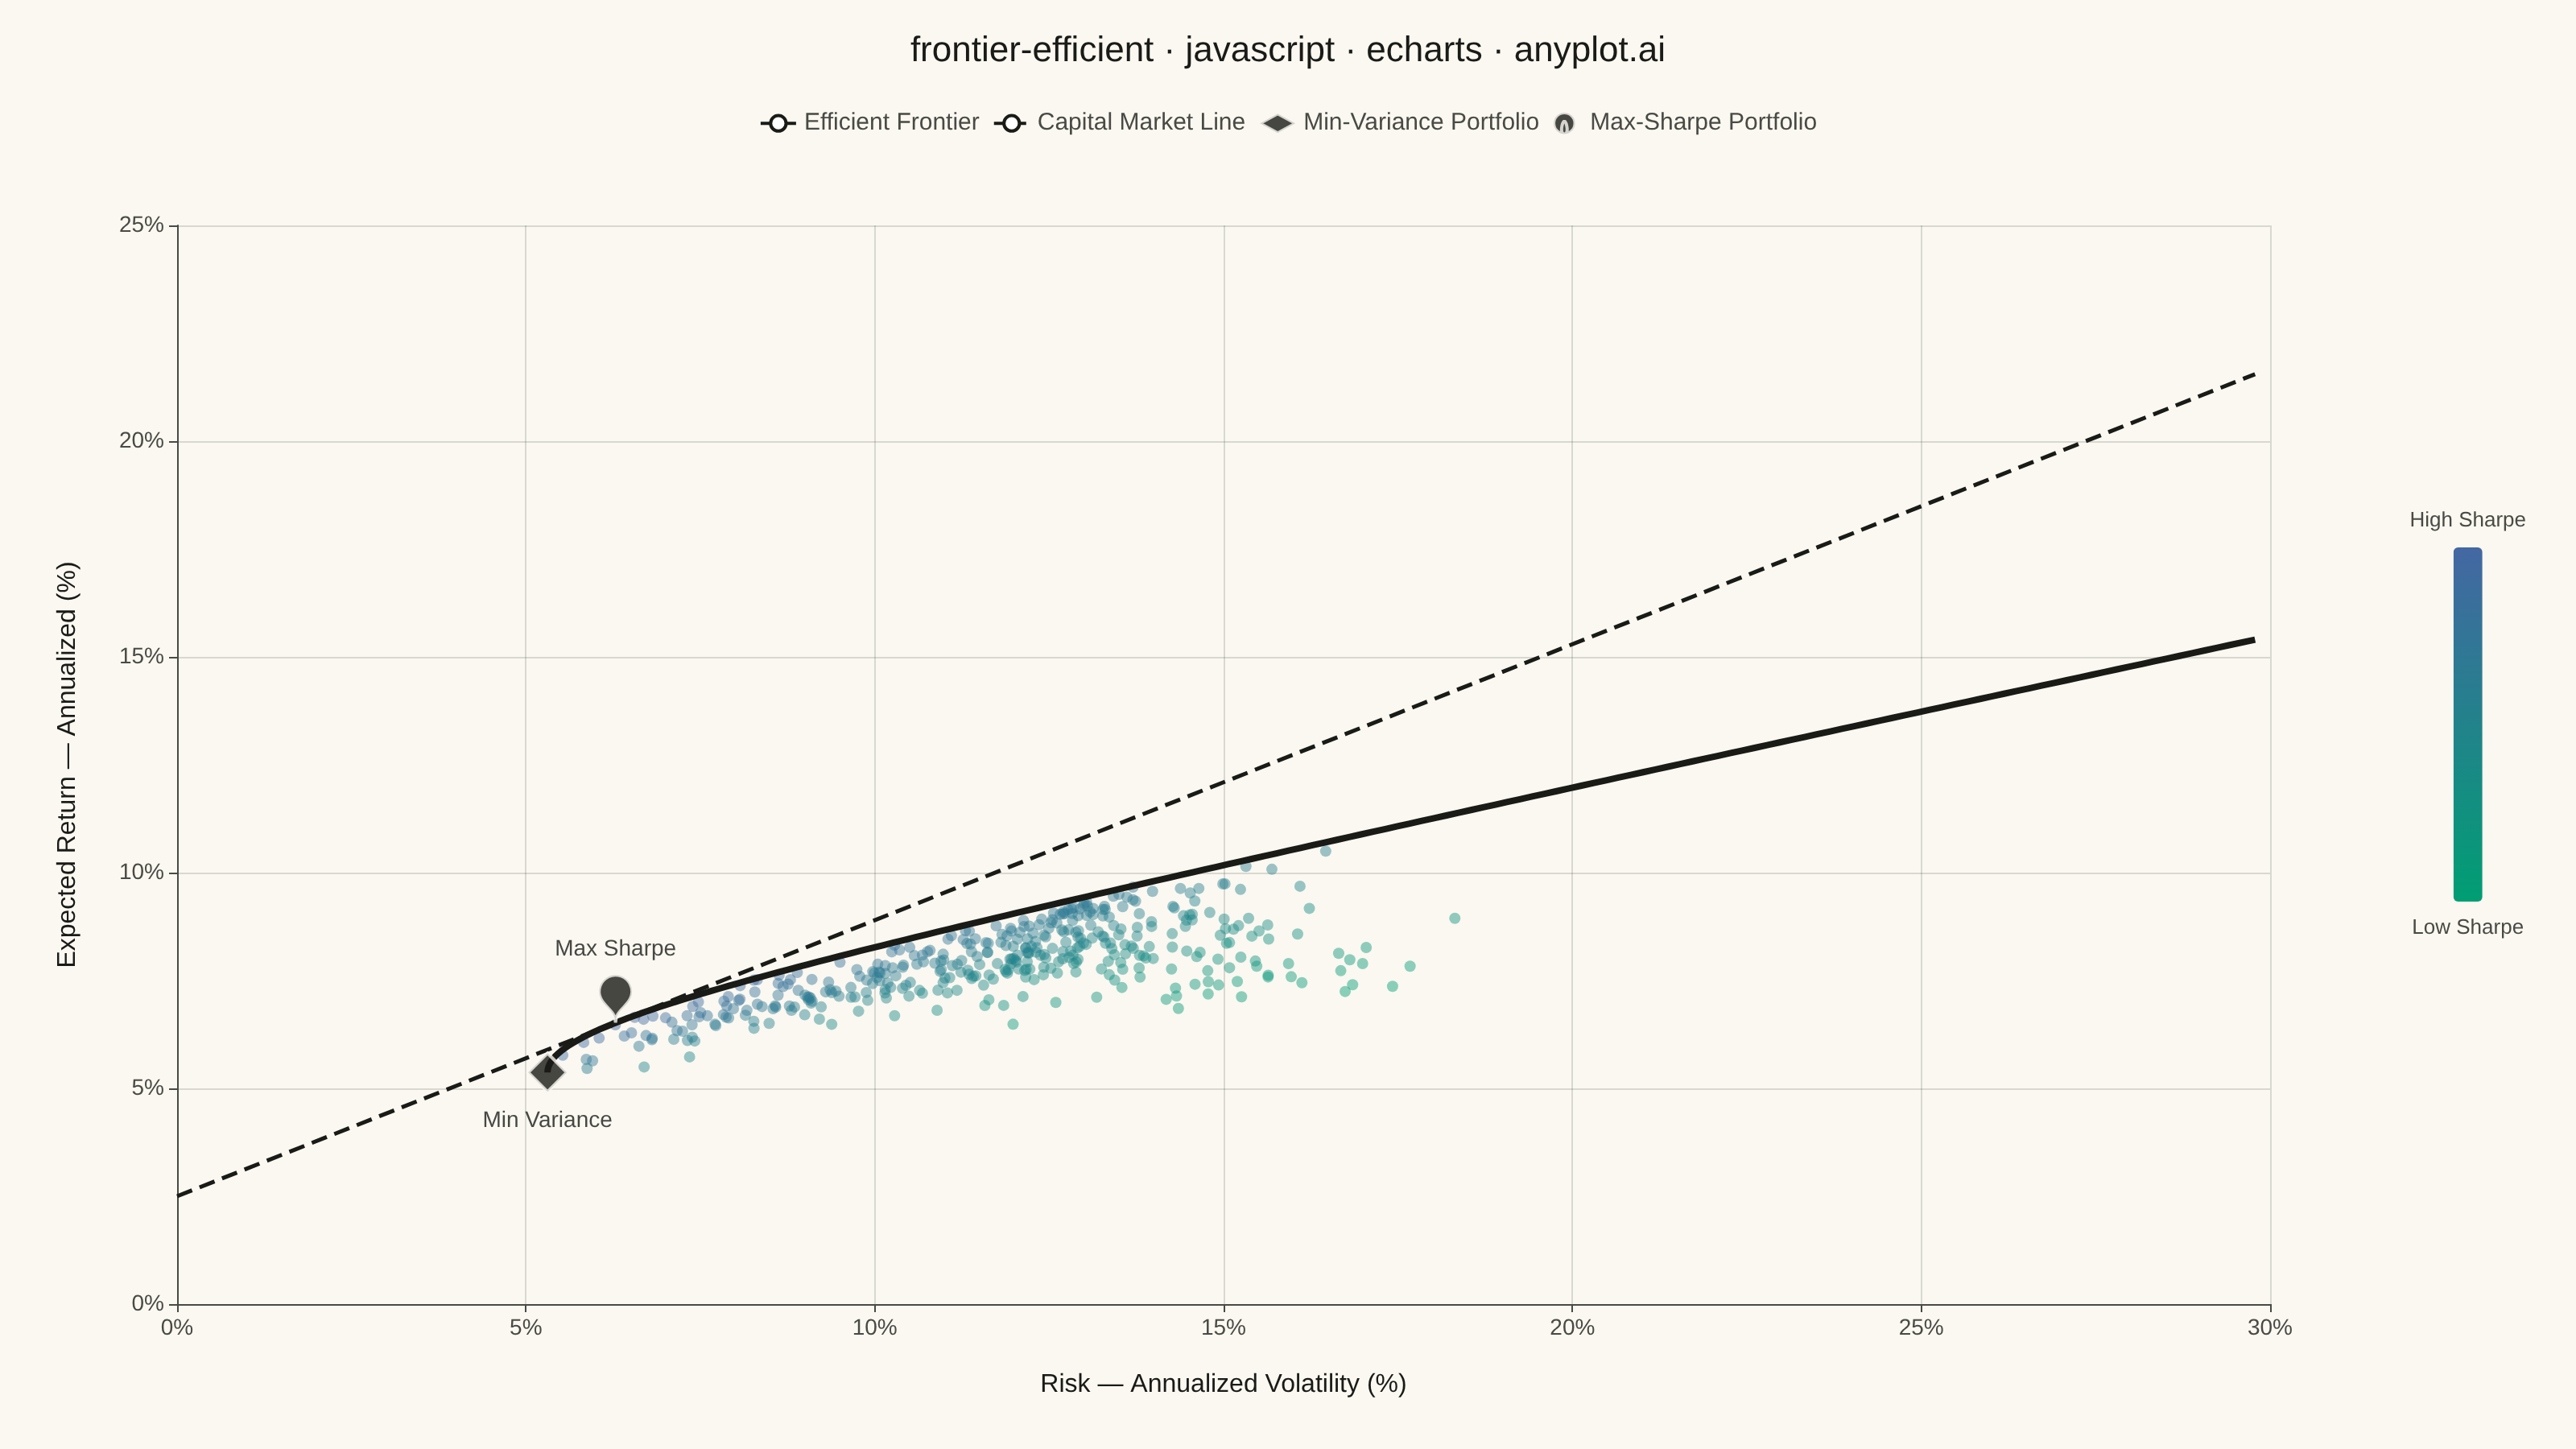
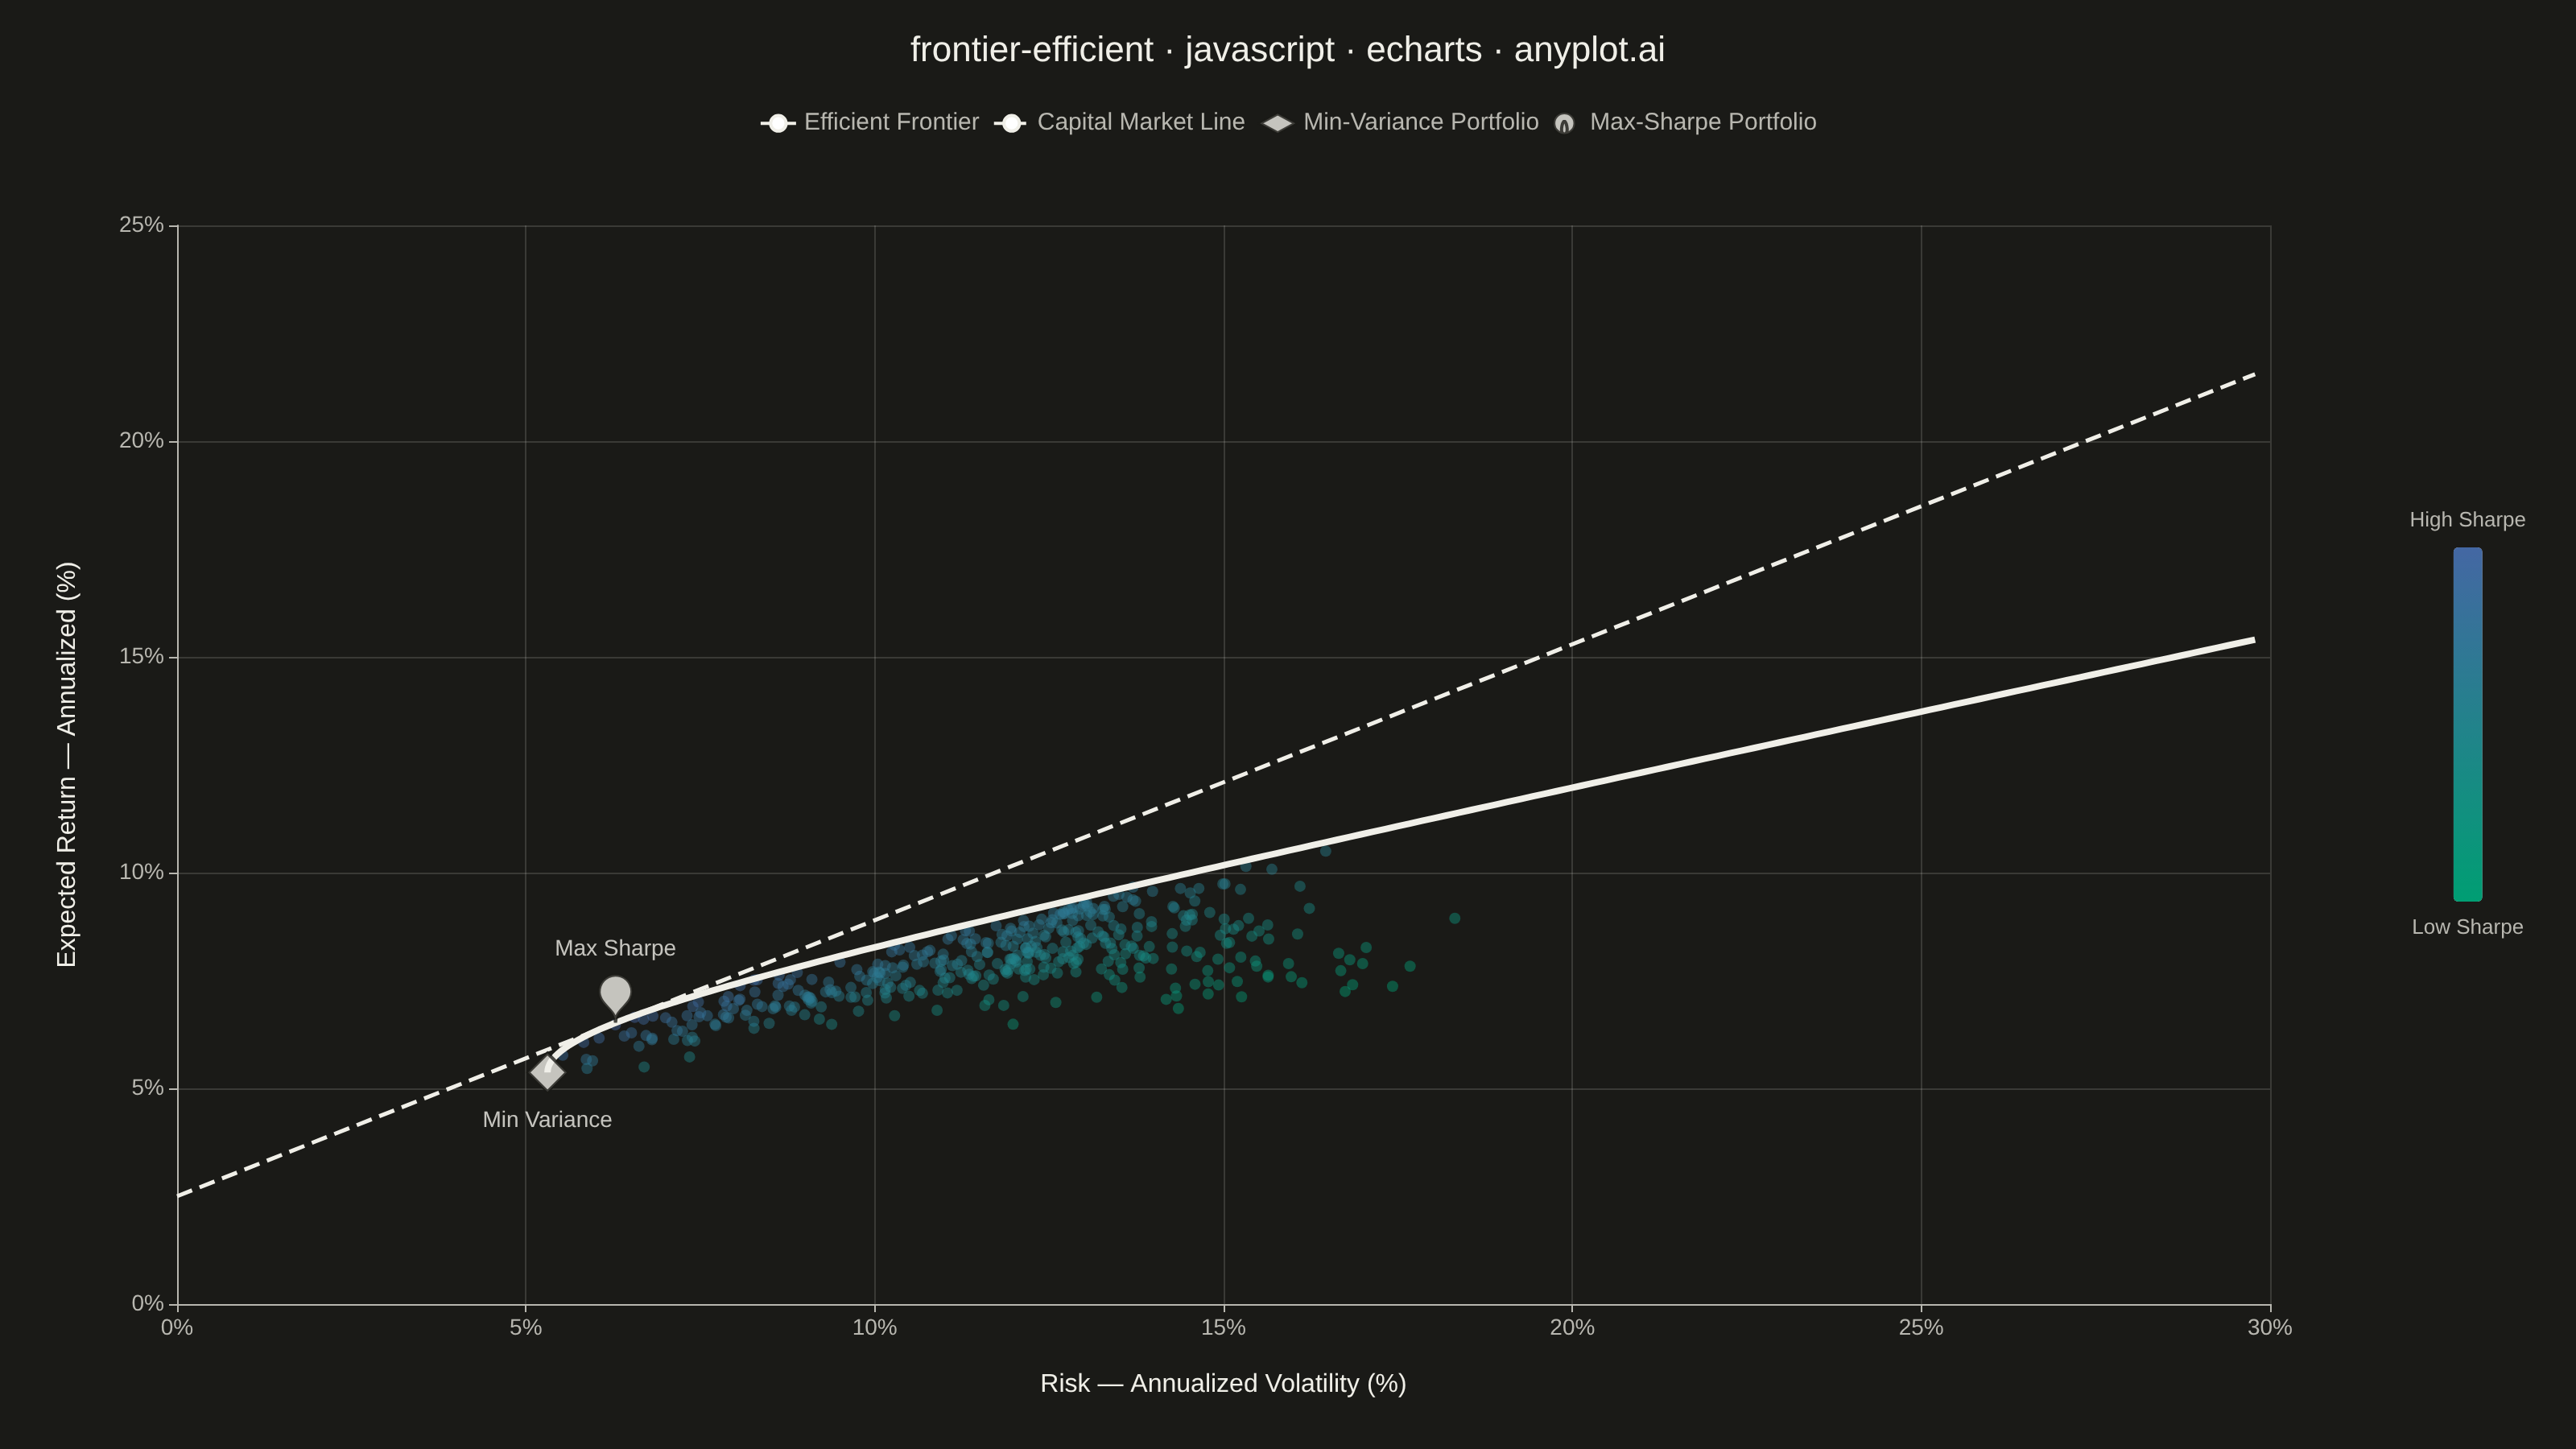
The same plot in 14 other libraries — JavaScript: Chart.js, D3.js, Highcharts, MUI X Charts; Python: Altair, Bokeh, lets-plot, Matplotlib, Plotly, plotnine, Pygal, Seaborn; R: ggplot2; Julia: Makie.jl. Compare all 15 side by side: Efficient Frontier for Portfolio Optimization in Python, R, Julia and JavaScript.
The efficient frontier is a fundamental visualization in Modern Portfolio Theory (MPT) that displays a curve of optimal portfolios offering the highest expected return for each level of risk (standard deviation). Portfolios on the frontier are "efficient" because no other portfolio exists with higher return for the same risk, or lower risk for the same return. This plot is essential for asset allocation decisions and understanding the risk-return tradeoff in investment portfolios.
// anyplot.ai
// frontier-efficient: Efficient Frontier for Portfolio Optimization
// Library: echarts 6.1.0 | JavaScript 22.23.2
// Quality: 93/100 | Created: 2026-09-02

//# anyplot-orientation: landscape
const t = window.ANYPLOT_TOKENS;

// --- Data: a 5-asset universe (annualized mean return / volatility) ---------
const assetNames = [
  "US Equities",
  "Intl Equities",
  "Real Estate",
  "Corp Bonds",
  "Commodities",
];
const mu = [0.11, 0.09, 0.08, 0.045, 0.07];
const vol = [0.18, 0.2, 0.16, 0.06, 0.24];
const corr = [
  [1.0, 0.65, 0.35, -0.1, 0.15],
  [0.65, 1.0, 0.3, -0.05, 0.2],
  [0.35, 0.3, 1.0, 0.05, 0.1],
  [-0.1, -0.05, 0.05, 1.0, -0.05],
  [0.15, 0.2, 0.1, -0.05, 1.0],
];
const nAssets = mu.length;
const cov = corr.map((row, i) => row.map((c, j) => c * vol[i] * vol[j]));
const riskFreeRate = 0.025;

// --- Small linear-algebra helpers (Gauss-Jordan inverse, matrix/vector ops) --
function invertMatrix(matrix) {
  const n = matrix.length;
  const aug = matrix.map((row, i) => [
    ...row,
    ...Array.from({ length: n }, (_, j) => (i === j ? 1 : 0)),
  ]);
  for (let col = 0; col < n; col++) {
    let pivotRow = col;
    for (let r = col + 1; r < n; r++) {
      if (Math.abs(aug[r][col]) > Math.abs(aug[pivotRow][col])) pivotRow = r;
    }
    [aug[col], aug[pivotRow]] = [aug[pivotRow], aug[col]];
    const pivot = aug[col][col];
    for (let j = 0; j < 2 * n; j++) aug[col][j] /= pivot;
    for (let r = 0; r < n; r++) {
      if (r === col) continue;
      const factor = aug[r][col];
      for (let j = 0; j < 2 * n; j++) aug[r][j] -= factor * aug[col][j];
    }
  }
  return aug.map((row) => row.slice(n));
}
const matVec = (m, v) => m.map((row) => row.reduce((s, x, j) => s + x * v[j], 0));
const dot = (a, b) => a.reduce((s, x, i) => s + x * b[i], 0);

// --- Mean-variance frontier (closed-form Merton solution) -------------------
const invCov = invertMatrix(cov);
const ones = mu.map(() => 1);
const invCovOnes = matVec(invCov, ones);
const invCovMu = matVec(invCov, mu);
const scalarA = dot(ones, invCovOnes);
const scalarB = dot(ones, invCovMu);
const scalarC = dot(mu, invCovMu);
const scalarD = scalarA * scalarC - scalarB * scalarB;

const minVarReturn = scalarB / scalarA;
const minVarRisk = Math.sqrt(1 / scalarA);

const frontierReturnMax = Math.max(...mu) * 1.4;
const frontierPoints = [];
const frontierSteps = 80;
for (let i = 0; i <= frontierSteps; i++) {
  const r = minVarReturn + ((frontierReturnMax - minVarReturn) * i) / frontierSteps;
  const variance = (scalarA * r * r - 2 * scalarB * r + scalarC) / scalarD;
  const risk = Math.sqrt(Math.max(variance, 0));
  frontierPoints.push([risk * 100, r * 100]);
}

// Tangency (max Sharpe ratio) portfolio.
const excessInvCov = matVec(invCov, mu.map((m) => m - riskFreeRate));
const excessSum = excessInvCov.reduce((s, x) => s + x, 0);
const tangencyWeights = excessInvCov.map((x) => x / excessSum);
const tangencyReturn = dot(tangencyWeights, mu);
const tangencyRisk = Math.sqrt(dot(tangencyWeights, matVec(cov, tangencyWeights)));

const cmlSlope = (tangencyReturn - riskFreeRate) / tangencyRisk;
const cmlMaxRisk = frontierPoints[frontierPoints.length - 1][0] / 100;
const capitalMarketLine = [
  [0, riskFreeRate * 100],
  [cmlMaxRisk * 100, (riskFreeRate + cmlSlope * cmlMaxRisk) * 100],
];

// --- Random long-only portfolios (uniform over the 5-asset simplex) --------
function makeLcg(seed) {
  let state = seed >>> 0;
  return () => {
    state = (1103515245 * state + 12345) >>> 0;
    return state / 4294967296;
  };
}
const rand = makeLcg(42);
const portfolioCount = 400;
const randomPortfolios = [];
for (let p = 0; p < portfolioCount; p++) {
  const draws = Array.from({ length: nAssets }, () => -Math.log(Math.max(rand(), 1e-9)));
  const drawSum = draws.reduce((s, x) => s + x, 0);
  const weights = draws.map((x) => x / drawSum);
  const portfolioReturn = dot(weights, mu);
  const portfolioRisk = Math.sqrt(dot(weights, matVec(cov, weights)));
  const sharpe = (portfolioReturn - riskFreeRate) / portfolioRisk;
  randomPortfolios.push([portfolioRisk * 100, portfolioReturn * 100, sharpe]);
}
const sharpeValues = randomPortfolios.map((d) => d[2]);
const sharpeMin = Math.min(...sharpeValues);
const sharpeMax = Math.max(...sharpeValues);

// --- Init ---------------------------------------------------------------------
const chart = echarts.init(document.getElementById("container"));

// --- Option ---------------------------------------------------------------------
chart.setOption({
  animation: false,
  backgroundColor: "transparent",
  title: {
    text: "frontier-efficient · javascript · echarts · anyplot.ai",
    left: "center",
    top: 16,
    textStyle: { color: t.ink, fontSize: 22, fontWeight: 500 },
  },
  legend: {
    data: [
      "Efficient Frontier",
      "Capital Market Line",
      "Min-Variance Portfolio",
      "Max-Sharpe Portfolio",
    ],
    top: 64,
    textStyle: { color: t.inkSoft, fontSize: 15 },
    itemWidth: 22,
    itemHeight: 12,
  },
  grid: { left: 110, right: 190, top: 140, bottom: 90 },
  xAxis: {
    type: "value",
    name: "Risk — Annualized Volatility (%)",
    nameLocation: "middle",
    nameGap: 42,
    min: 0,
    nameTextStyle: { color: t.ink, fontSize: 16 },
    axisLabel: { color: t.inkSoft, fontSize: 14, formatter: "{value}%" },
    axisLine: { lineStyle: { color: t.inkSoft } },
    splitLine: { lineStyle: { color: t.grid } },
  },
  yAxis: {
    type: "value",
    name: "Expected Return — Annualized (%)",
    nameLocation: "middle",
    nameGap: 60,
    nameTextStyle: { color: t.ink, fontSize: 16 },
    axisLabel: { color: t.inkSoft, fontSize: 14, formatter: "{value}%" },
    axisLine: { lineStyle: { color: t.inkSoft } },
    splitLine: { lineStyle: { color: t.grid } },
  },
  visualMap: {
    type: "continuous",
    seriesIndex: 0,
    dimension: 2,
    min: sharpeMin,
    max: sharpeMax,
    orient: "vertical",
    right: 16,
    top: "middle",
    itemWidth: 18,
    itemHeight: 220,
    text: ["High Sharpe", "Low Sharpe"],
    textStyle: { color: t.inkSoft, fontSize: 13 },
    inRange: { color: t.seq },
  },
  tooltip: {
    trigger: "item",
    formatter: (p) =>
      Array.isArray(p.value) && p.value.length >= 3
        ? `Risk: ${p.value[0].toFixed(1)}%<br/>Return: ${p.value[1].toFixed(1)}%<br/>Sharpe: ${p.value[2].toFixed(2)}`
        : `${p.seriesName}<br/>Risk: ${p.value[0].toFixed(1)}%<br/>Return: ${p.value[1].toFixed(1)}%`,
  },
  series: [
    {
      name: "Random Portfolios",
      type: "scatter",
      data: randomPortfolios,
      symbolSize: 7,
      itemStyle: { opacity: 0.45 },
    },
    {
      name: "Efficient Frontier",
      type: "line",
      data: frontierPoints,
      showSymbol: false,
      smooth: true,
      lineStyle: { color: t.ink, width: 4 },
      itemStyle: { color: t.ink },
      z: 3,
    },
    {
      name: "Capital Market Line",
      type: "line",
      data: capitalMarketLine,
      showSymbol: false,
      lineStyle: { color: t.ink, width: 2.5, type: "dashed" },
      itemStyle: { color: t.ink },
      z: 2,
    },
    {
      name: "Min-Variance Portfolio",
      type: "scatter",
      data: [[minVarRisk * 100, minVarReturn * 100]],
      symbol: "diamond",
      symbolSize: 24,
      itemStyle: { color: t.ink, borderColor: t.pageBg, borderWidth: 2 },
      label: {
        show: true,
        formatter: "Min Variance",
        position: "bottom",
        distance: 10,
        color: t.ink,
        fontSize: 14,
      },
      z: 4,
    },
    {
      name: "Max-Sharpe Portfolio",
      type: "scatter",
      data: [[tangencyRisk * 100, tangencyReturn * 100]],
      symbol: "pin",
      symbolSize: 34,
      itemStyle: { color: t.ink, borderColor: t.pageBg, borderWidth: 2 },
      label: {
        show: true,
        formatter: "Max Sharpe",
        position: "top",
        distance: 8,
        color: t.ink,
        fontSize: 14,
      },
      z: 4,
    },
  ],
});
Runnable source as JSON, for any HTTP client: https://api.anyplot.ai/specs/frontier-efficient/echarts/code. Any spec id and library id listed in llms-full.txt fit the same URL shape; every URL below is complete and callable.
{
  "spec_id": "frontier-efficient",
  "language": "javascript",
  "library": "echarts",
  "page": "https://anyplot.ai/frontier-efficient/javascript/echarts",
  "hub": "https://anyplot.ai/frontier-efficient",
  "code_json": "https://api.anyplot.ai/specs/frontier-efficient/echarts/code",
  "spec_json": "https://api.anyplot.ai/specs/frontier-efficient",
  "render_light_png": "https://storage.googleapis.com/anyplot-images/plots/frontier-efficient/javascript/echarts/plot-light.png",
  "render_dark_png": "https://storage.googleapis.com/anyplot-images/plots/frontier-efficient/javascript/echarts/plot-dark.png",
  "interactive_light_html": "https://storage.googleapis.com/anyplot-images/plots/frontier-efficient/javascript/echarts/plot-light.html",
  "interactive_dark_html": "https://storage.googleapis.com/anyplot-images/plots/frontier-efficient/javascript/echarts/plot-dark.html",
  "quality_score": 93.0,
  "license": "MIT",
  "guide": "https://anyplot.ai/llms.txt"
}
Part of Efficient Frontier for Portfolio Optimization on anyplot.ai.