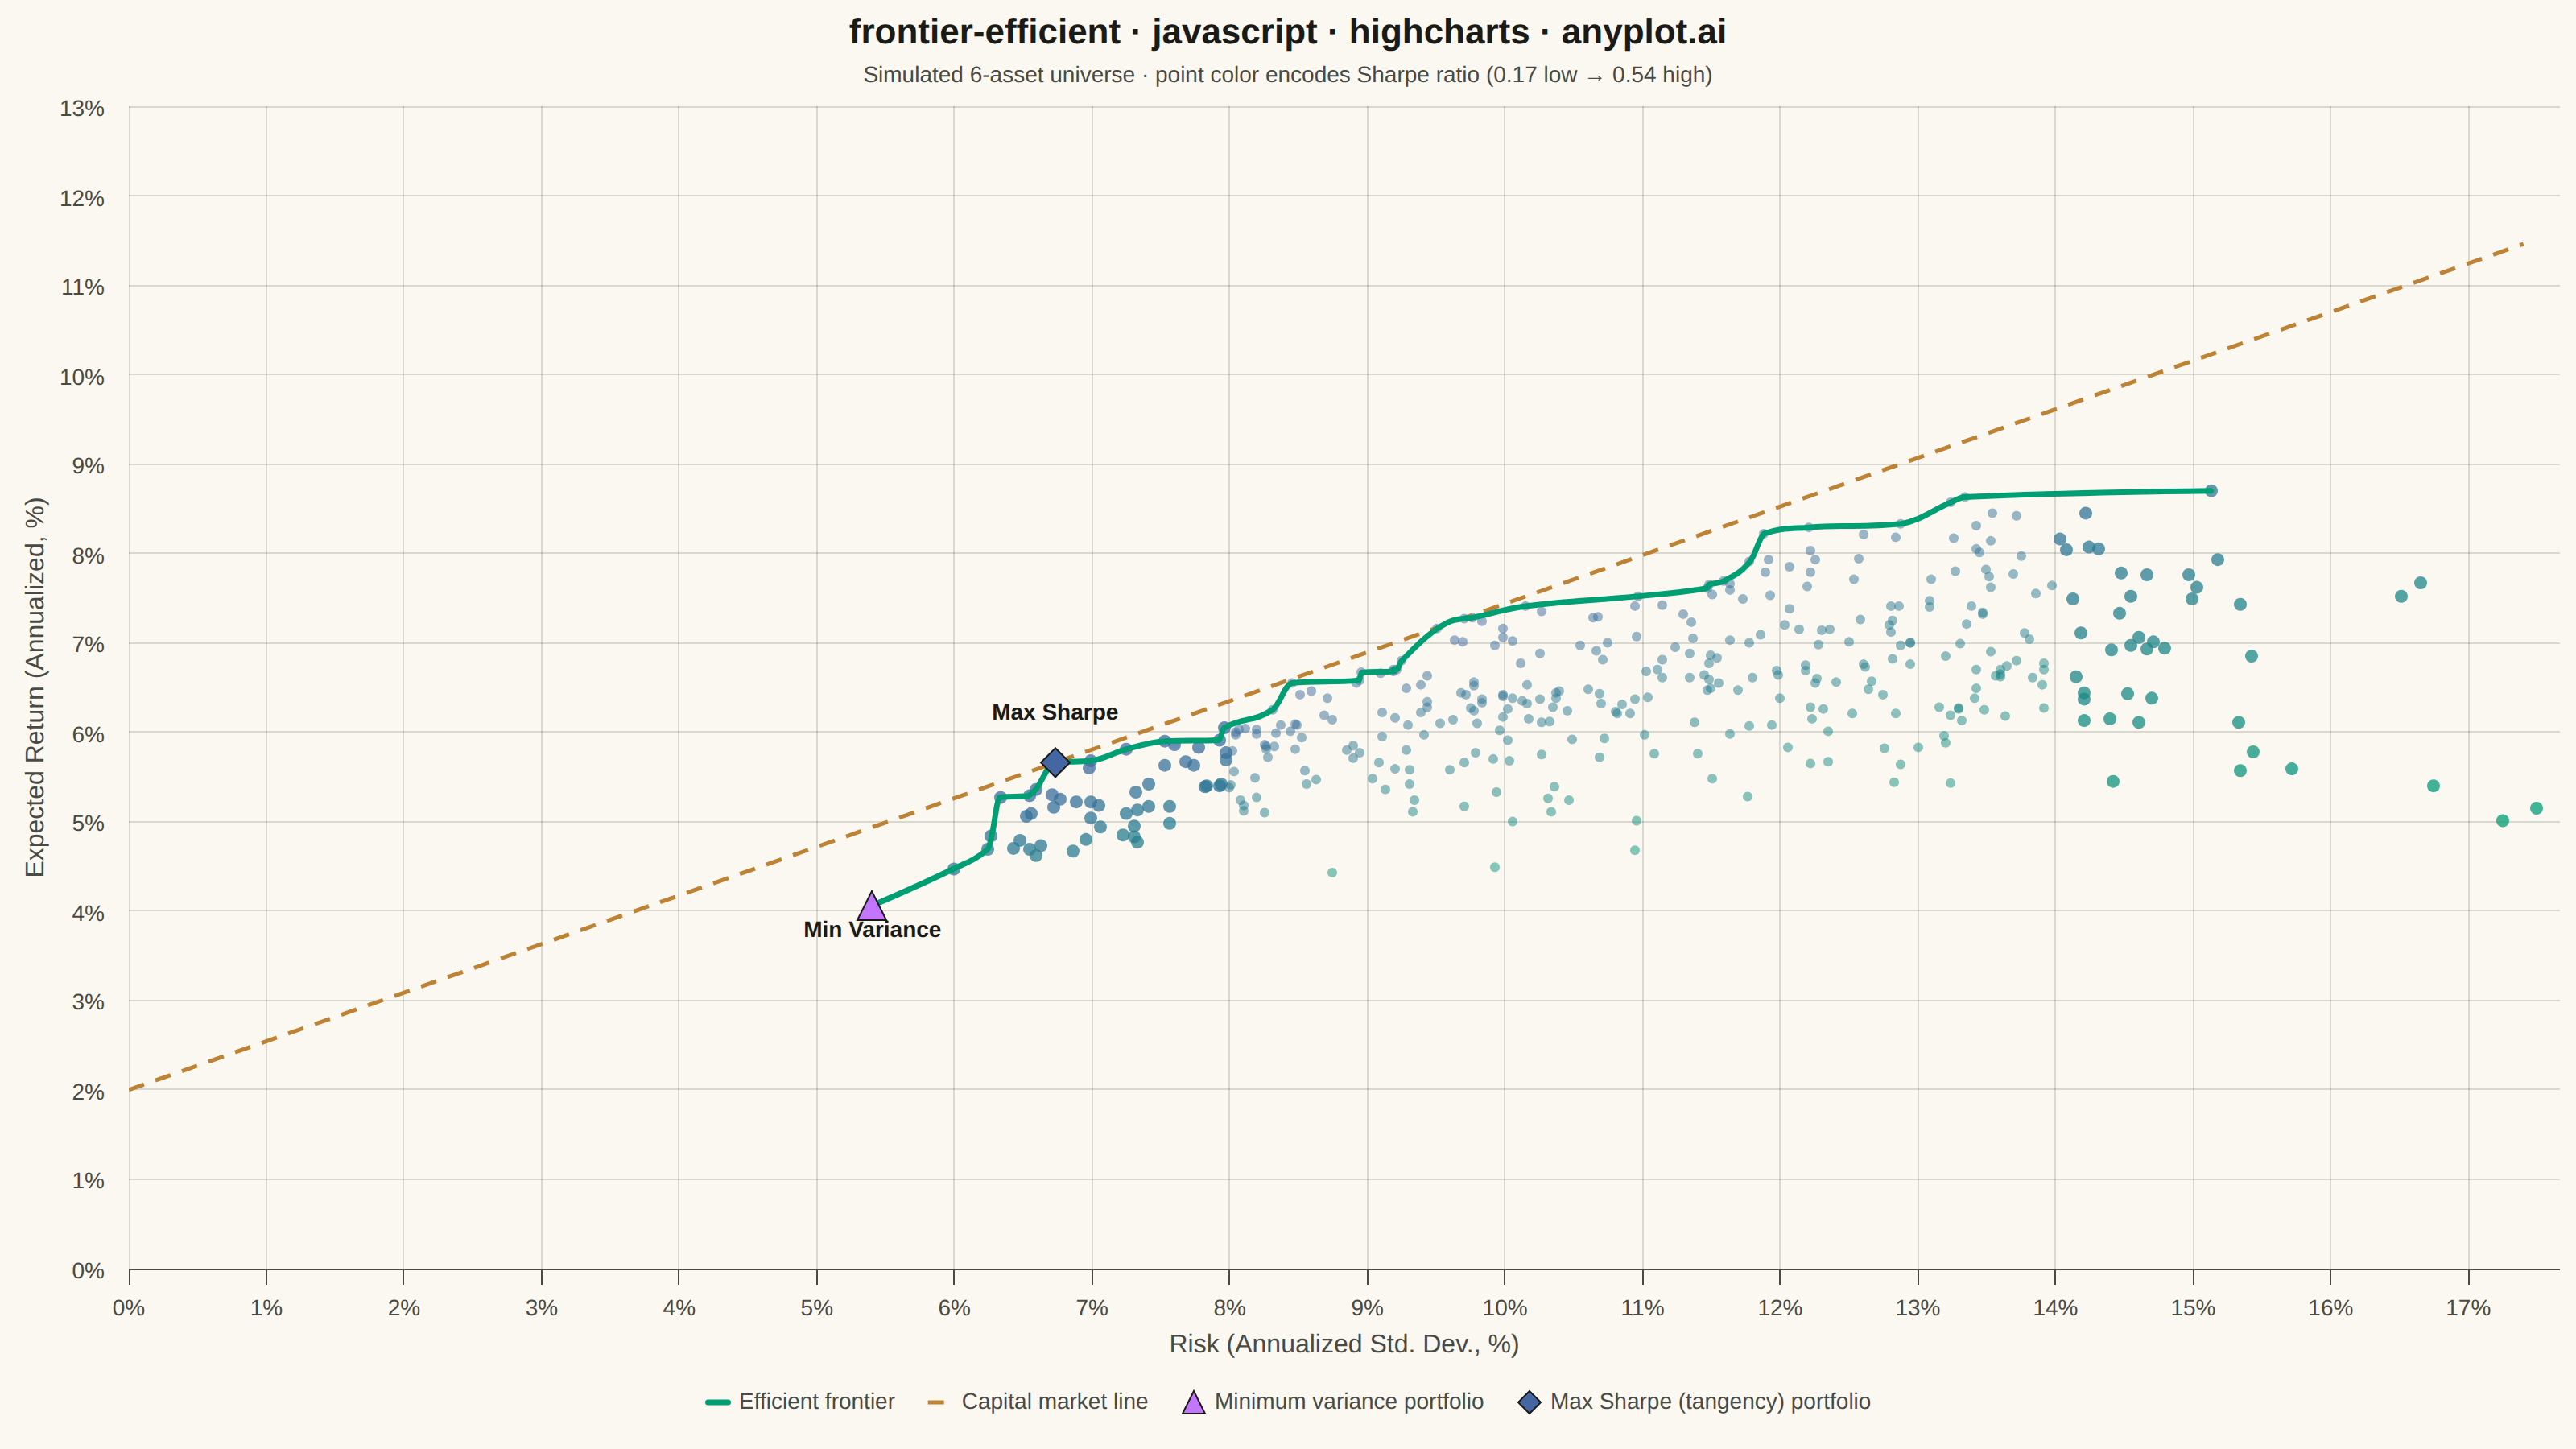
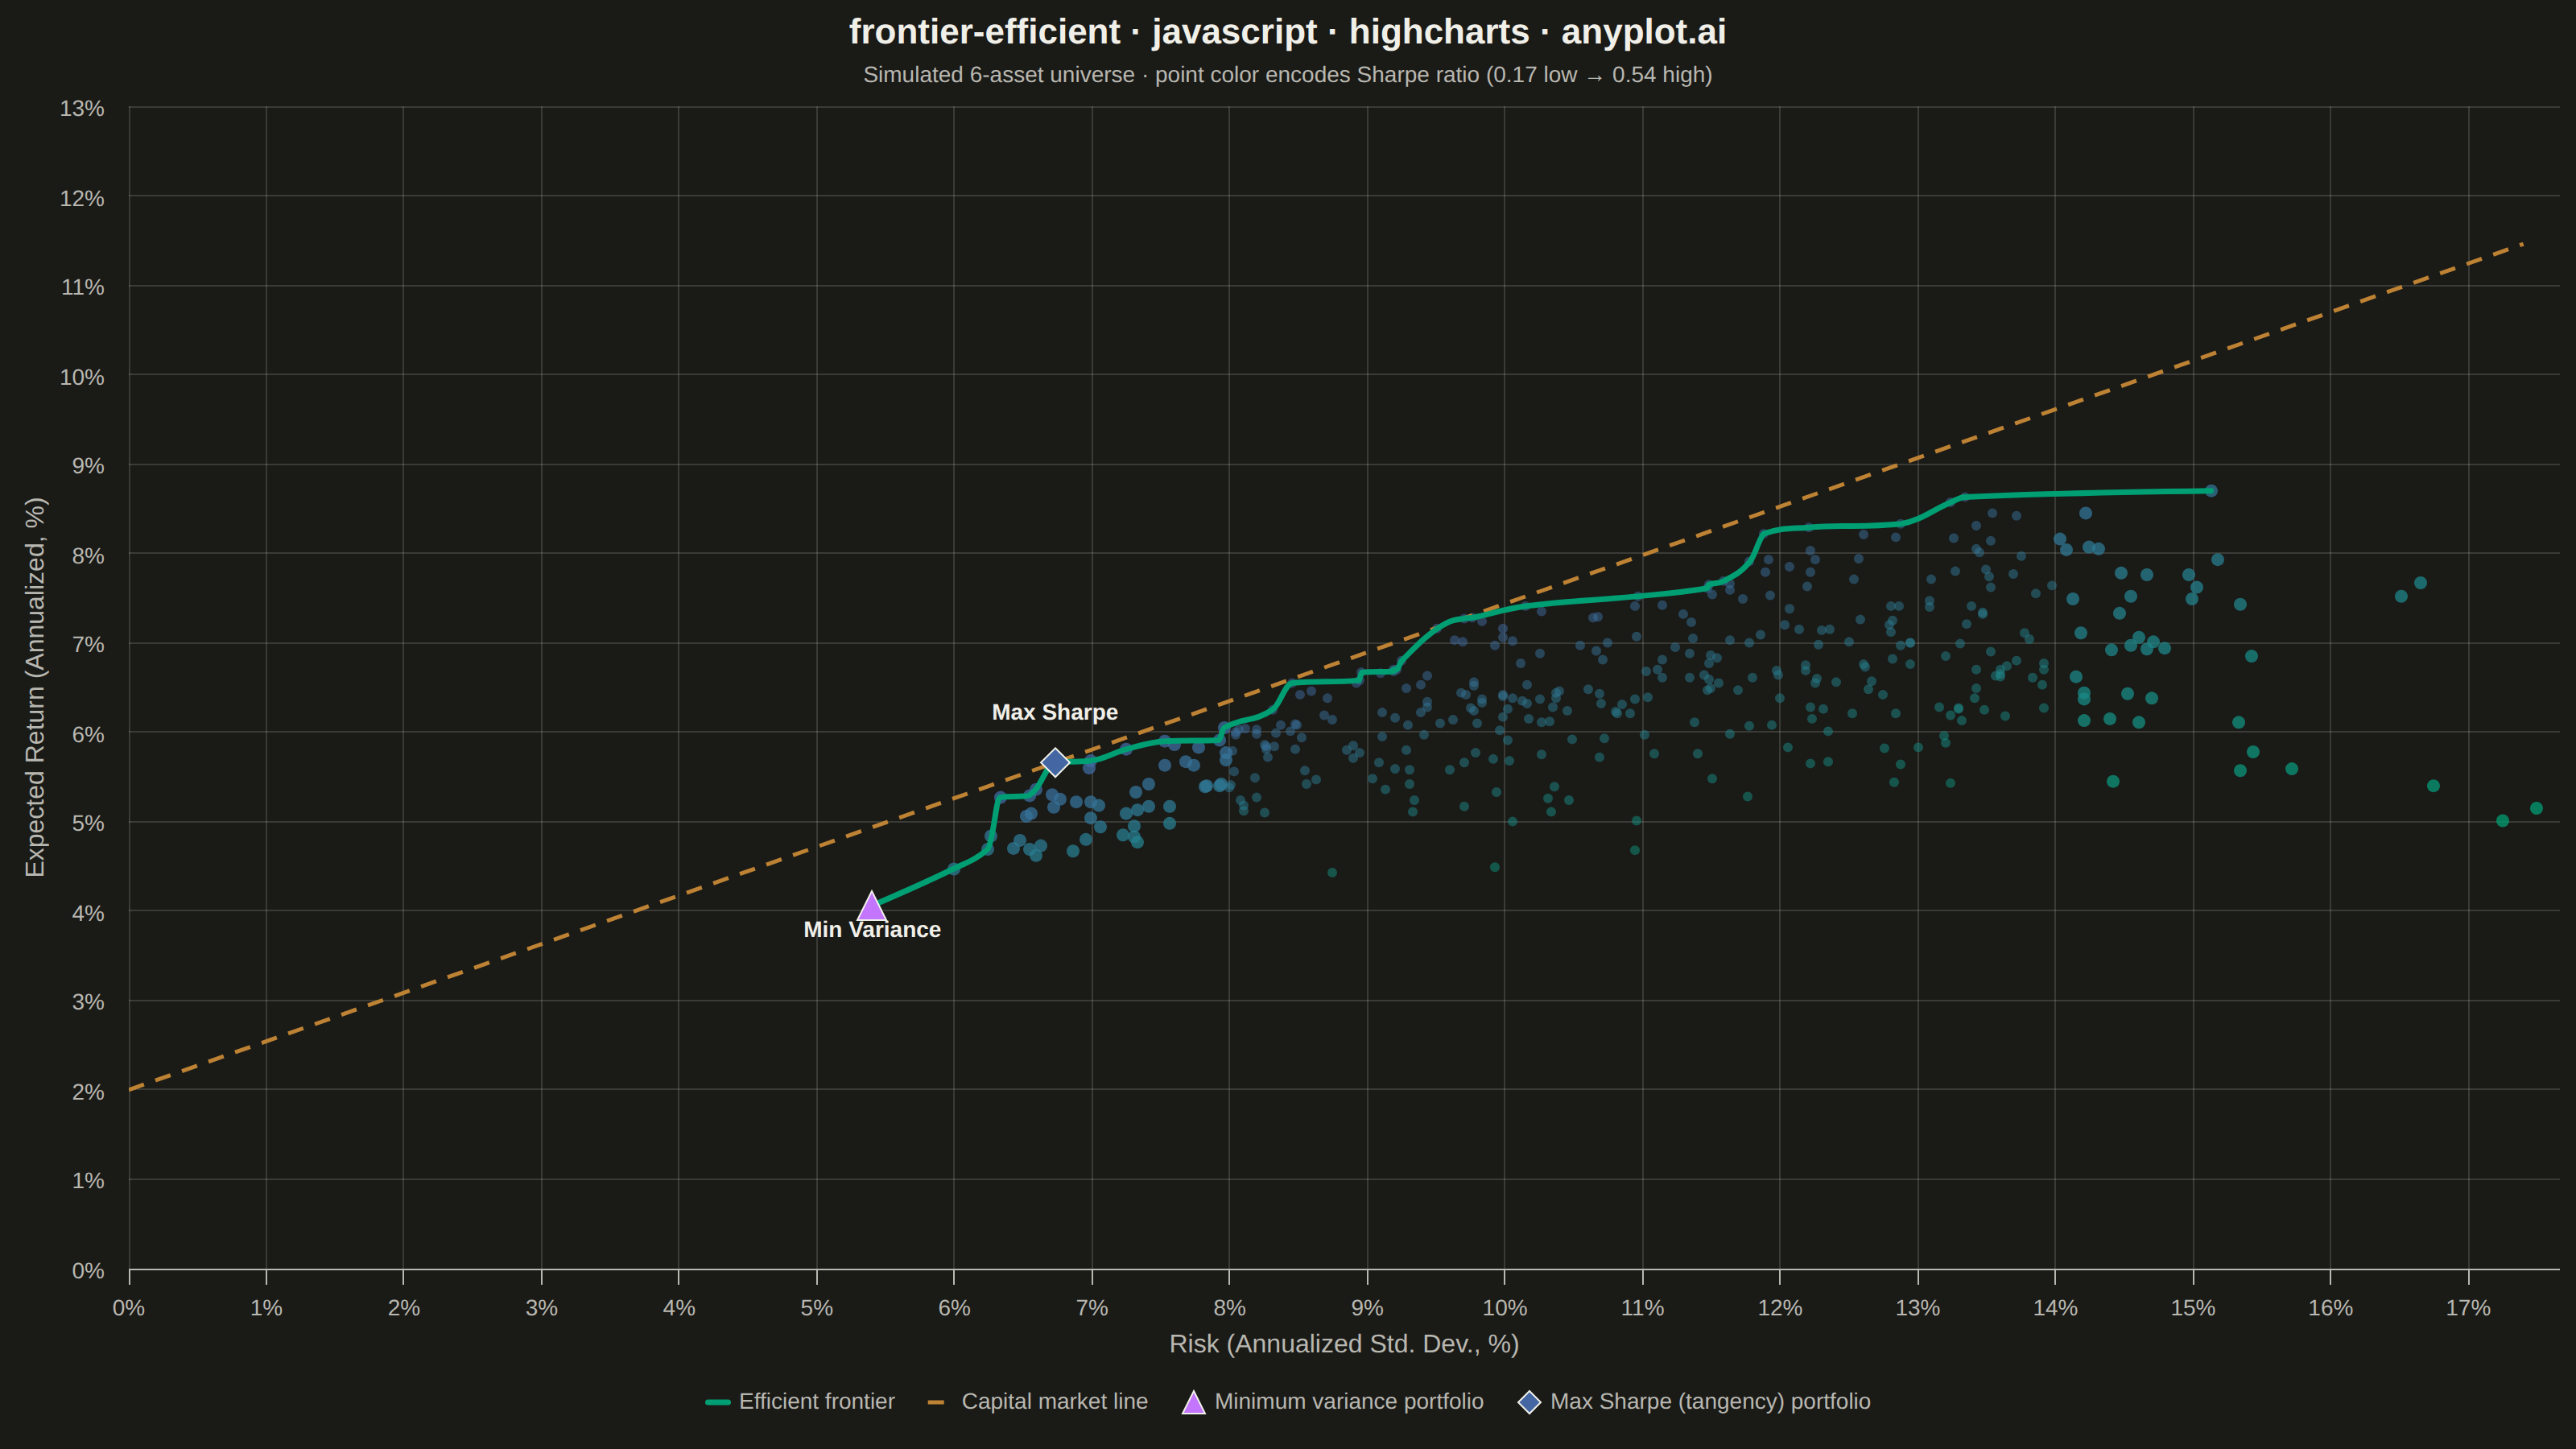
The same plot in 14 other libraries — JavaScript: Chart.js, D3.js, Apache ECharts, MUI X Charts; Python: Altair, Bokeh, lets-plot, Matplotlib, Plotly, plotnine, Pygal, Seaborn; R: ggplot2; Julia: Makie.jl. Compare all 15 side by side: Efficient Frontier for Portfolio Optimization in Python, R, Julia and JavaScript.
The efficient frontier is a fundamental visualization in Modern Portfolio Theory (MPT) that displays a curve of optimal portfolios offering the highest expected return for each level of risk (standard deviation). Portfolios on the frontier are "efficient" because no other portfolio exists with higher return for the same risk, or lower risk for the same return. This plot is essential for asset allocation decisions and understanding the risk-return tradeoff in investment portfolios.
// anyplot.ai
// frontier-efficient: Efficient Frontier for Portfolio Optimization
// Library: highcharts 12.6.0 | JavaScript 22.23.2
// Quality: 87/100 | Created: 2026-09-02

const t = window.ANYPLOT_TOKENS;

// --- Data: simulated 6-asset universe (mean/annualized return, volatility) --
const assets = [
  { name: "US Equities", mu: 0.1, sigma: 0.16 },
  { name: "Intl Equities", mu: 0.085, sigma: 0.19 },
  { name: "Corporate Bonds", mu: 0.045, sigma: 0.07 },
  { name: "Government Bonds", mu: 0.03, sigma: 0.05 },
  { name: "REITs", mu: 0.075, sigma: 0.2 },
  { name: "Commodities", mu: 0.05, sigma: 0.22 },
];

// Fixed correlation matrix (symmetric, unit diagonal)
const correlation = [
  [1.0, 0.75, 0.15, 0.05, 0.55, 0.25],
  [0.75, 1.0, 0.1, 0.0, 0.5, 0.3],
  [0.15, 0.1, 1.0, 0.8, 0.2, 0.05],
  [0.05, 0.0, 0.8, 1.0, 0.1, 0.0],
  [0.55, 0.5, 0.2, 0.1, 1.0, 0.35],
  [0.25, 0.3, 0.05, 0.0, 0.35, 1.0],
];

const n = assets.length;
const covariance = Array.from({ length: n }, (_, i) =>
  Array.from(
    { length: n },
    (_, j) => correlation[i][j] * assets[i].sigma * assets[j].sigma,
  ),
);

const riskFreeRate = 0.02;

// Deterministic LCG PRNG (no seeded RNG available in the browser)
let seed = 42;
function rand() {
  seed = (seed * 1664525 + 1013904223) % 4294967296;
  return seed / 4294967296;
}

// Long-only random weights via normalized exponential draws (Dirichlet-like)
function randomWeights() {
  const draws = Array.from({ length: n }, () => -Math.log(1 - rand()));
  const total = draws.reduce((a, b) => a + b, 0);
  return draws.map((d) => d / total);
}

function portfolioReturn(w) {
  return w.reduce((sum, wi, i) => sum + wi * assets[i].mu, 0);
}

function portfolioRisk(w) {
  let variance = 0;
  for (let i = 0; i < n; i++) {
    for (let j = 0; j < n; j++) {
      variance += w[i] * w[j] * covariance[i][j];
    }
  }
  return Math.sqrt(variance);
}

const PORTFOLIO_COUNT = 400;
const portfolios = [];
for (let k = 0; k < PORTFOLIO_COUNT; k++) {
  const w = randomWeights();
  const risk = portfolioRisk(w);
  const ret = portfolioReturn(w);
  const sharpe = (ret - riskFreeRate) / risk;
  portfolios.push({ risk, ret, sharpe });
}

// Pareto-efficient upper boundary: sort by risk, keep strictly-increasing return
const sortedByRisk = [...portfolios].sort((a, b) => a.risk - b.risk);
const frontier = [];
let bestReturnSoFar = -Infinity;
for (const p of sortedByRisk) {
  if (p.ret > bestReturnSoFar) {
    frontier.push(p);
    bestReturnSoFar = p.ret;
  }
}

const minVariancePortfolio = frontier[0];
const maxSharpePortfolio = portfolios.reduce((best, p) =>
  p.sharpe > best.sharpe ? p : best,
);

// Capital market line: risk-free rate tangent through the max-Sharpe portfolio
const cmlSlope =
  (maxSharpePortfolio.ret - riskFreeRate) / maxSharpePortfolio.risk;
const cmlMaxRisk = frontier[frontier.length - 1].risk * 1.15;

// Color-code the random-portfolio cloud by Sharpe ratio (imprint_seq gradient),
// returned as an rgba() string so alpha can vary per point.
function lerpHex(a, b, frac, alpha) {
  const ah = parseInt(a.slice(1), 16);
  const bh = parseInt(b.slice(1), 16);
  const ar = (ah >> 16) & 0xff,
    ag = (ah >> 8) & 0xff,
    ab = ah & 0xff;
  const br = (bh >> 16) & 0xff,
    bg = (bh >> 8) & 0xff,
    bb = bh & 0xff;
  const rr = Math.round(ar + (br - ar) * frac);
  const rg = Math.round(ag + (bg - ag) * frac);
  const rb = Math.round(ab + (bb - ab) * frac);
  return `rgba(${rr}, ${rg}, ${rb}, ${alpha})`;
}

const sharpeValues = portfolios.map((p) => p.sharpe);
const sharpeMin = Math.min(...sharpeValues);
const sharpeMax = Math.max(...sharpeValues);

// Risk band where the random-portfolio cloud clumps most densely — thin it
// out with a smaller radius and lower opacity so the frontier still reads.
const DENSE_BAND_MIN = 8;
const DENSE_BAND_MAX = 14;

const cloudData = portfolios.map((p) => {
  const frac = (p.sharpe - sharpeMin) / (sharpeMax - sharpeMin);
  const xPct = Number((p.risk * 100).toFixed(2));
  const inDenseBand = xPct >= DENSE_BAND_MIN && xPct <= DENSE_BAND_MAX;
  return {
    x: xPct,
    y: Number((p.ret * 100).toFixed(2)),
    sharpe: Number(p.sharpe.toFixed(2)),
    color: lerpHex(t.seq[0], t.seq[1], frac, inDenseBand ? 0.5 : 0.75),
    marker: inDenseBand ? { radius: 3 } : undefined,
  };
});

const frontierData = frontier.map((p) => [
  Number((p.risk * 100).toFixed(2)),
  Number((p.ret * 100).toFixed(2)),
]);

const cmlData = [
  [0, riskFreeRate * 100],
  [
    Number((cmlMaxRisk * 100).toFixed(2)),
    Number(((riskFreeRate + cmlSlope * cmlMaxRisk) * 100).toFixed(2)),
  ],
];

// --- Chart -------------------------------------------------------------
Highcharts.chart("container", {
  chart: {
    type: "scatter",
    backgroundColor: "transparent",
    animation: false,
    style: { fontFamily: "inherit" },
  },
  credits: { enabled: false },
  colors: t.palette,
  title: {
    text: "frontier-efficient · javascript · highcharts · anyplot.ai",
    style: { color: t.ink, fontSize: "22px", fontWeight: "600" },
  },
  subtitle: {
    text: `Simulated 6-asset universe · point color encodes Sharpe ratio (${sharpeMin.toFixed(2)} low → ${sharpeMax.toFixed(2)} high)`,
    style: { color: t.inkSoft, fontSize: "14px" },
  },
  xAxis: {
    title: {
      text: "Risk (Annualized Std. Dev., %)",
      style: { color: t.inkSoft, fontSize: "16px" },
    },
    min: 0,
    lineColor: t.inkSoft,
    tickColor: t.inkSoft,
    gridLineColor: t.grid,
    gridLineWidth: 1,
    labels: {
      style: { color: t.inkSoft, fontSize: "14px" },
      format: "{value}%",
    },
  },
  yAxis: {
    title: {
      text: "Expected Return (Annualized, %)",
      style: { color: t.inkSoft, fontSize: "16px" },
    },
    min: 0,
    lineColor: t.inkSoft,
    tickColor: t.inkSoft,
    gridLineColor: t.grid,
    labels: {
      style: { color: t.inkSoft, fontSize: "14px" },
      format: "{value}%",
    },
  },
  legend: {
    enabled: true,
    itemStyle: { color: t.inkSoft, fontSize: "14px" },
    itemHoverStyle: { color: t.ink },
  },
  tooltip: {
    backgroundColor: t.elevatedBg,
    style: { color: t.ink },
    pointFormatter: function () {
      const sharpe =
        this.sharpe !== undefined ? `<br/>Sharpe: ${this.sharpe}` : "";
      return `Risk: ${this.x}%<br/>Return: ${this.y}%${sharpe}`;
    },
  },
  plotOptions: {
    series: { animation: false },
    scatter: { marker: { radius: 4, lineWidth: 0 } },
  },
  series: [
    {
      name: "Simulated portfolios",
      type: "scatter",
      data: cloudData,
      marker: { radius: 4 },
      showInLegend: false,
    },
    {
      name: "Efficient frontier",
      type: "spline",
      data: frontierData,
      color: t.palette[0],
      lineWidth: 3.5,
      marker: { enabled: false },
      zIndex: 3,
    },
    {
      name: "Capital market line",
      type: "line",
      data: cmlData,
      color: t.palette[3],
      dashStyle: "Dash",
      lineWidth: 2.5,
      marker: { enabled: false },
      zIndex: 2,
    },
    {
      name: "Minimum variance portfolio",
      type: "scatter",
      data: [
        {
          x: Number((minVariancePortfolio.risk * 100).toFixed(2)),
          y: Number((minVariancePortfolio.ret * 100).toFixed(2)),
        },
      ],
      color: t.palette[1],
      marker: { symbol: "triangle", radius: 9, lineColor: t.ink, lineWidth: 1 },
      dataLabels: {
        enabled: true,
        format: "Min Variance",
        y: 26,
        style: {
          color: t.ink,
          fontSize: "14px",
          textOutline: "none",
          fontWeight: "600",
        },
      },
      zIndex: 4,
    },
    {
      name: "Max Sharpe (tangency) portfolio",
      type: "scatter",
      data: [
        {
          x: Number((maxSharpePortfolio.risk * 100).toFixed(2)),
          y: Number((maxSharpePortfolio.ret * 100).toFixed(2)),
        },
      ],
      color: t.palette[2],
      marker: { symbol: "diamond", radius: 9, lineColor: t.ink, lineWidth: 1 },
      dataLabels: {
        enabled: true,
        format: "Max Sharpe",
        y: -20,
        style: {
          color: t.ink,
          fontSize: "14px",
          textOutline: "none",
          fontWeight: "600",
        },
      },
      zIndex: 4,
    },
  ],
});
Runnable source as JSON, for any HTTP client: https://api.anyplot.ai/specs/frontier-efficient/highcharts/code. Any spec id and library id listed in llms-full.txt fit the same URL shape; every URL below is complete and callable.
{
  "spec_id": "frontier-efficient",
  "language": "javascript",
  "library": "highcharts",
  "page": "https://anyplot.ai/frontier-efficient/javascript/highcharts",
  "hub": "https://anyplot.ai/frontier-efficient",
  "code_json": "https://api.anyplot.ai/specs/frontier-efficient/highcharts/code",
  "spec_json": "https://api.anyplot.ai/specs/frontier-efficient",
  "render_light_png": "https://storage.googleapis.com/anyplot-images/plots/frontier-efficient/javascript/highcharts/plot-light.png",
  "render_dark_png": "https://storage.googleapis.com/anyplot-images/plots/frontier-efficient/javascript/highcharts/plot-dark.png",
  "interactive_light_html": "https://storage.googleapis.com/anyplot-images/plots/frontier-efficient/javascript/highcharts/plot-light.html",
  "interactive_dark_html": "https://storage.googleapis.com/anyplot-images/plots/frontier-efficient/javascript/highcharts/plot-dark.html",
  "quality_score": 87.0,
  "license": "MIT",
  "guide": "https://anyplot.ai/llms.txt"
}
Part of Efficient Frontier for Portfolio Optimization on anyplot.ai.