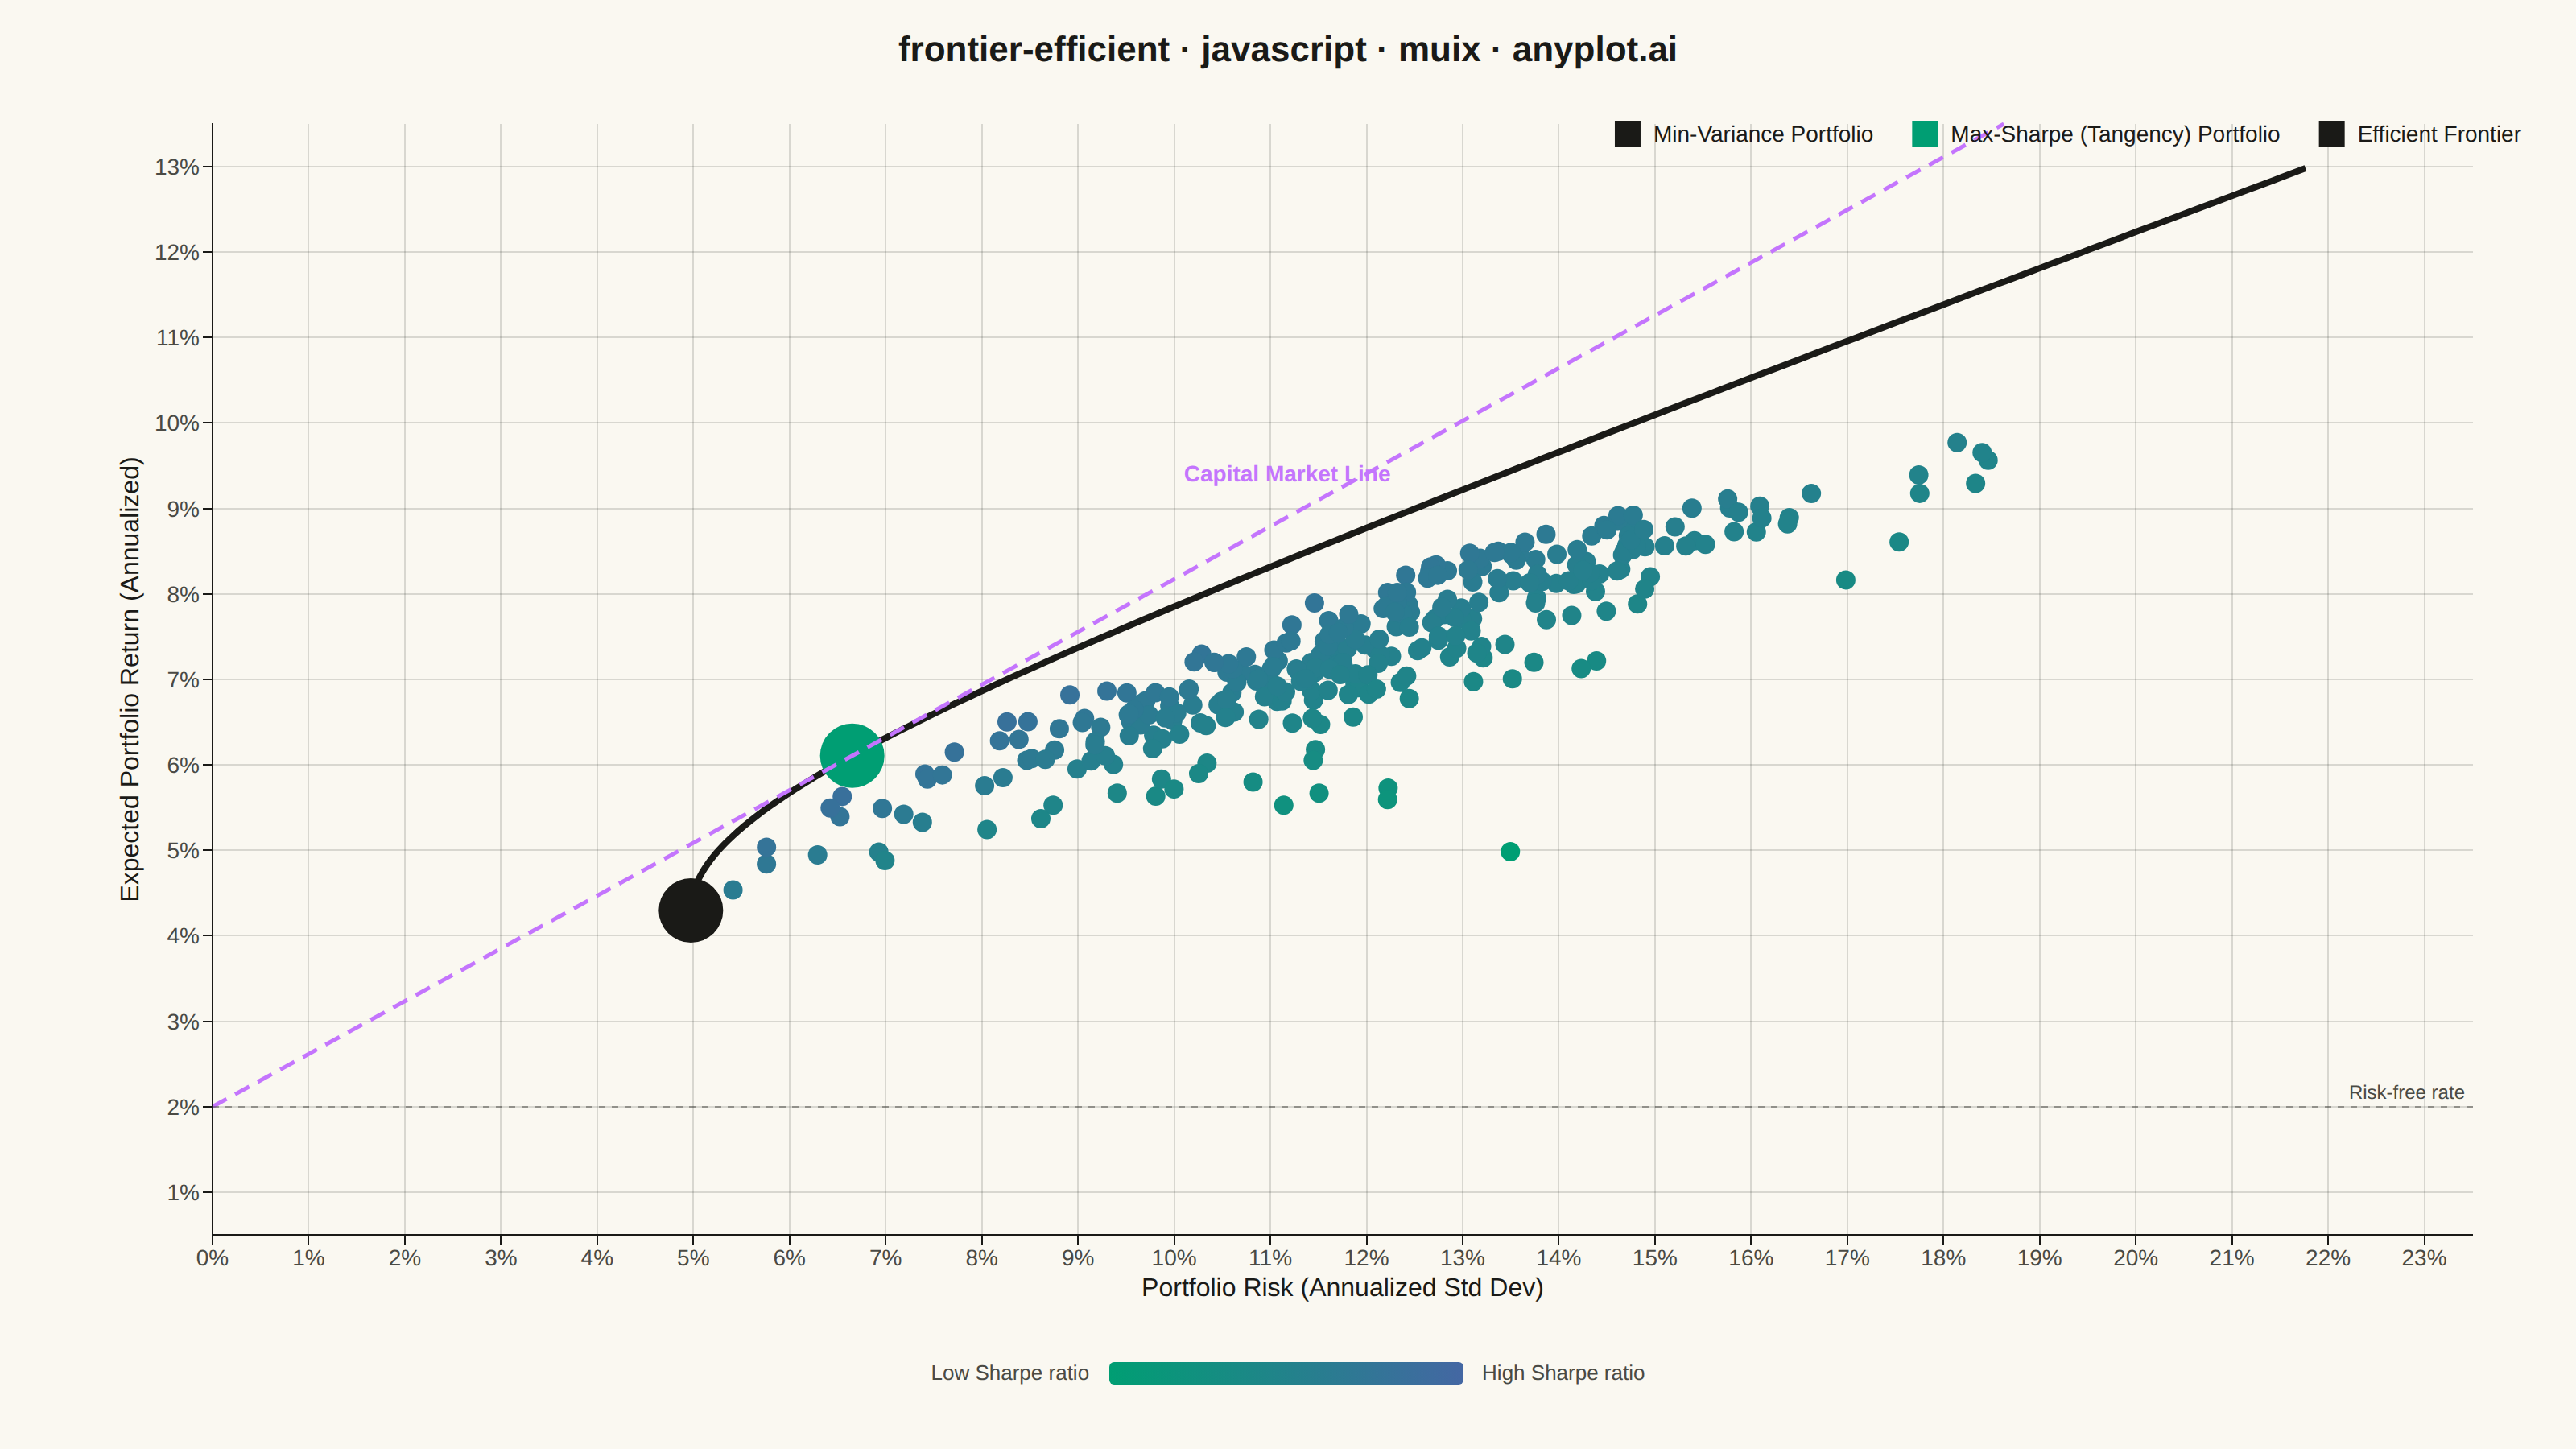
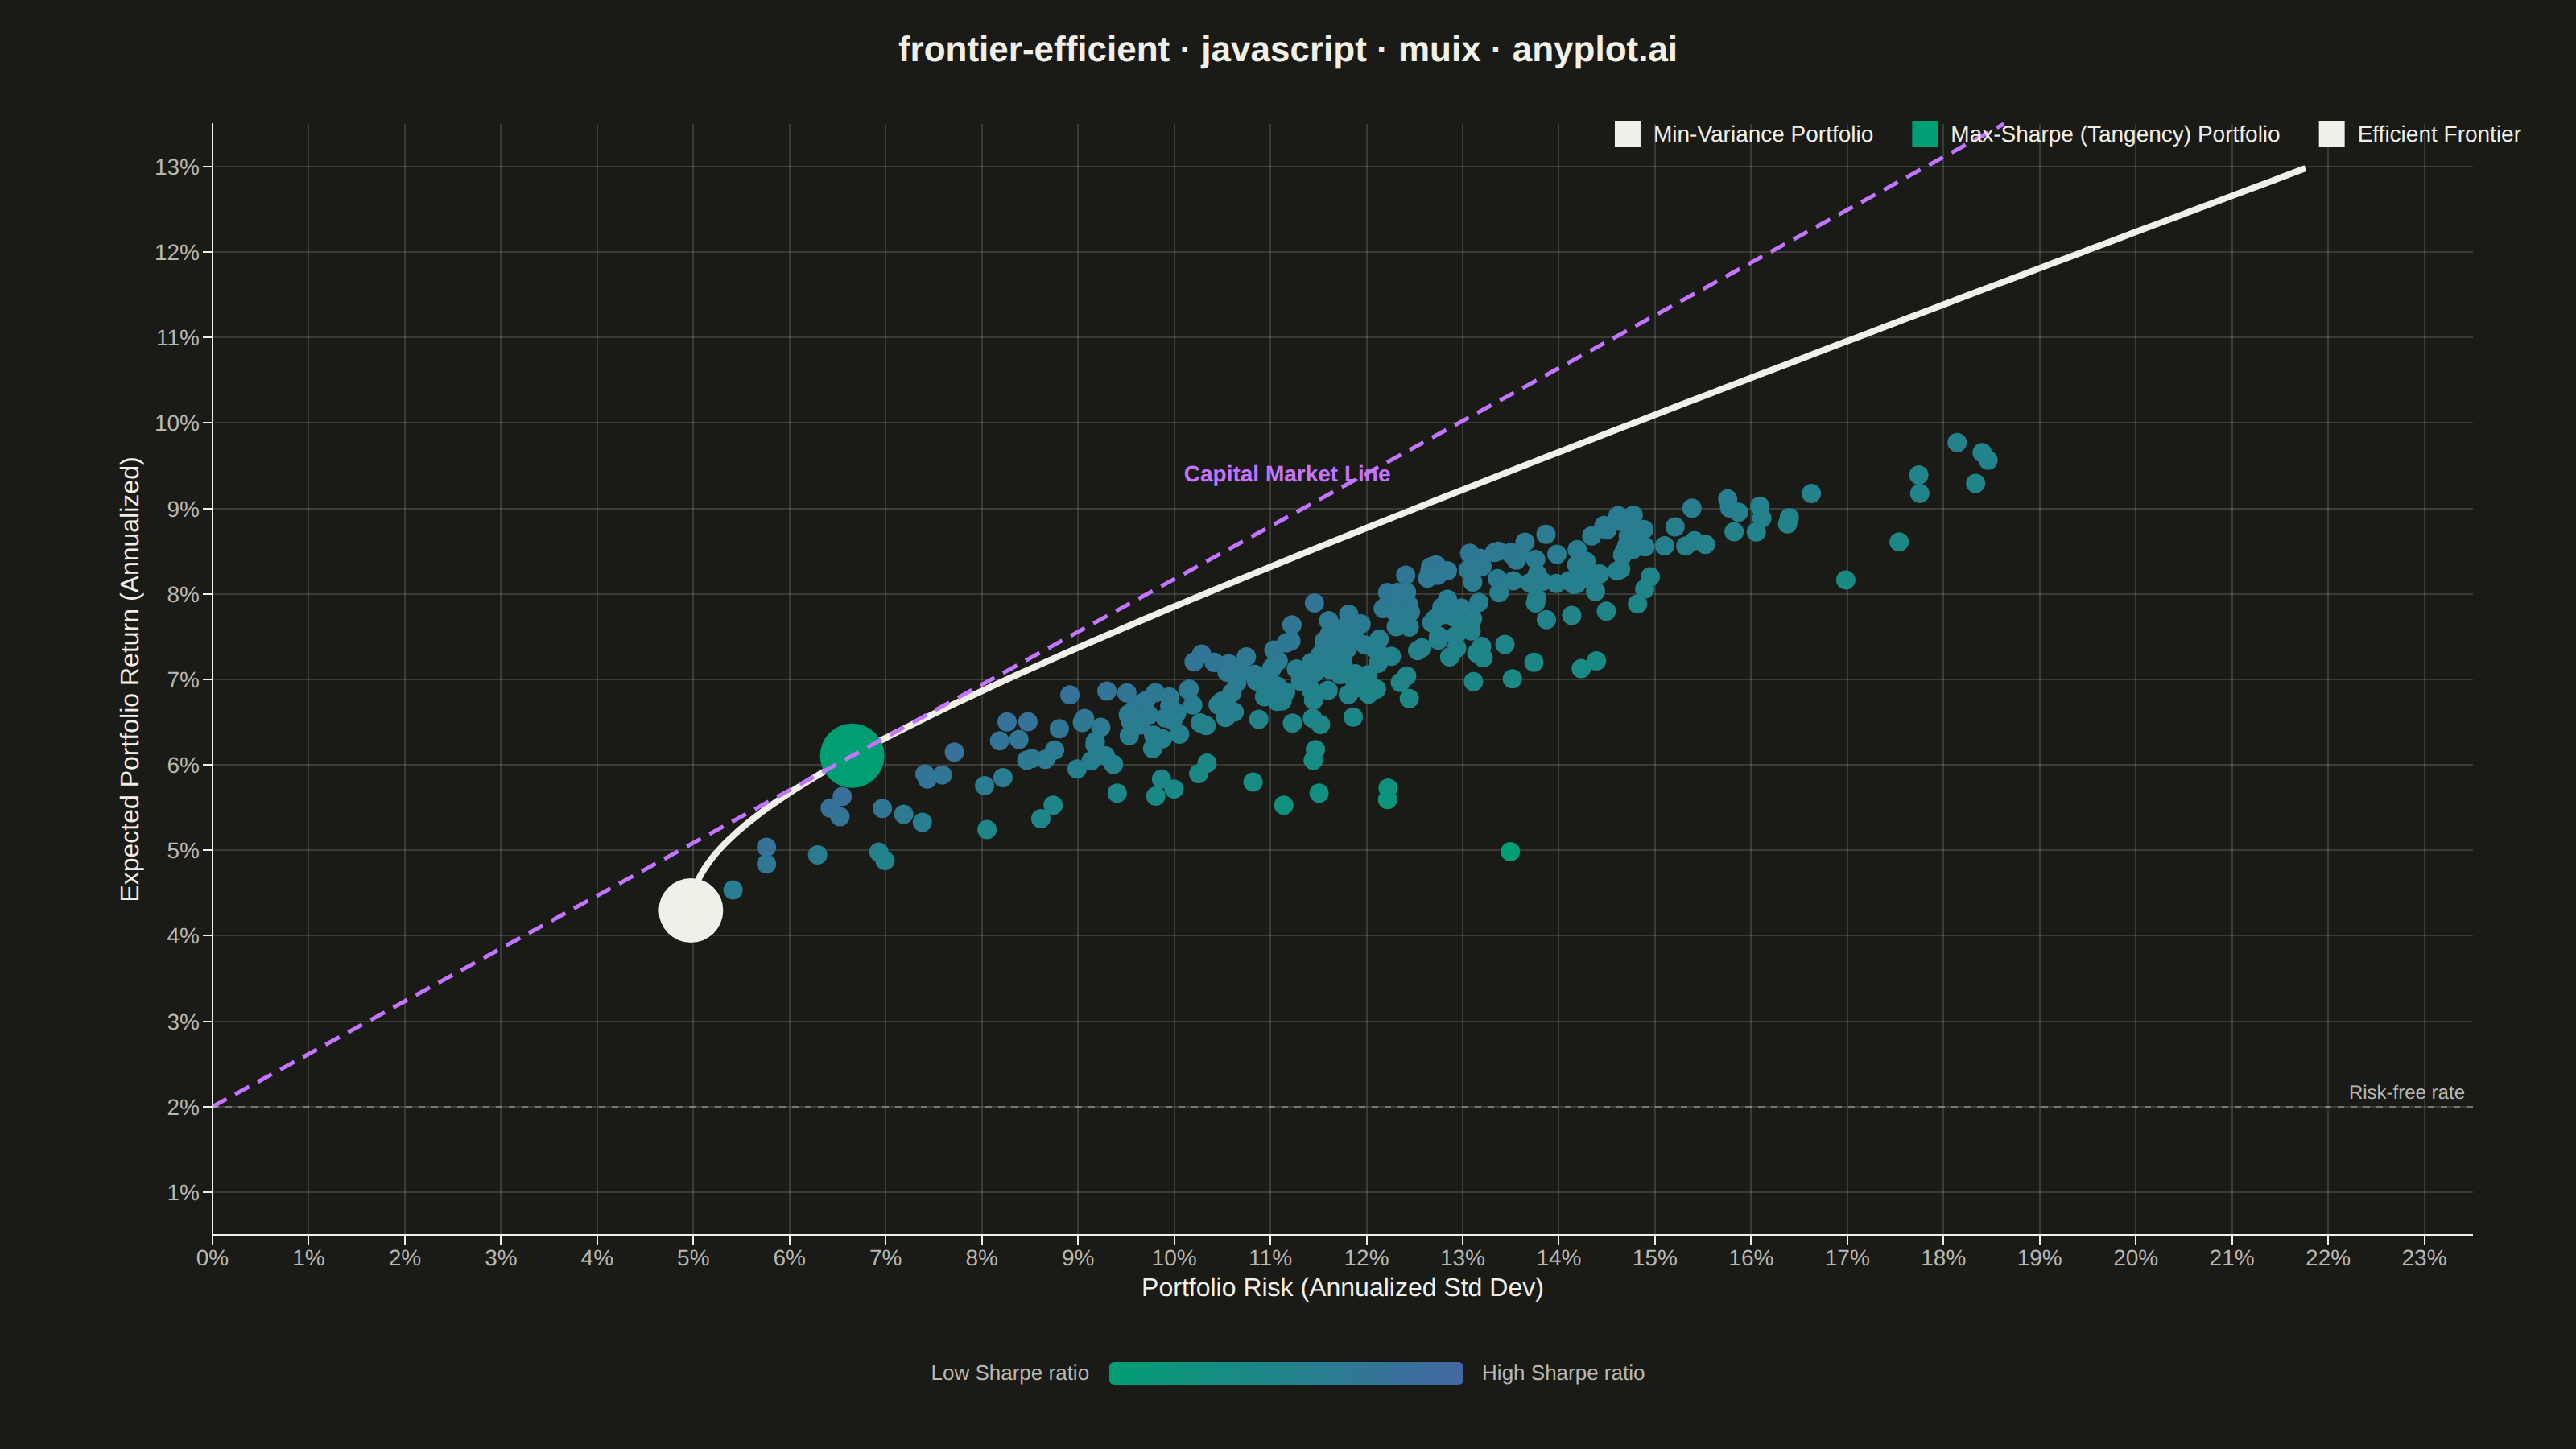
The same plot in 14 other libraries — JavaScript: Chart.js, D3.js, Apache ECharts, Highcharts; Python: Altair, Bokeh, lets-plot, Matplotlib, Plotly, plotnine, Pygal, Seaborn; R: ggplot2; Julia: Makie.jl. Compare all 15 side by side: Efficient Frontier for Portfolio Optimization in Python, R, Julia and JavaScript.
The efficient frontier is a fundamental visualization in Modern Portfolio Theory (MPT) that displays a curve of optimal portfolios offering the highest expected return for each level of risk (standard deviation). Portfolios on the frontier are "efficient" because no other portfolio exists with higher return for the same risk, or lower risk for the same return. This plot is essential for asset allocation decisions and understanding the risk-return tradeoff in investment portfolios.
// anyplot.ai
// frontier-efficient: Efficient Frontier for Portfolio Optimization
// Library: muix 7.29.1 | JavaScript 22.23.2
// Quality: 87/100 | Created: 2026-09-02
//# anyplot-orientation: landscape
// anyplot.ai
// frontier-efficient: Efficient Frontier for Portfolio Optimization
// Library: MUI X Charts | React | Node 22
// License: @mui/x-charts — MIT (community). Pro/Premium are out of scope.
// Quality: pending | Created: 2026-09-02

import { ChartContainer } from "@mui/x-charts/ChartContainer";
import { LinePlot } from "@mui/x-charts/LineChart";
import { ScatterPlot } from "@mui/x-charts/ScatterChart";
import { ChartsXAxis } from "@mui/x-charts/ChartsXAxis";
import { ChartsYAxis } from "@mui/x-charts/ChartsYAxis";
import { ChartsGrid } from "@mui/x-charts/ChartsGrid";
import { ChartsLegend } from "@mui/x-charts/ChartsLegend";
import { ChartsReferenceLine } from "@mui/x-charts/ChartsReferenceLine";
import { useXScale, useYScale } from "@mui/x-charts/hooks";
import Box from "@mui/material/Box";
import Typography from "@mui/material/Typography";

const t = window.ANYPLOT_TOKENS;

// --- Linear algebra helpers (Gauss-Jordan inverse, dot / matrix-vector) -----
function invertMatrix(M) {
  const n = M.length;
  const A = M.map((row, i) => [...row, ...Array.from({ length: n }, (_, j) => (i === j ? 1 : 0))]);
  for (let col = 0; col < n; col++) {
    let pivotRow = col;
    let maxVal = Math.abs(A[col][col]);
    for (let r = col + 1; r < n; r++) {
      if (Math.abs(A[r][col]) > maxVal) {
        maxVal = Math.abs(A[r][col]);
        pivotRow = r;
      }
    }
    [A[col], A[pivotRow]] = [A[pivotRow], A[col]];
    const pivot = A[col][col];
    for (let j = 0; j < 2 * n; j++) A[col][j] /= pivot;
    for (let r = 0; r < n; r++) {
      if (r === col) continue;
      const factor = A[r][col];
      for (let j = 0; j < 2 * n; j++) A[r][j] -= factor * A[col][j];
    }
  }
  return A.map((row) => row.slice(n));
}
const matVec = (M, v) => M.map((row) => row.reduce((s, mij, j) => s + mij * v[j], 0));
const dot = (a, b) => a.reduce((s, ai, i) => s + ai * b[i], 0);

// --- Asset universe (annualized historical return / vol / correlation) -----
const MU = [0.095, 0.075, 0.11, 0.035, 0.085, 0.045];
const VOL = [0.16, 0.18, 0.24, 0.055, 0.19, 0.15];
const CORR = [
  [1.0, 0.82, 0.72, -0.08, 0.58, 0.02],
  [0.82, 1.0, 0.78, -0.04, 0.52, 0.08],
  [0.72, 0.78, 1.0, -0.12, 0.48, 0.12],
  [-0.08, -0.04, -0.12, 1.0, 0.1, 0.18],
  [0.58, 0.52, 0.48, 0.1, 1.0, 0.06],
  [0.02, 0.08, 0.12, 0.18, 0.06, 1.0],
];
const N = MU.length;
const COV = CORR.map((row, i) => row.map((c, j) => c * VOL[i] * VOL[j]));
const COV_INV = invertMatrix(COV);
const ONES = Array(N).fill(1);
const RF = 0.02; // risk-free rate

// Two-fund theorem scalars for the analytic minimum-variance frontier
const A_ = dot(ONES, matVec(COV_INV, ONES));
const B_ = dot(ONES, matVec(COV_INV, MU));
const C_ = dot(MU, matVec(COV_INV, MU));
const D_ = A_ * C_ - B_ * B_;

const R_GMV = B_ / A_;
const RISK_GMV = Math.sqrt(1 / A_);

// Tangency (max Sharpe ratio) portfolio: w = Sigma^-1 (mu - rf) / 1'Sigma^-1(mu - rf)
const excess = MU.map((m) => m - RF);
const zTan = matVec(COV_INV, excess);
const sumZTan = zTan.reduce((a, b) => a + b, 0);
const wTan = zTan.map((z) => z / sumZTan);
const R_TAN = dot(wTan, MU);
const RISK_TAN = Math.sqrt(dot(wTan, matVec(COV, wTan)));
const SHARPE_TAN = (R_TAN - RF) / RISK_TAN;

// Analytic efficient frontier: risk(r) = sqrt((A*r^2 - 2*B*r + C) / D) for r >= r_gmv
const R_MAX = Math.max(...MU) * 1.18;
const FN = 80;
const frontierReturns = Array.from({ length: FN }, (_, i) => R_GMV + ((R_MAX - R_GMV) * i) / (FN - 1));
const frontierRisks = frontierReturns.map((r) => Math.sqrt(Math.max(0, (A_ * r * r - 2 * B_ * r + C_) / D_)));

// Reproducible LCG (seed 7) — no Math.random() in browser harness context
let seed = 7;
function rng() {
  seed = (Math.imul(1664525, seed) + 1013904223) >>> 0;
  return seed / 4294967296;
}
const randExp = () => -Math.log(1 - rng());

// 300 randomly weighted long-only portfolios (Dirichlet(1) weights via normalized exponentials)
const N_PORT = 300;
const portfolios = Array.from({ length: N_PORT }, (_, k) => {
  const e = Array.from({ length: N }, randExp);
  const s = e.reduce((a, b) => a + b, 0);
  const w = e.map((v) => v / s);
  const r = dot(w, MU);
  const risk = Math.sqrt(dot(w, matVec(COV, w)));
  return { id: `p${k}`, x: risk, y: r, z: (r - RF) / risk };
});
const sharpeVals = portfolios.map((p) => p.z);
const SHARPE_MIN = Math.min(...sharpeVals);
const SHARPE_MAX = Math.max(...sharpeVals, SHARPE_TAN);

const X_MAX = Math.max(RISK_TAN, RISK_GMV, ...frontierRisks, ...portfolios.map((p) => p.x)) * 1.08;
const Y_MIN = Math.min(RF, R_GMV, ...portfolios.map((p) => p.y)) - 0.015;
const Y_MAX = Math.max(R_MAX, ...portfolios.map((p) => p.y)) * 1.04;

const pct = (v) => `${(v * 100).toFixed(0)}%`;

// Capital Market Line: r = rf + Sharpe_tan * risk, drawn via axis-scale hooks.
// Clip the endpoint to the visible plot bounds (intersect the ray with y = Y_MAX) so the
// line never overshoots the chart, and place the label ~60% along the visible segment
// (well clear of both the top-right legend and the bottom-left risk-free reference line).
const CML_X_END = SHARPE_TAN > 0 ? Math.min(X_MAX, (Y_MAX - RF) / SHARPE_TAN) : X_MAX;
const CML_Y_END = RF + SHARPE_TAN * CML_X_END;
const CML_LABEL_X = 0.6 * CML_X_END;
const CML_LABEL_Y = RF + SHARPE_TAN * CML_LABEL_X;

function CapitalMarketLine() {
  const xScale = useXScale("risk");
  const yScale = useYScale("return");
  if (!xScale || !yScale) return null;
  const x1 = xScale(0);
  const y1 = yScale(RF);
  const x2 = xScale(CML_X_END);
  const y2 = yScale(CML_Y_END);
  const xLabel = xScale(CML_LABEL_X);
  const yLabel = yScale(CML_LABEL_Y);
  return (
    <g>
      <line x1={x1} y1={y1} x2={x2} y2={y2} stroke={t.palette[1]} strokeWidth={2.5} strokeDasharray="10,6" />
      <text x={xLabel} y={yLabel - 22} textAnchor="middle" fontSize={14} fontWeight={600} fill={t.palette[1]}>
        Capital Market Line
      </text>
    </g>
  );
}

const TITLE = "frontier-efficient · javascript · muix · anyplot.ai";

export default function Chart() {
  const { width, height } = window.ANYPLOT_SIZE;
  const TITLE_H = 56;
  const COLORBAR_H = 54;
  const chartH = height - TITLE_H - COLORBAR_H;

  return (
    <Box sx={{ width, height, background: t.pageBg, display: "flex", flexDirection: "column", overflow: "hidden" }}>
      <Typography sx={{ fontSize: "22px", fontWeight: 600, color: t.ink, textAlign: "center", pt: "14px", pb: "6px" }}>
        {TITLE}
      </Typography>
      <ChartContainer
        width={width}
        height={chartH}
        margin={{ top: 24, right: 64, bottom: 76, left: 132 }}
        sx={{ "& .MuiLineElement-root": { strokeWidth: 4 } }}
        series={[
          {
            type: "line",
            id: "frontier",
            data: frontierReturns,
            xAxisId: "risk",
            yAxisId: "return",
            color: t.ink,
            showMark: false,
            curve: "monotoneX",
            label: "Efficient Frontier",
          },
          {
            type: "scatter",
            id: "cloud",
            data: portfolios,
            xAxisId: "risk",
            yAxisId: "return",
            zAxisId: "sharpe",
            markerSize: 6,
          },
          {
            type: "scatter",
            id: "gmv",
            data: [{ x: RISK_GMV, y: R_GMV, id: "gmv" }],
            xAxisId: "risk",
            yAxisId: "return",
            zAxisId: "flat",
            color: t.ink,
            markerSize: 20,
            label: "Min-Variance Portfolio",
          },
          {
            type: "scatter",
            id: "tan",
            data: [{ x: RISK_TAN, y: R_TAN, id: "tan" }],
            xAxisId: "risk",
            yAxisId: "return",
            zAxisId: "flat",
            color: t.palette[0],
            markerSize: 20,
            label: "Max-Sharpe (Tangency) Portfolio",
          },
        ]}
        xAxis={[
          {
            id: "risk",
            scaleType: "linear",
            data: frontierRisks,
            min: 0,
            max: X_MAX,
            label: "Portfolio Risk (Annualized Std Dev)",
            valueFormatter: pct,
            tickLabelStyle: { fontSize: 14, fill: t.inkSoft },
            labelStyle: { fontSize: 16, fill: t.ink },
          },
        ]}
        yAxis={[
          {
            id: "return",
            min: Y_MIN,
            max: Y_MAX,
            label: "Expected Portfolio Return (Annualized)",
            valueFormatter: pct,
            tickLabelStyle: { fontSize: 14, fill: t.inkSoft },
            labelStyle: { fontSize: 16, fill: t.ink },
          },
        ]}
        zAxis={[
          {
            id: "sharpe",
            min: SHARPE_MIN,
            max: SHARPE_MAX,
            colorMap: { type: "continuous", min: SHARPE_MIN, max: SHARPE_MAX, color: [t.seq[0], t.seq[1]] },
          },
          // No colorMap: gives the highlight markers below an escape hatch from the
          // "sharpe" colorScale, which MUI X otherwise applies to every scatter series
          // that doesn't set its own zAxisId (ScatterPlot.js falls back to zAxisIds[0]).
          { id: "flat" },
        ]}
      >
        <ChartsGrid horizontal vertical />
        <LinePlot skipAnimation />
        <ScatterPlot skipAnimation />
        <CapitalMarketLine />
        <ChartsReferenceLine
          y={RF}
          axisId="return"
          label="Risk-free rate"
          labelAlign="end"
          labelStyle={{ fill: t.inkSoft, fontSize: 12 }}
          lineStyle={{ stroke: t.inkSoft, strokeDasharray: "4,4", strokeWidth: 1, opacity: 0.5 }}
        />
        <ChartsXAxis axisId="risk" tickLabelStyle={{ fontSize: 14, fill: t.inkSoft }} labelStyle={{ fontSize: 16, fill: t.ink }} />
        <ChartsYAxis
          axisId="return"
          tickFontSize={30}
          tickLabelStyle={{ fontSize: 14, fill: t.inkSoft }}
          labelStyle={{ fontSize: 16, fill: t.ink }}
        />
        <ChartsLegend
          position={{ vertical: "top", horizontal: "right" }}
          slotProps={{
            legend: {
              itemMarkWidth: 16,
              itemMarkHeight: 16,
              markGap: 8,
              itemGap: 24,
              labelStyle: { fontSize: 14, fill: t.ink },
            },
          }}
        />
      </ChartContainer>
      {/* Sharpe-ratio colorbar for the random-portfolio cloud */}
      <Box sx={{ display: "flex", alignItems: "center", justifyContent: "center", gap: "12px", pb: "14px" }}>
        <Typography sx={{ fontSize: "13px", color: t.inkSoft }}>Low Sharpe ratio</Typography>
        <Box sx={{ width: 220, height: 14, borderRadius: "3px", background: `linear-gradient(to right, ${t.seq[0]}, ${t.seq[1]})` }} />
        <Typography sx={{ fontSize: "13px", color: t.inkSoft }}>High Sharpe ratio</Typography>
      </Box>
    </Box>
  );
}
Runnable source as JSON, for any HTTP client: https://api.anyplot.ai/specs/frontier-efficient/muix/code. Any spec id and library id listed in llms-full.txt fit the same URL shape; every URL below is complete and callable.
{
  "spec_id": "frontier-efficient",
  "language": "javascript",
  "library": "muix",
  "page": "https://anyplot.ai/frontier-efficient/javascript/muix",
  "hub": "https://anyplot.ai/frontier-efficient",
  "code_json": "https://api.anyplot.ai/specs/frontier-efficient/muix/code",
  "spec_json": "https://api.anyplot.ai/specs/frontier-efficient",
  "render_light_png": "https://storage.googleapis.com/anyplot-images/plots/frontier-efficient/javascript/muix/plot-light.png",
  "render_dark_png": "https://storage.googleapis.com/anyplot-images/plots/frontier-efficient/javascript/muix/plot-dark.png",
  "interactive_light_html": "https://storage.googleapis.com/anyplot-images/plots/frontier-efficient/javascript/muix/plot-light.html",
  "interactive_dark_html": "https://storage.googleapis.com/anyplot-images/plots/frontier-efficient/javascript/muix/plot-dark.html",
  "quality_score": 87.0,
  "license": "MIT",
  "guide": "https://anyplot.ai/llms.txt"
}
Part of Efficient Frontier for Portfolio Optimization on anyplot.ai.