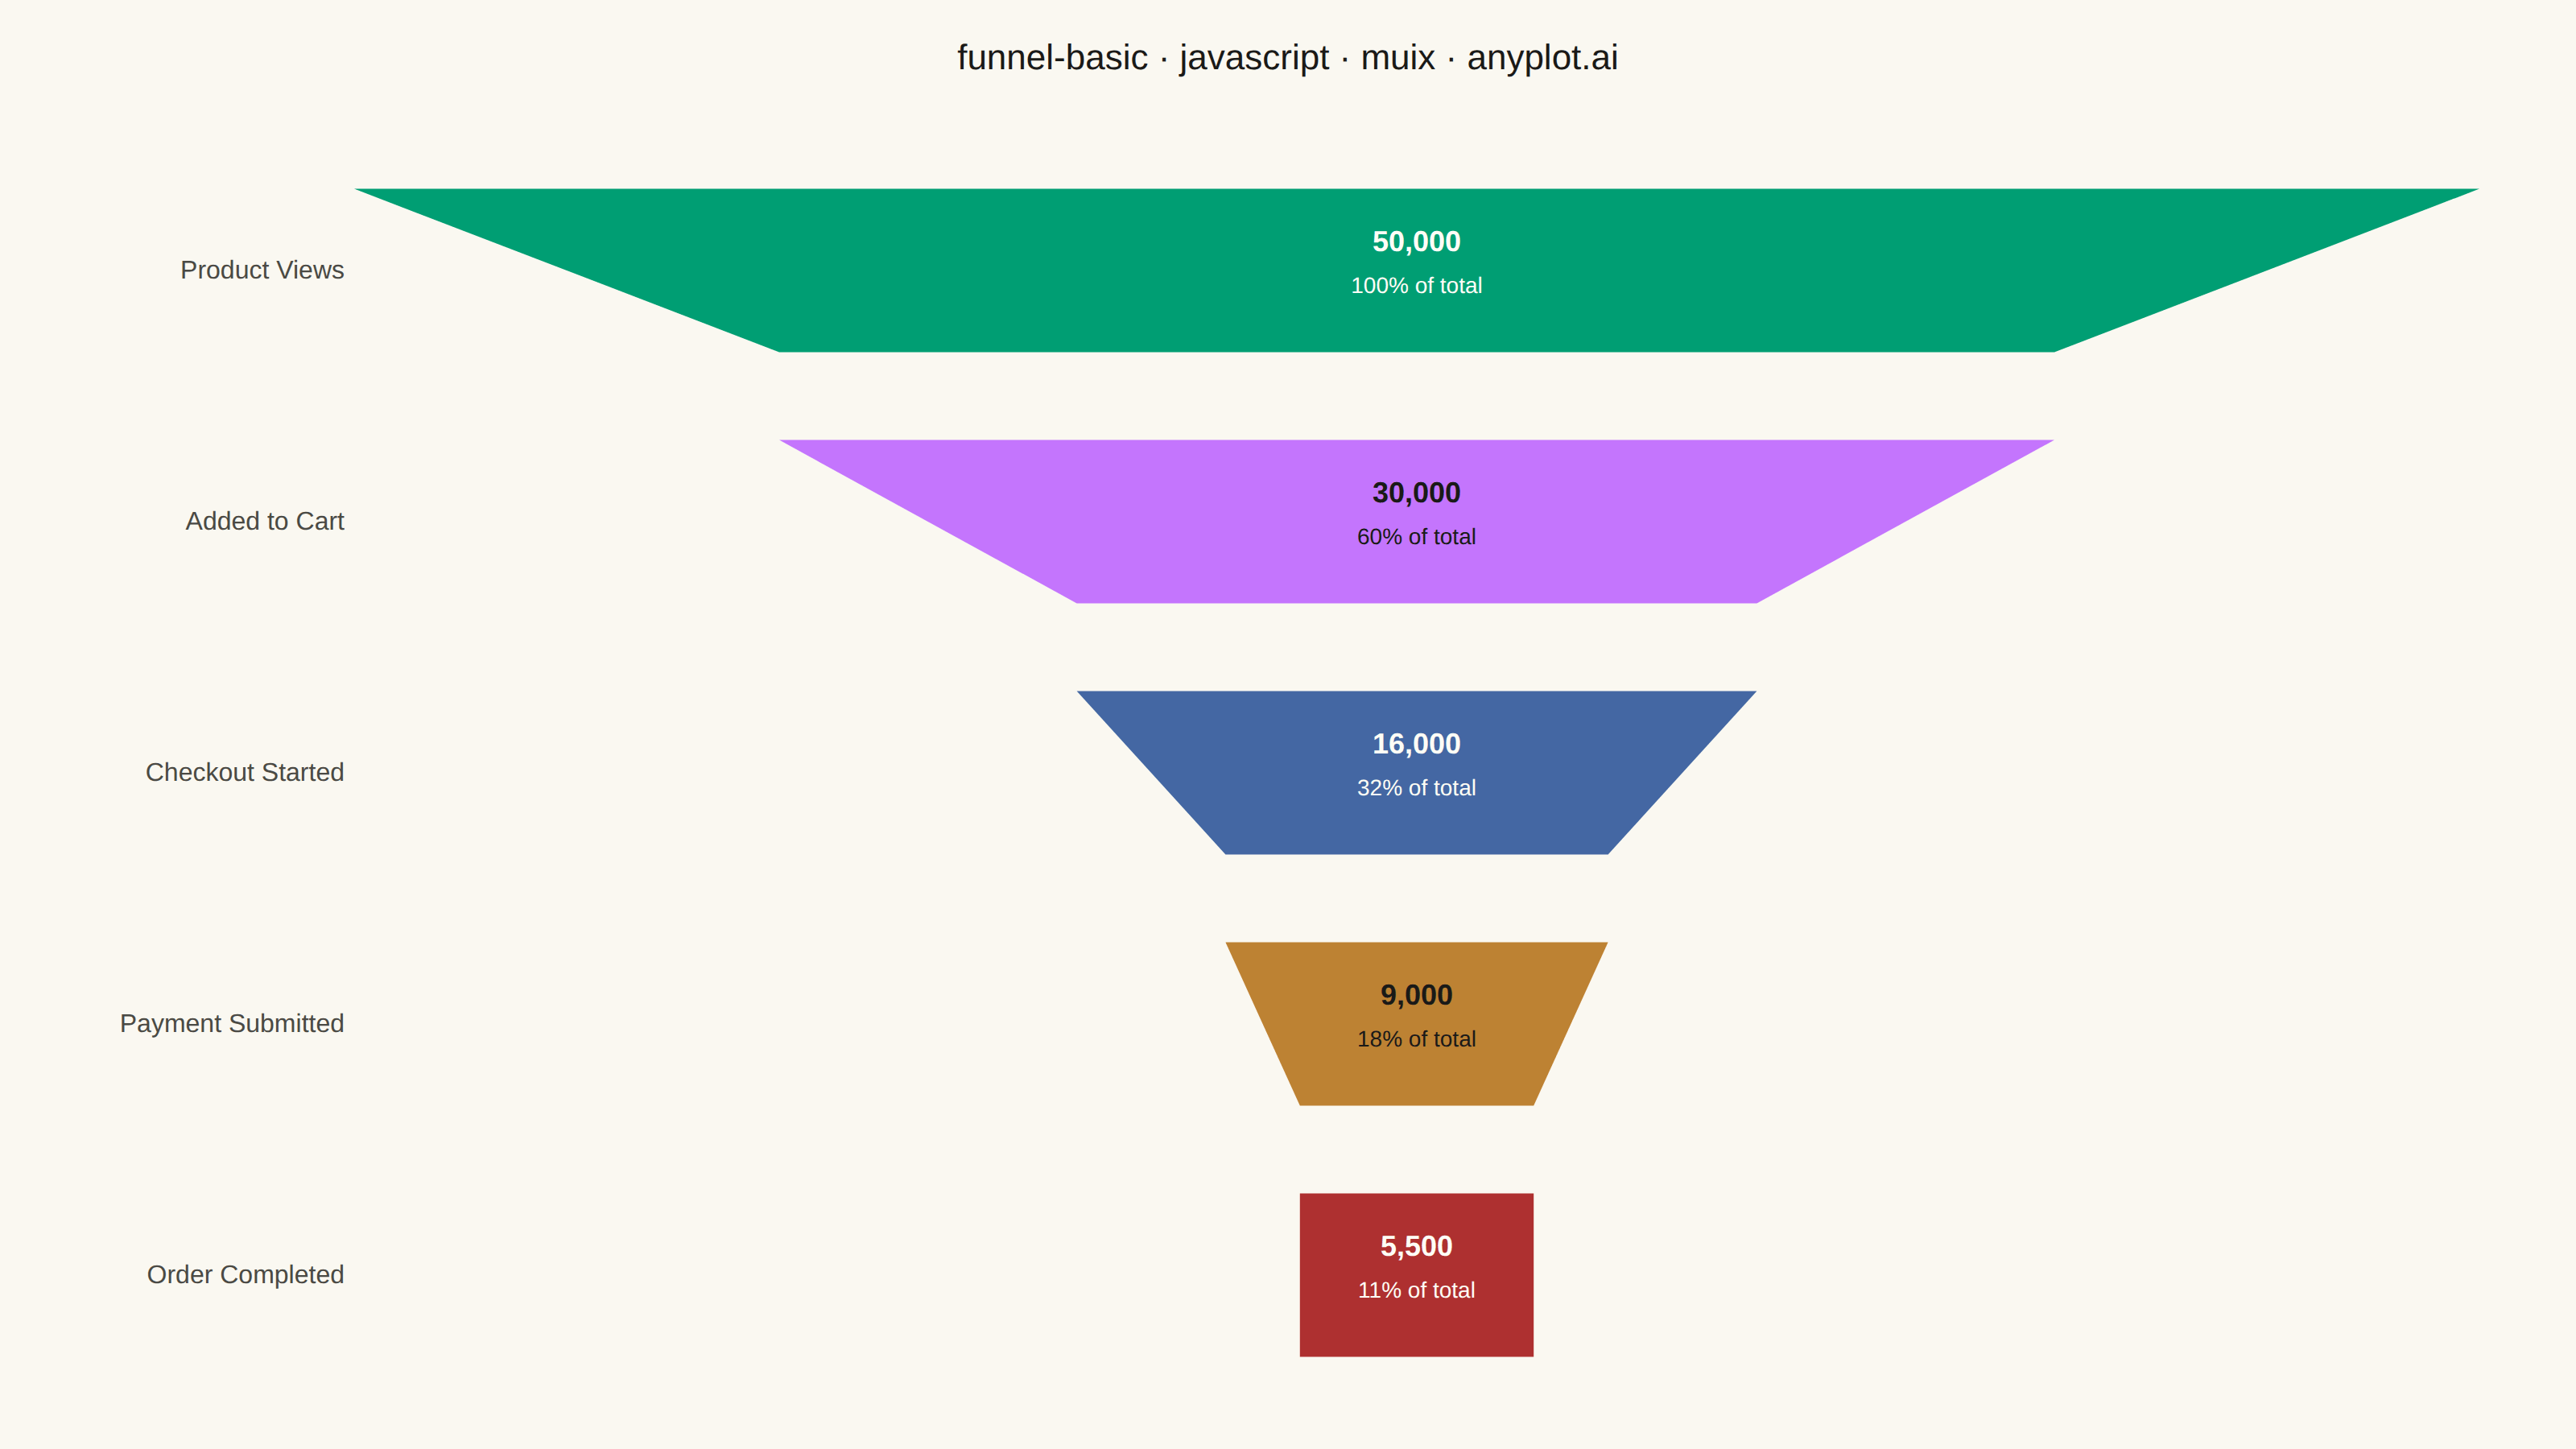
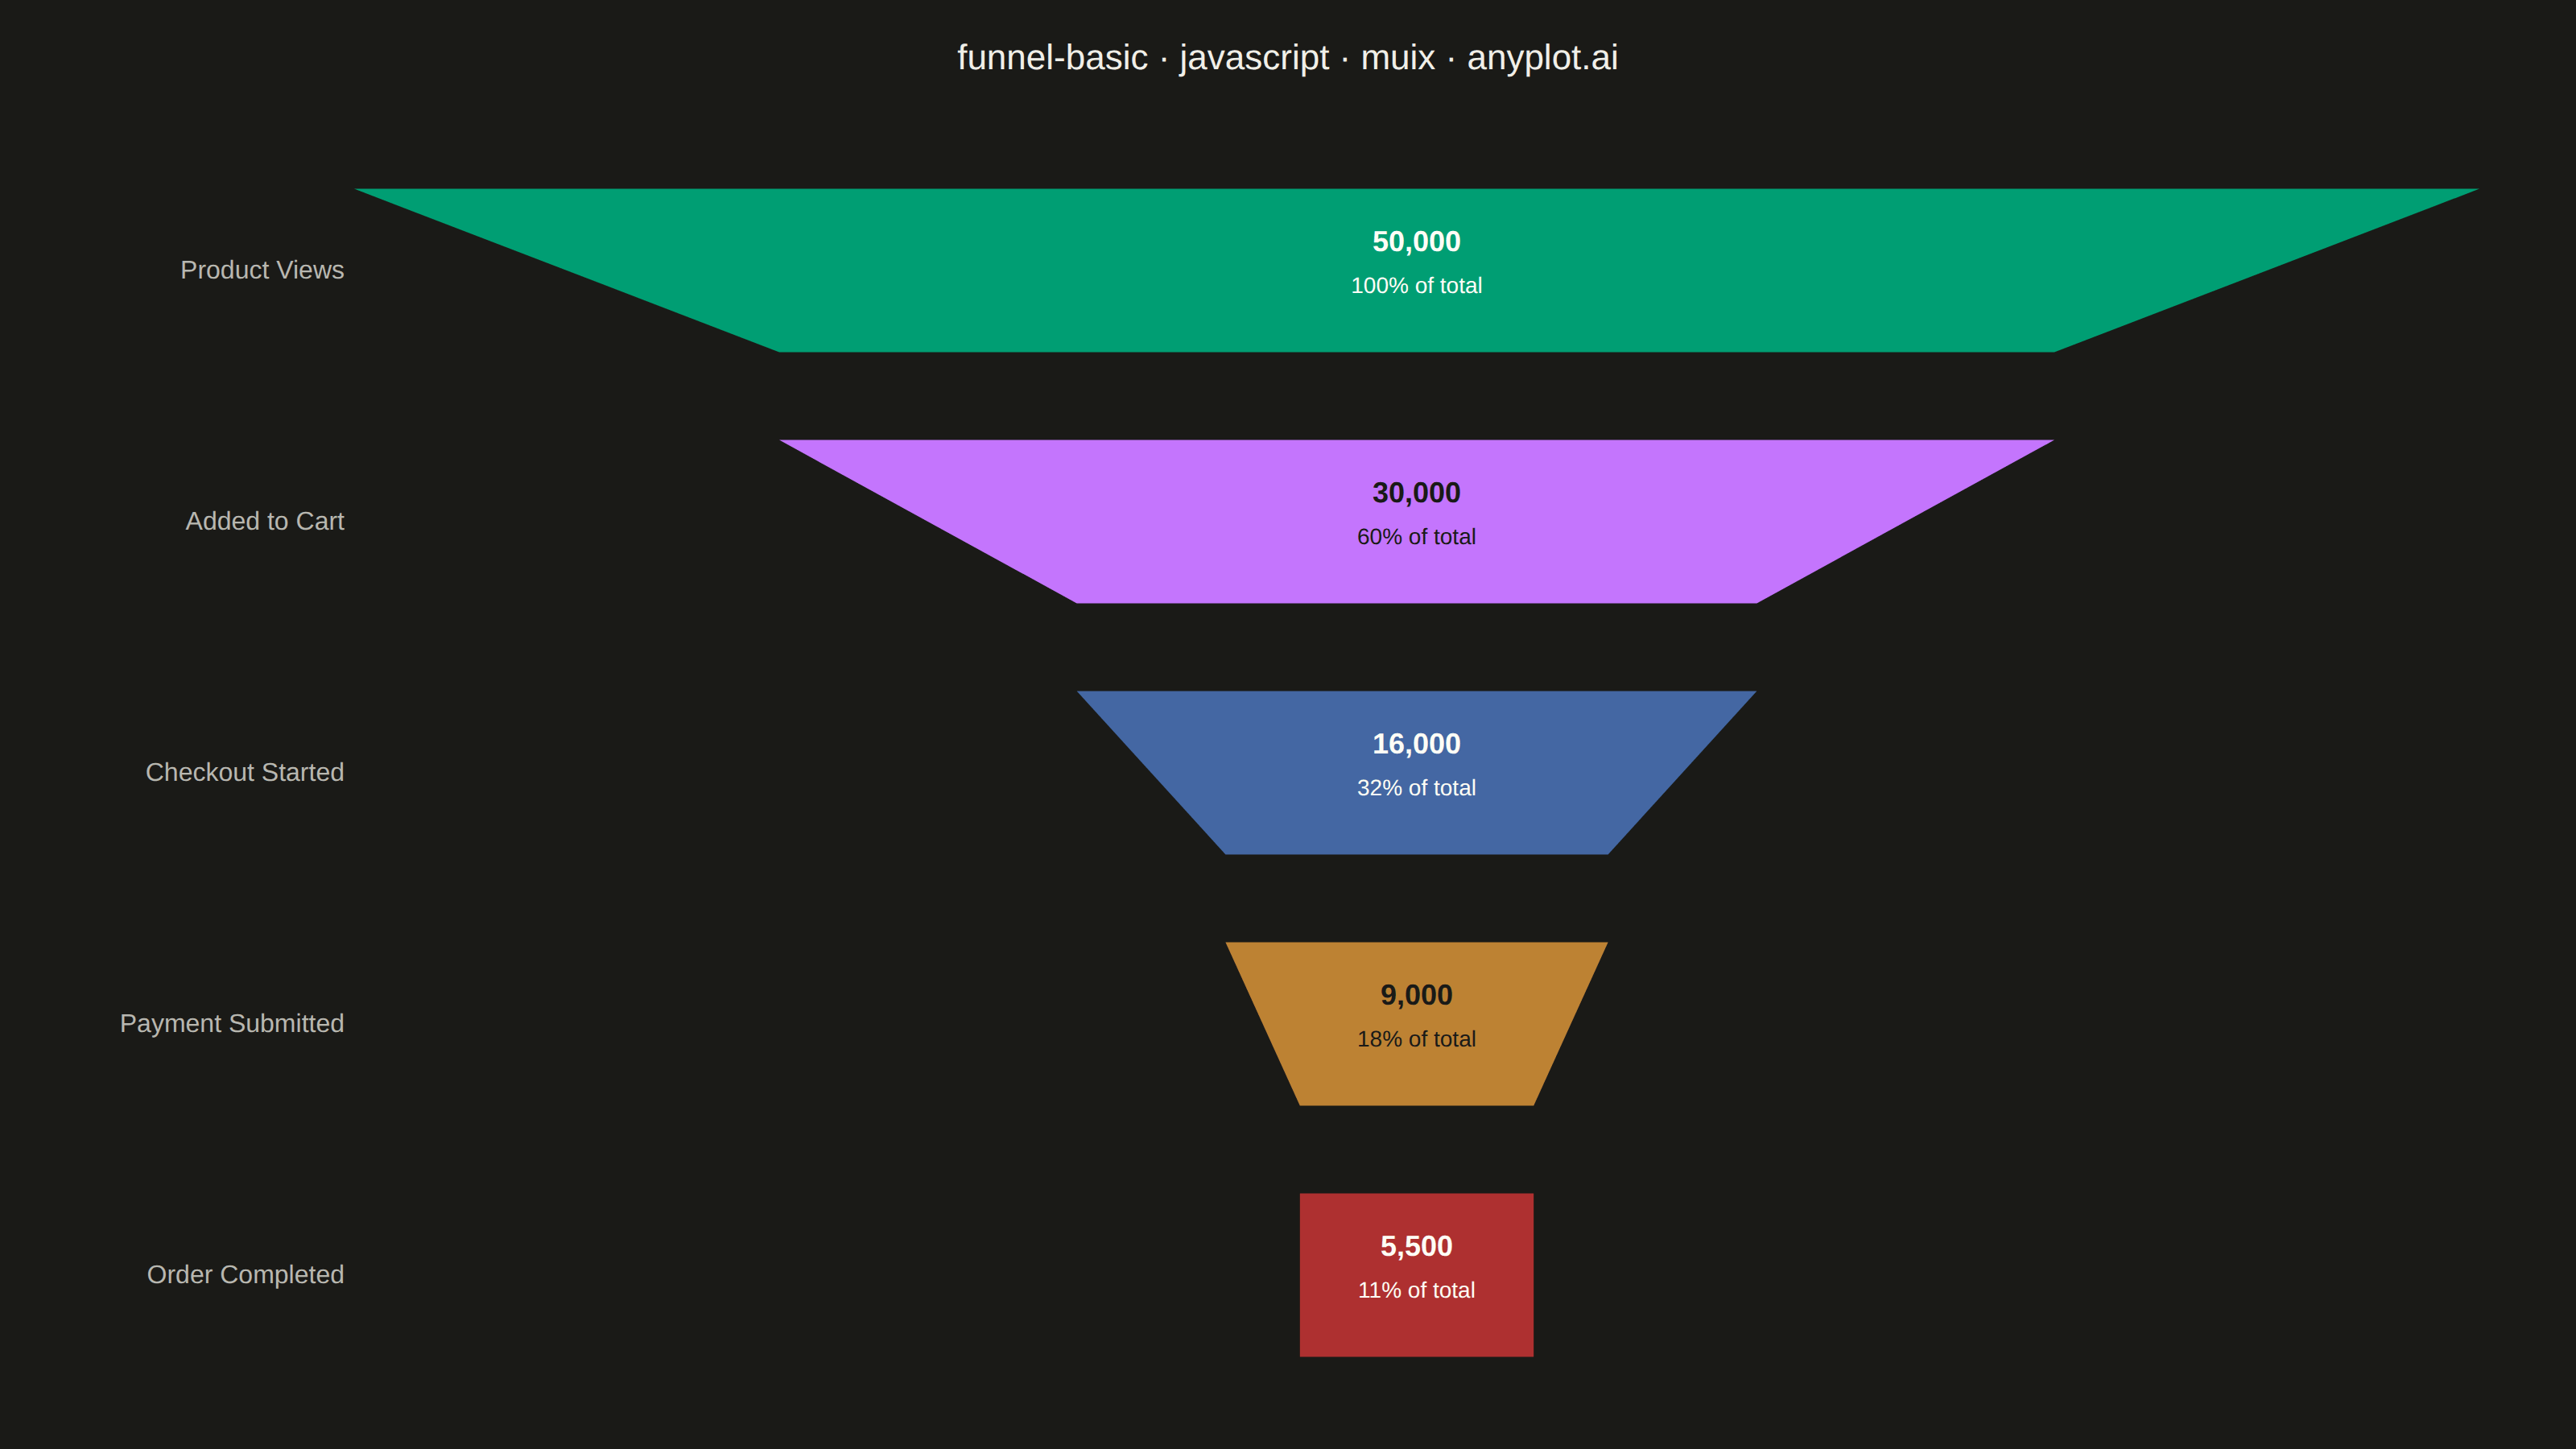
A funnel chart visualizes sequential stages of a process where values progressively decrease from one stage to the next. Each stage is represented as a trapezoidal segment that narrows from top to bottom, making it easy to identify drop-offs between stages. This chart is ideal for tracking conversion rates, sales pipelines, and multi-step processes where understanding stage-to-stage transitions is critical.
Preview render from the MUI X Charts implementation.