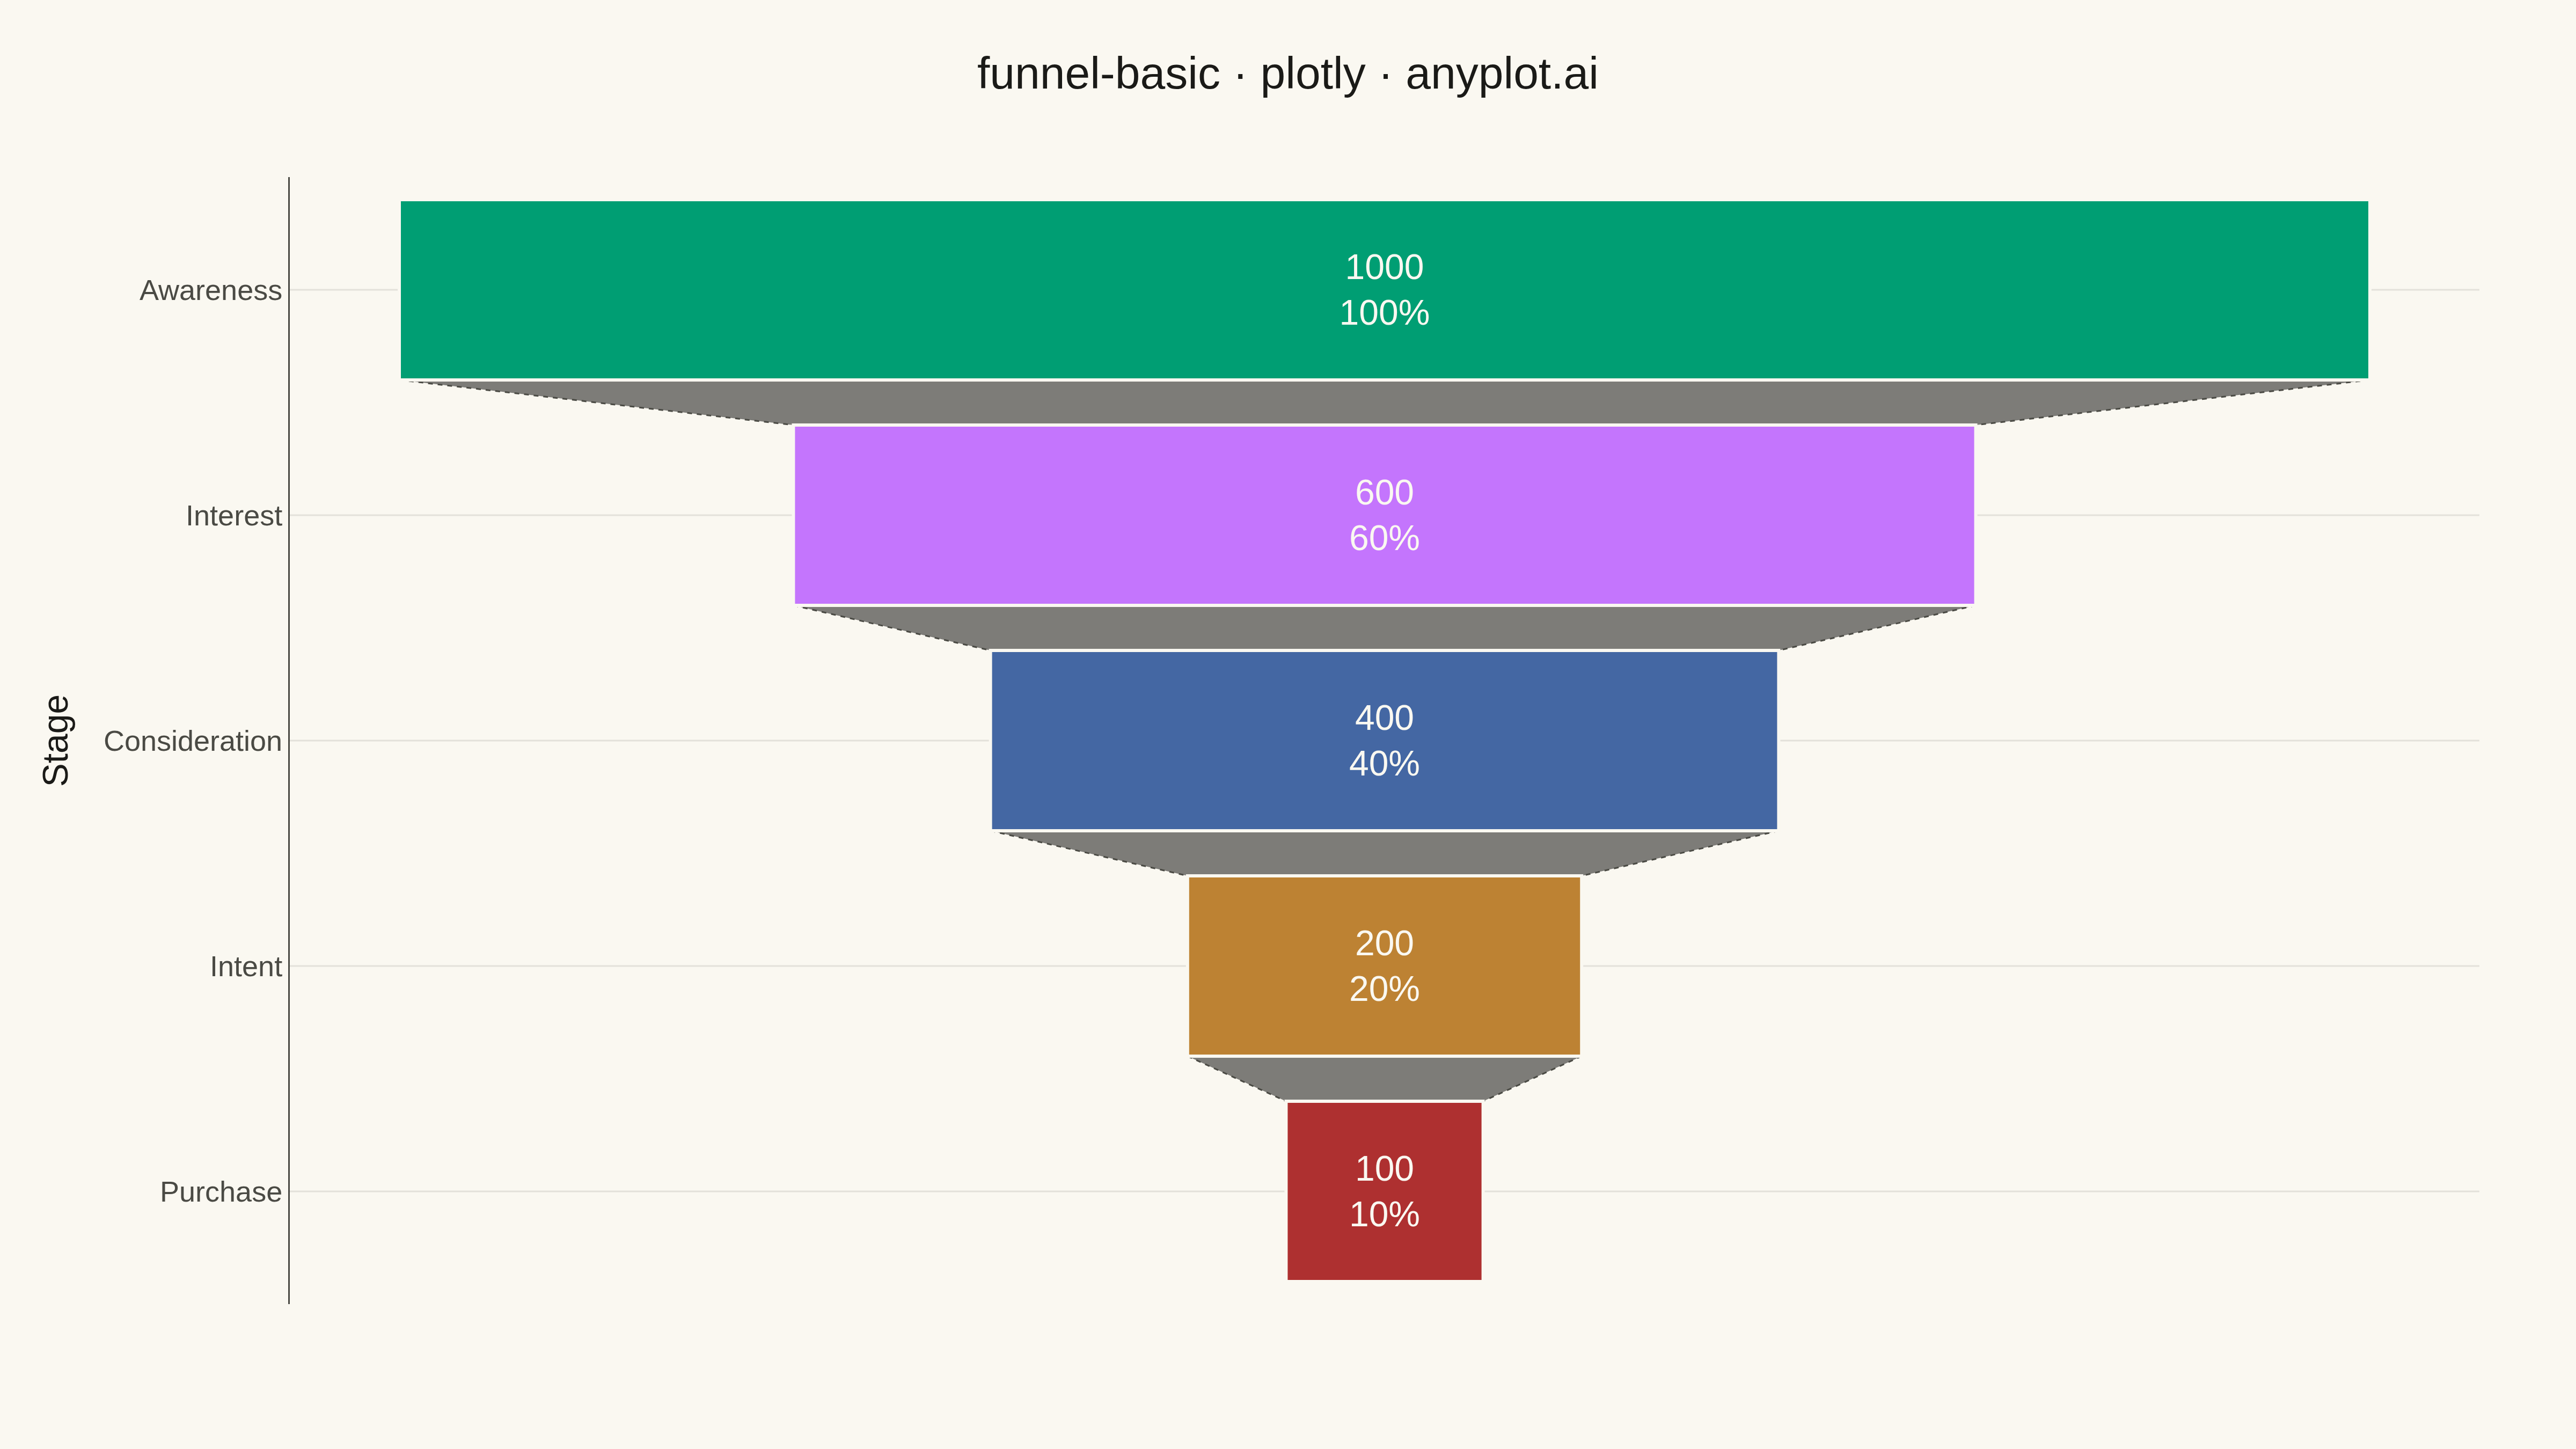
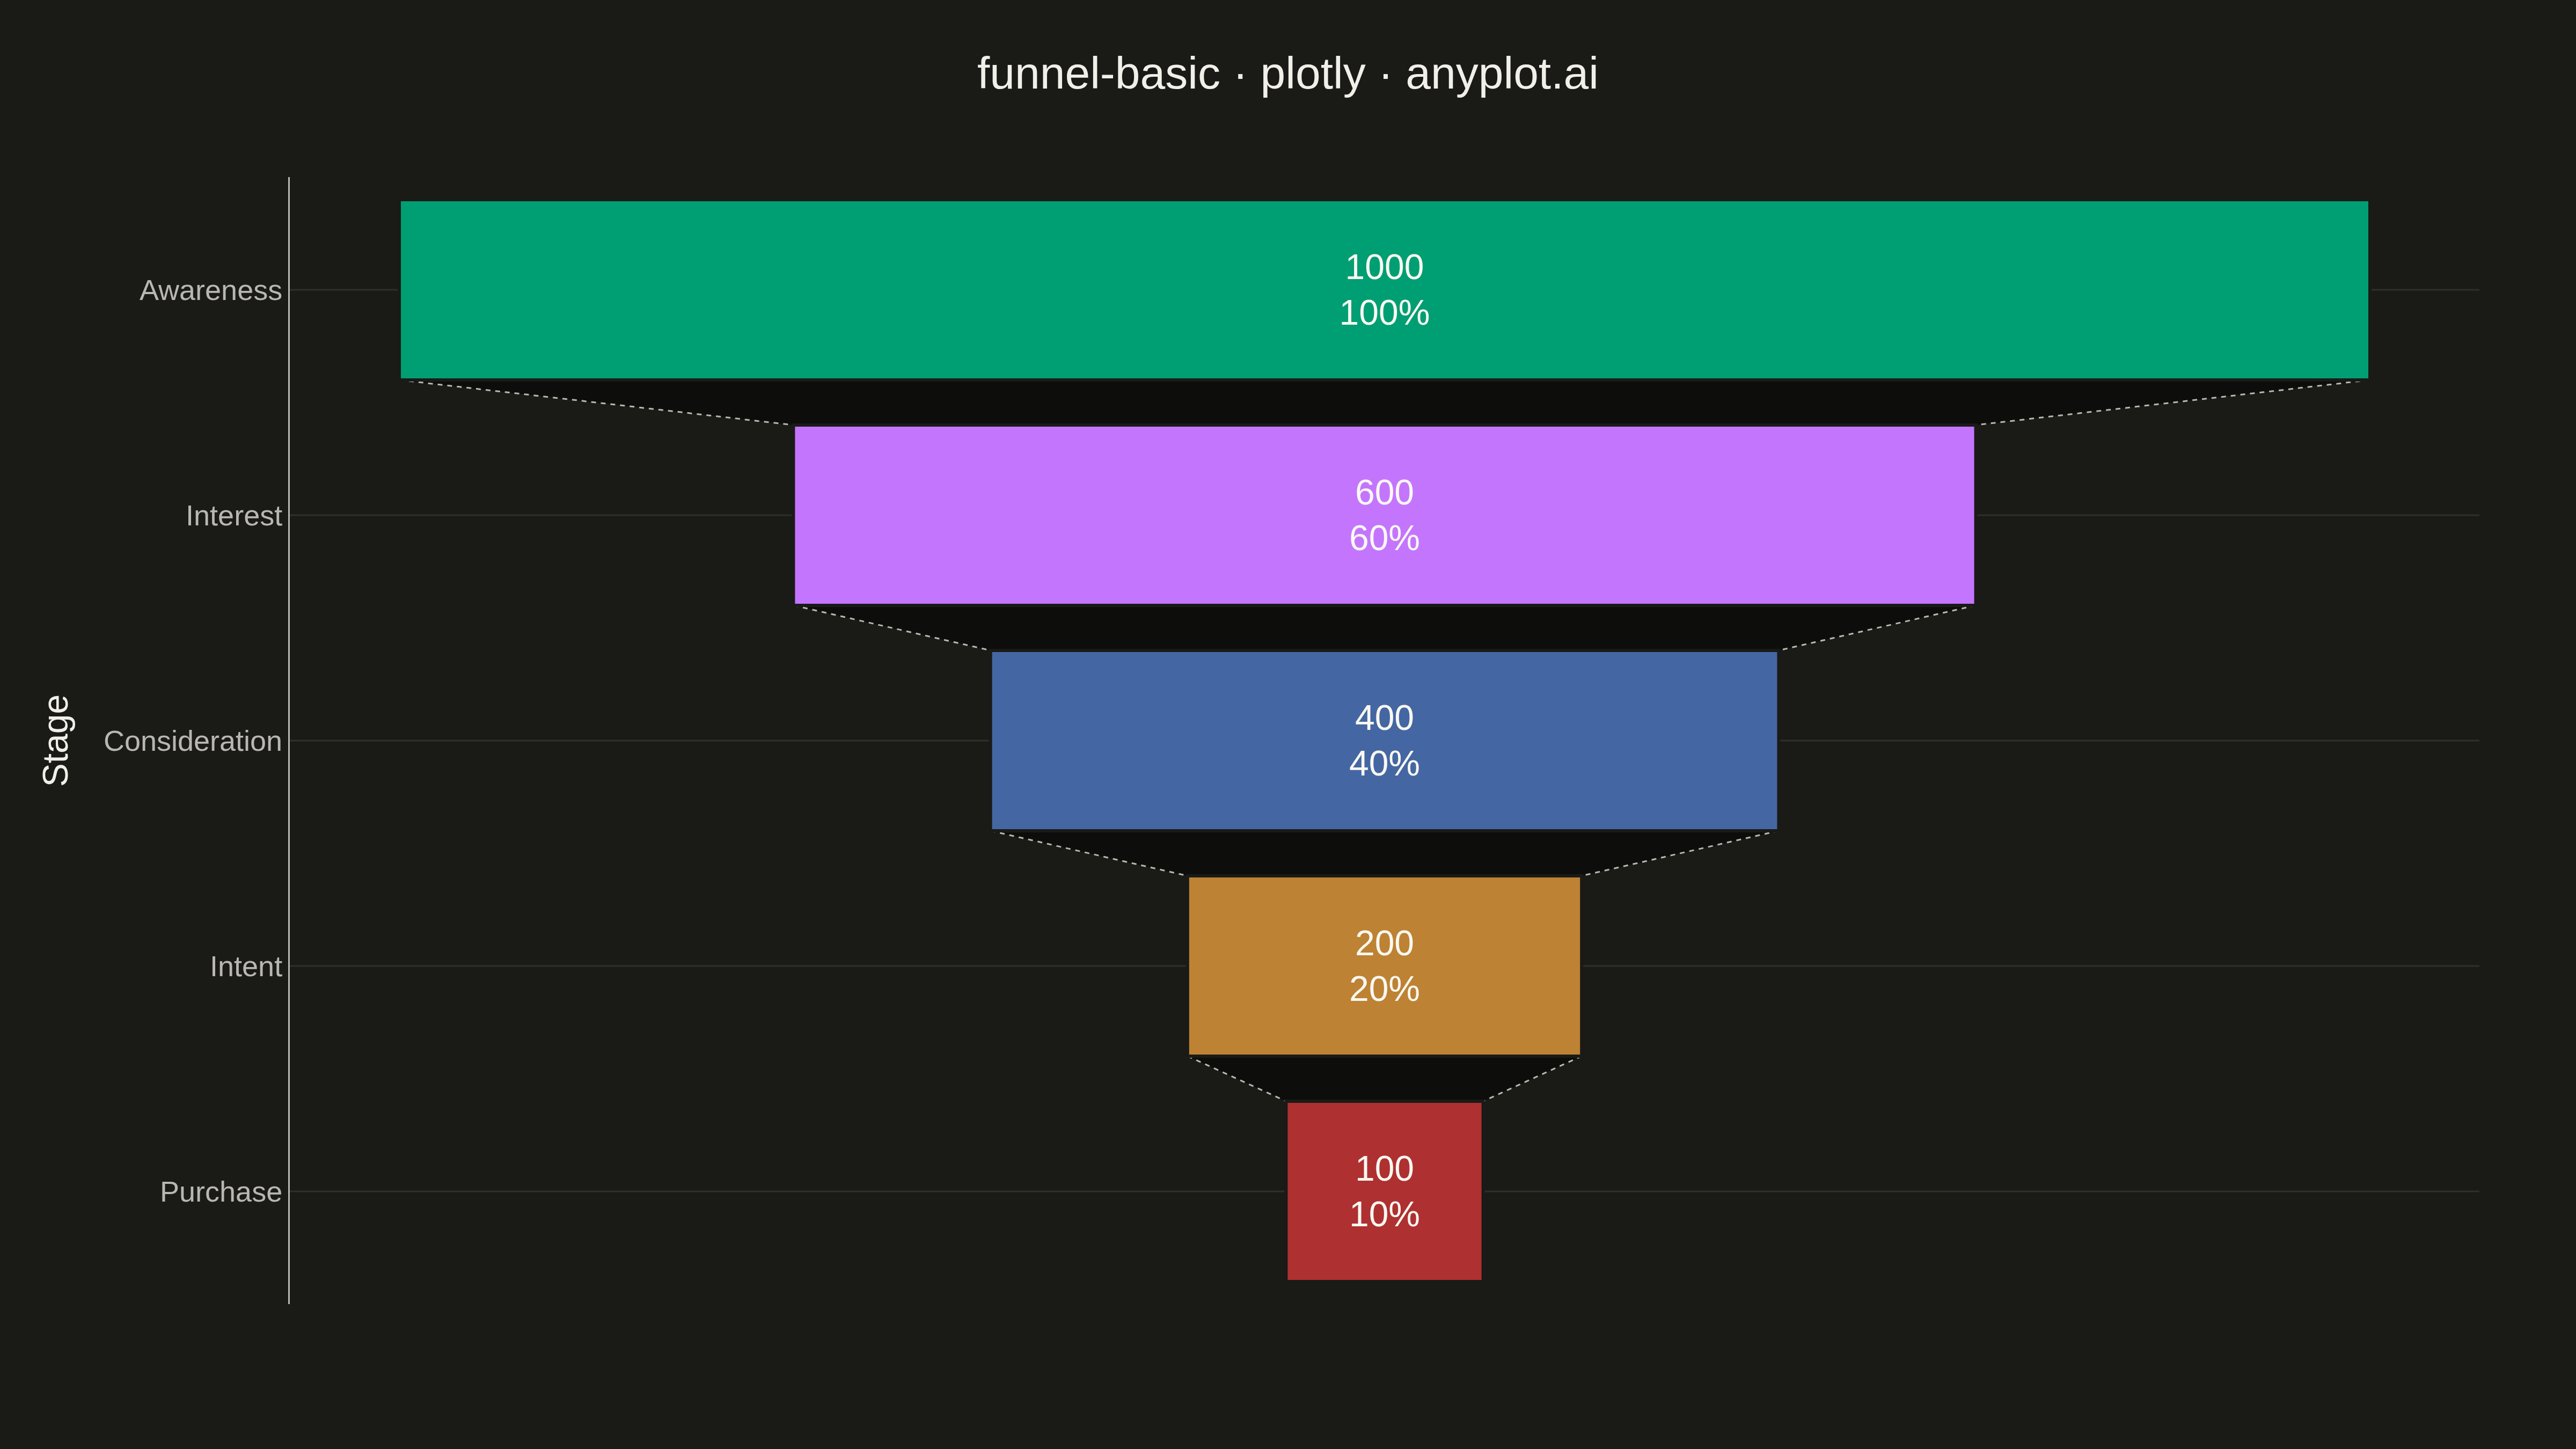
A funnel chart visualizes sequential stages of a process where values progressively decrease from one stage to the next. Each stage is represented as a trapezoidal segment that narrows from top to bottom, making it easy to identify drop-offs between stages. This chart is ideal for tracking conversion rates, sales pipelines, and multi-step processes where understanding stage-to-stage transitions is critical.
""" anyplot.ai
funnel-basic: Basic Funnel Chart
Library: plotly 6.7.0 | Python 3.14.4
Quality: 87/100 | Updated: 2026-04-26
"""

import os

import plotly.graph_objects as go


# Theme tokens
THEME = os.getenv("ANYPLOT_THEME", "light")
PAGE_BG = "#FAF8F1" if THEME == "light" else "#1A1A17"
INK = "#1A1A17" if THEME == "light" else "#F0EFE8"
INK_SOFT = "#4A4A44" if THEME == "light" else "#B8B7B0"
GRID = "rgba(26,26,23,0.10)" if THEME == "light" else "rgba(240,239,232,0.10)"

# Okabe-Ito categorical palette (first series is always #009E73)
IMPRINT = ["#009E73", "#C475FD", "#4467A3", "#BD8233", "#AE3030"]

# Data - Sales funnel example
stages = ["Awareness", "Interest", "Consideration", "Intent", "Purchase"]
values = [1000, 600, 400, 200, 100]

# Plot
fig = go.Figure(
    go.Funnel(
        y=stages,
        x=values,
        textposition="inside",
        textinfo="value+percent initial",
        textfont={"size": 22, "color": "#FAF8F1"},
        marker={"color": IMPRINT, "line": {"width": 2, "color": PAGE_BG}},
        connector={"line": {"color": INK_SOFT, "width": 1, "dash": "dot"}},
    )
)

# Style
fig.update_layout(
    title={
        "text": "funnel-basic · plotly · anyplot.ai",
        "font": {"size": 28, "color": INK},
        "x": 0.5,
        "xanchor": "center",
    },
    yaxis={
        "title": {"text": "Stage", "font": {"size": 22, "color": INK}},
        "tickfont": {"size": 18, "color": INK_SOFT},
        "gridcolor": GRID,
        "linecolor": INK_SOFT,
        "zerolinecolor": INK_SOFT,
    },
    xaxis={
        "title": {"text": "Count", "font": {"size": 22, "color": INK}},
        "tickfont": {"size": 18, "color": INK_SOFT},
        "gridcolor": GRID,
        "linecolor": INK_SOFT,
        "zerolinecolor": INK_SOFT,
    },
    paper_bgcolor=PAGE_BG,
    plot_bgcolor=PAGE_BG,
    font={"color": INK},
    margin={"l": 180, "r": 60, "t": 110, "b": 90},
    showlegend=False,
)

# Save
fig.write_image(f"plot-{THEME}.png", width=1600, height=900, scale=3)
fig.write_html(f"plot-{THEME}.html", include_plotlyjs="cdn")
Runnable source as JSON, for any HTTP client: https://api.anyplot.ai/specs/funnel-basic/plotly/code. Any spec id and library id listed in llms-full.txt fit the same URL shape; every URL below is complete and callable.
{
  "spec_id": "funnel-basic",
  "language": "python",
  "library": "plotly",
  "page": "https://anyplot.ai/funnel-basic/python/plotly",
  "hub": "https://anyplot.ai/funnel-basic",
  "code_json": "https://api.anyplot.ai/specs/funnel-basic/plotly/code",
  "spec_json": "https://api.anyplot.ai/specs/funnel-basic",
  "render_light_png": "https://storage.googleapis.com/anyplot-images/plots/funnel-basic/python/plotly/plot-light.png",
  "render_dark_png": "https://storage.googleapis.com/anyplot-images/plots/funnel-basic/python/plotly/plot-dark.png",
  "interactive_light_html": "https://storage.googleapis.com/anyplot-images/plots/funnel-basic/python/plotly/plot-light.html",
  "interactive_dark_html": "https://storage.googleapis.com/anyplot-images/plots/funnel-basic/python/plotly/plot-dark.html",
  "quality_score": 87.0,
  "license": "MIT",
  "guide": "https://anyplot.ai/llms.txt"
}
Part of Basic Funnel Chart on anyplot.ai.