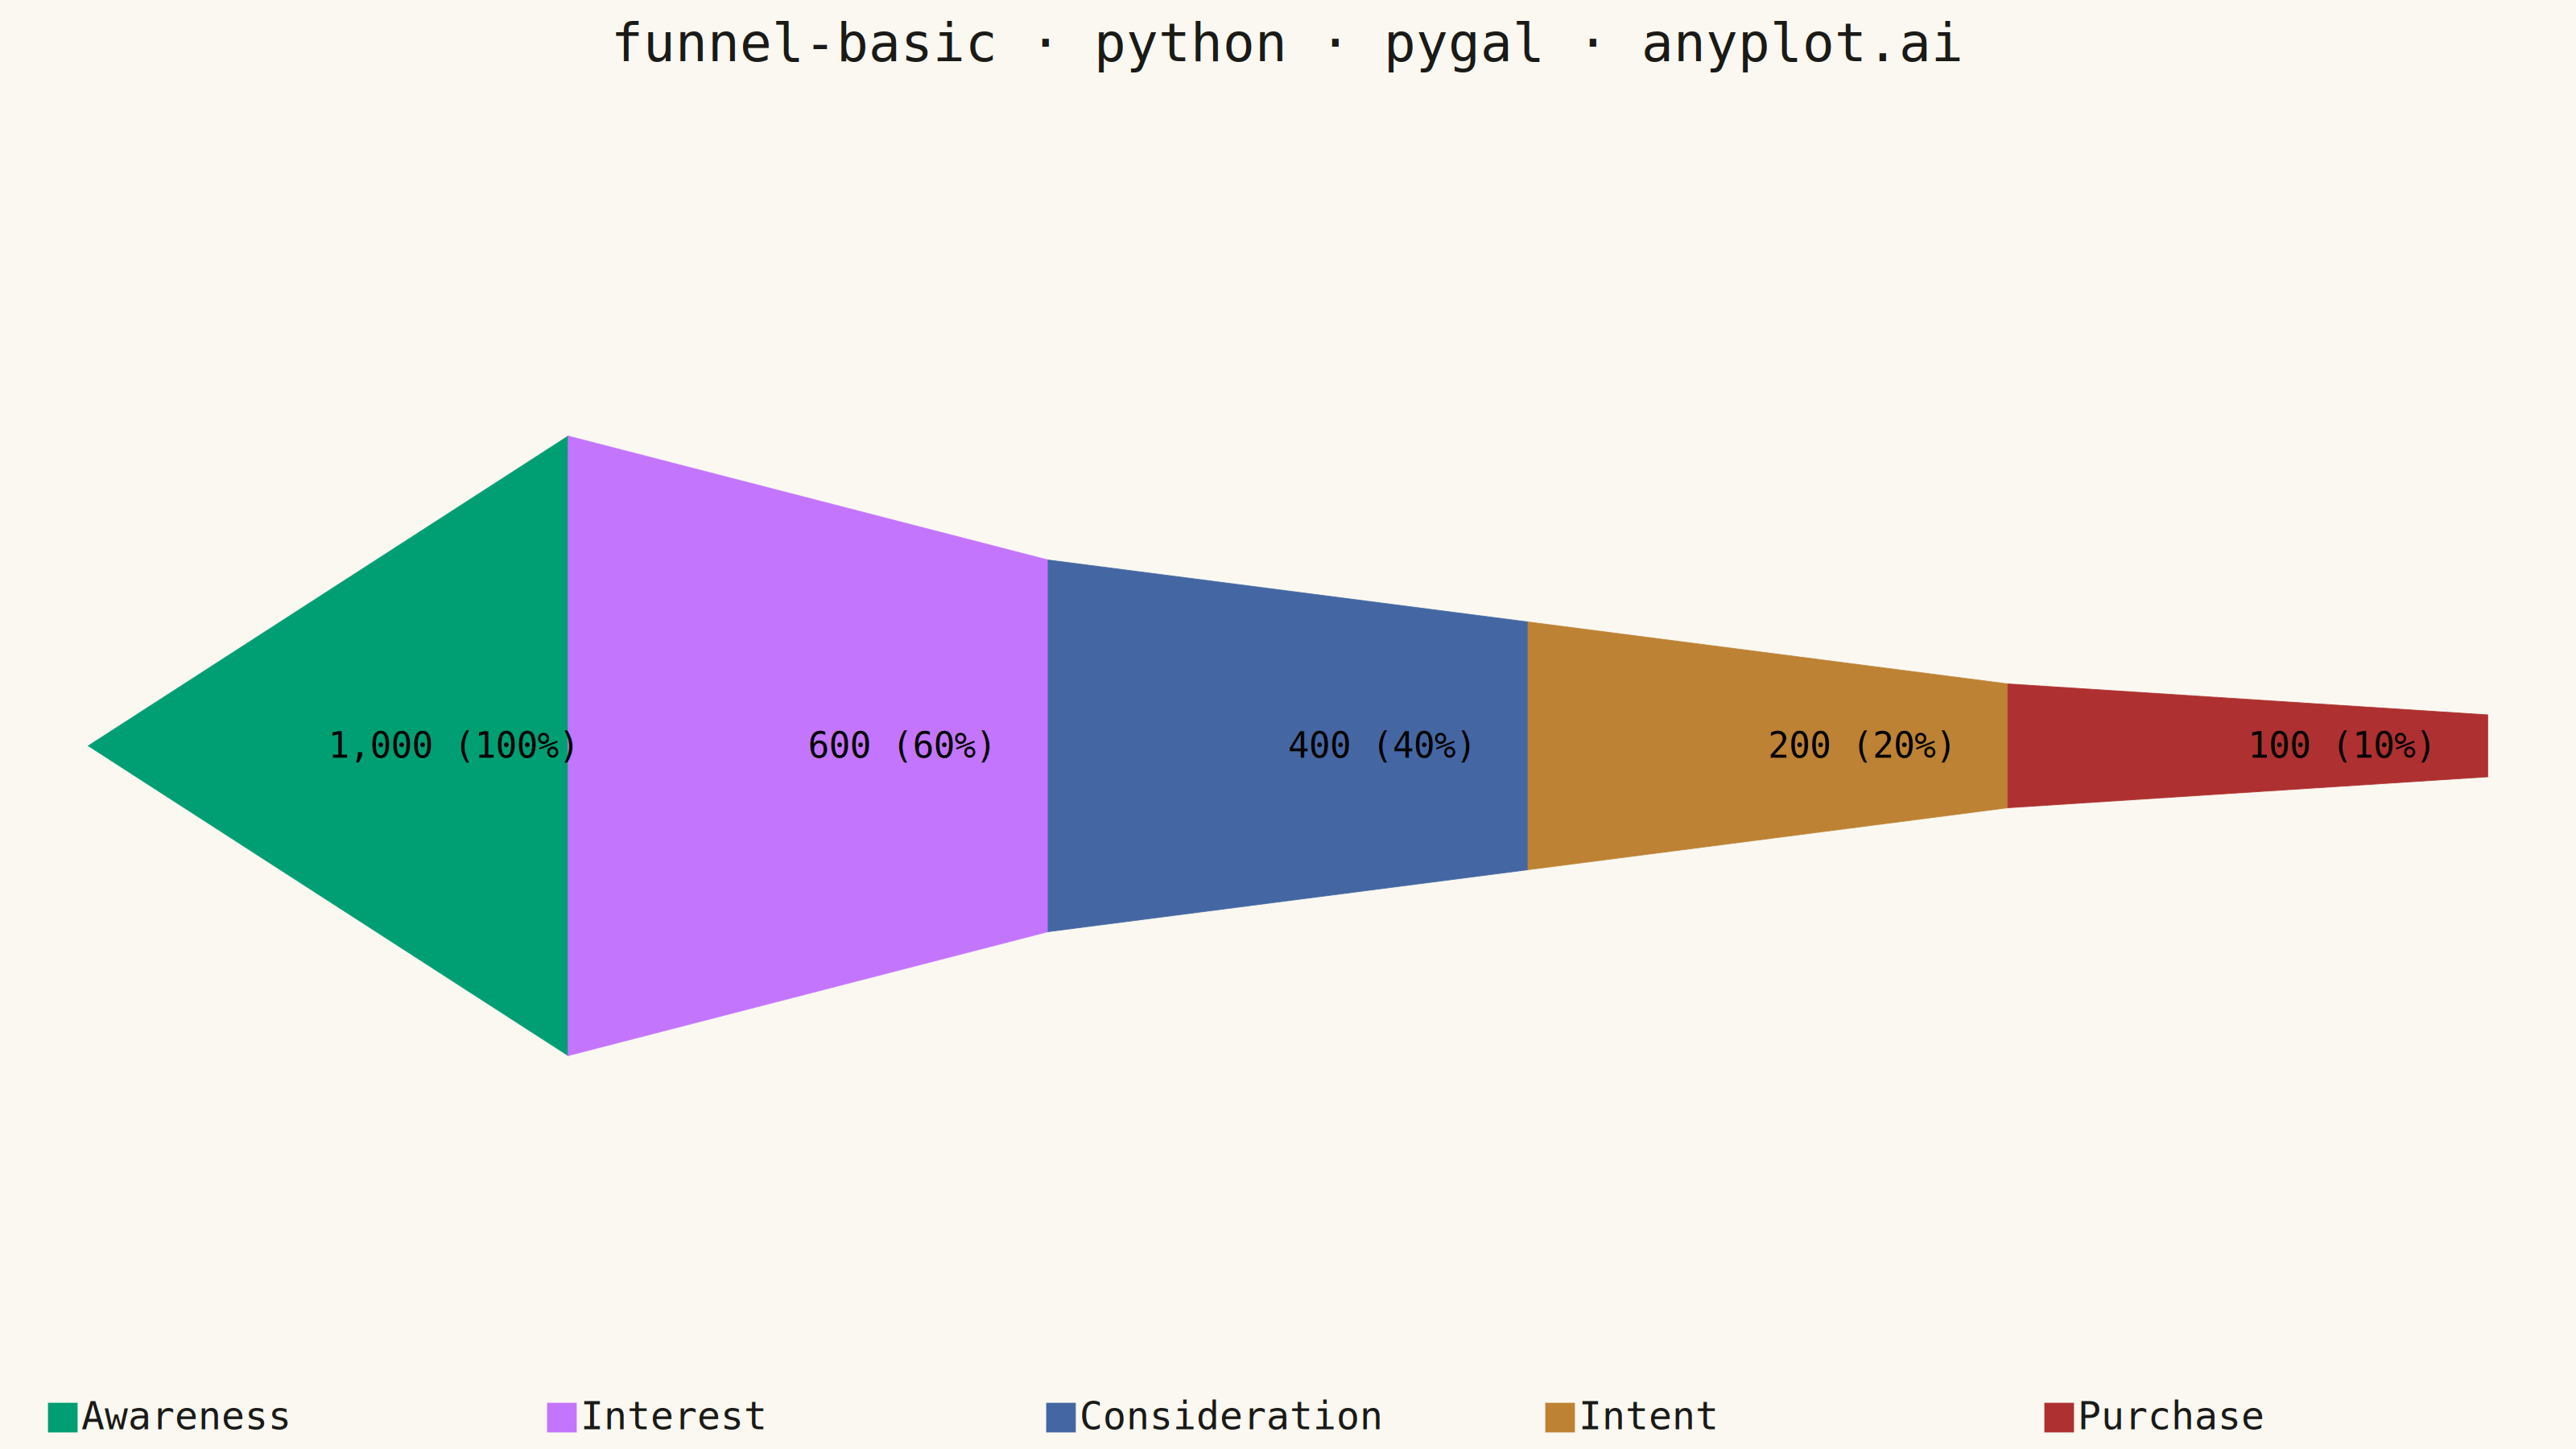
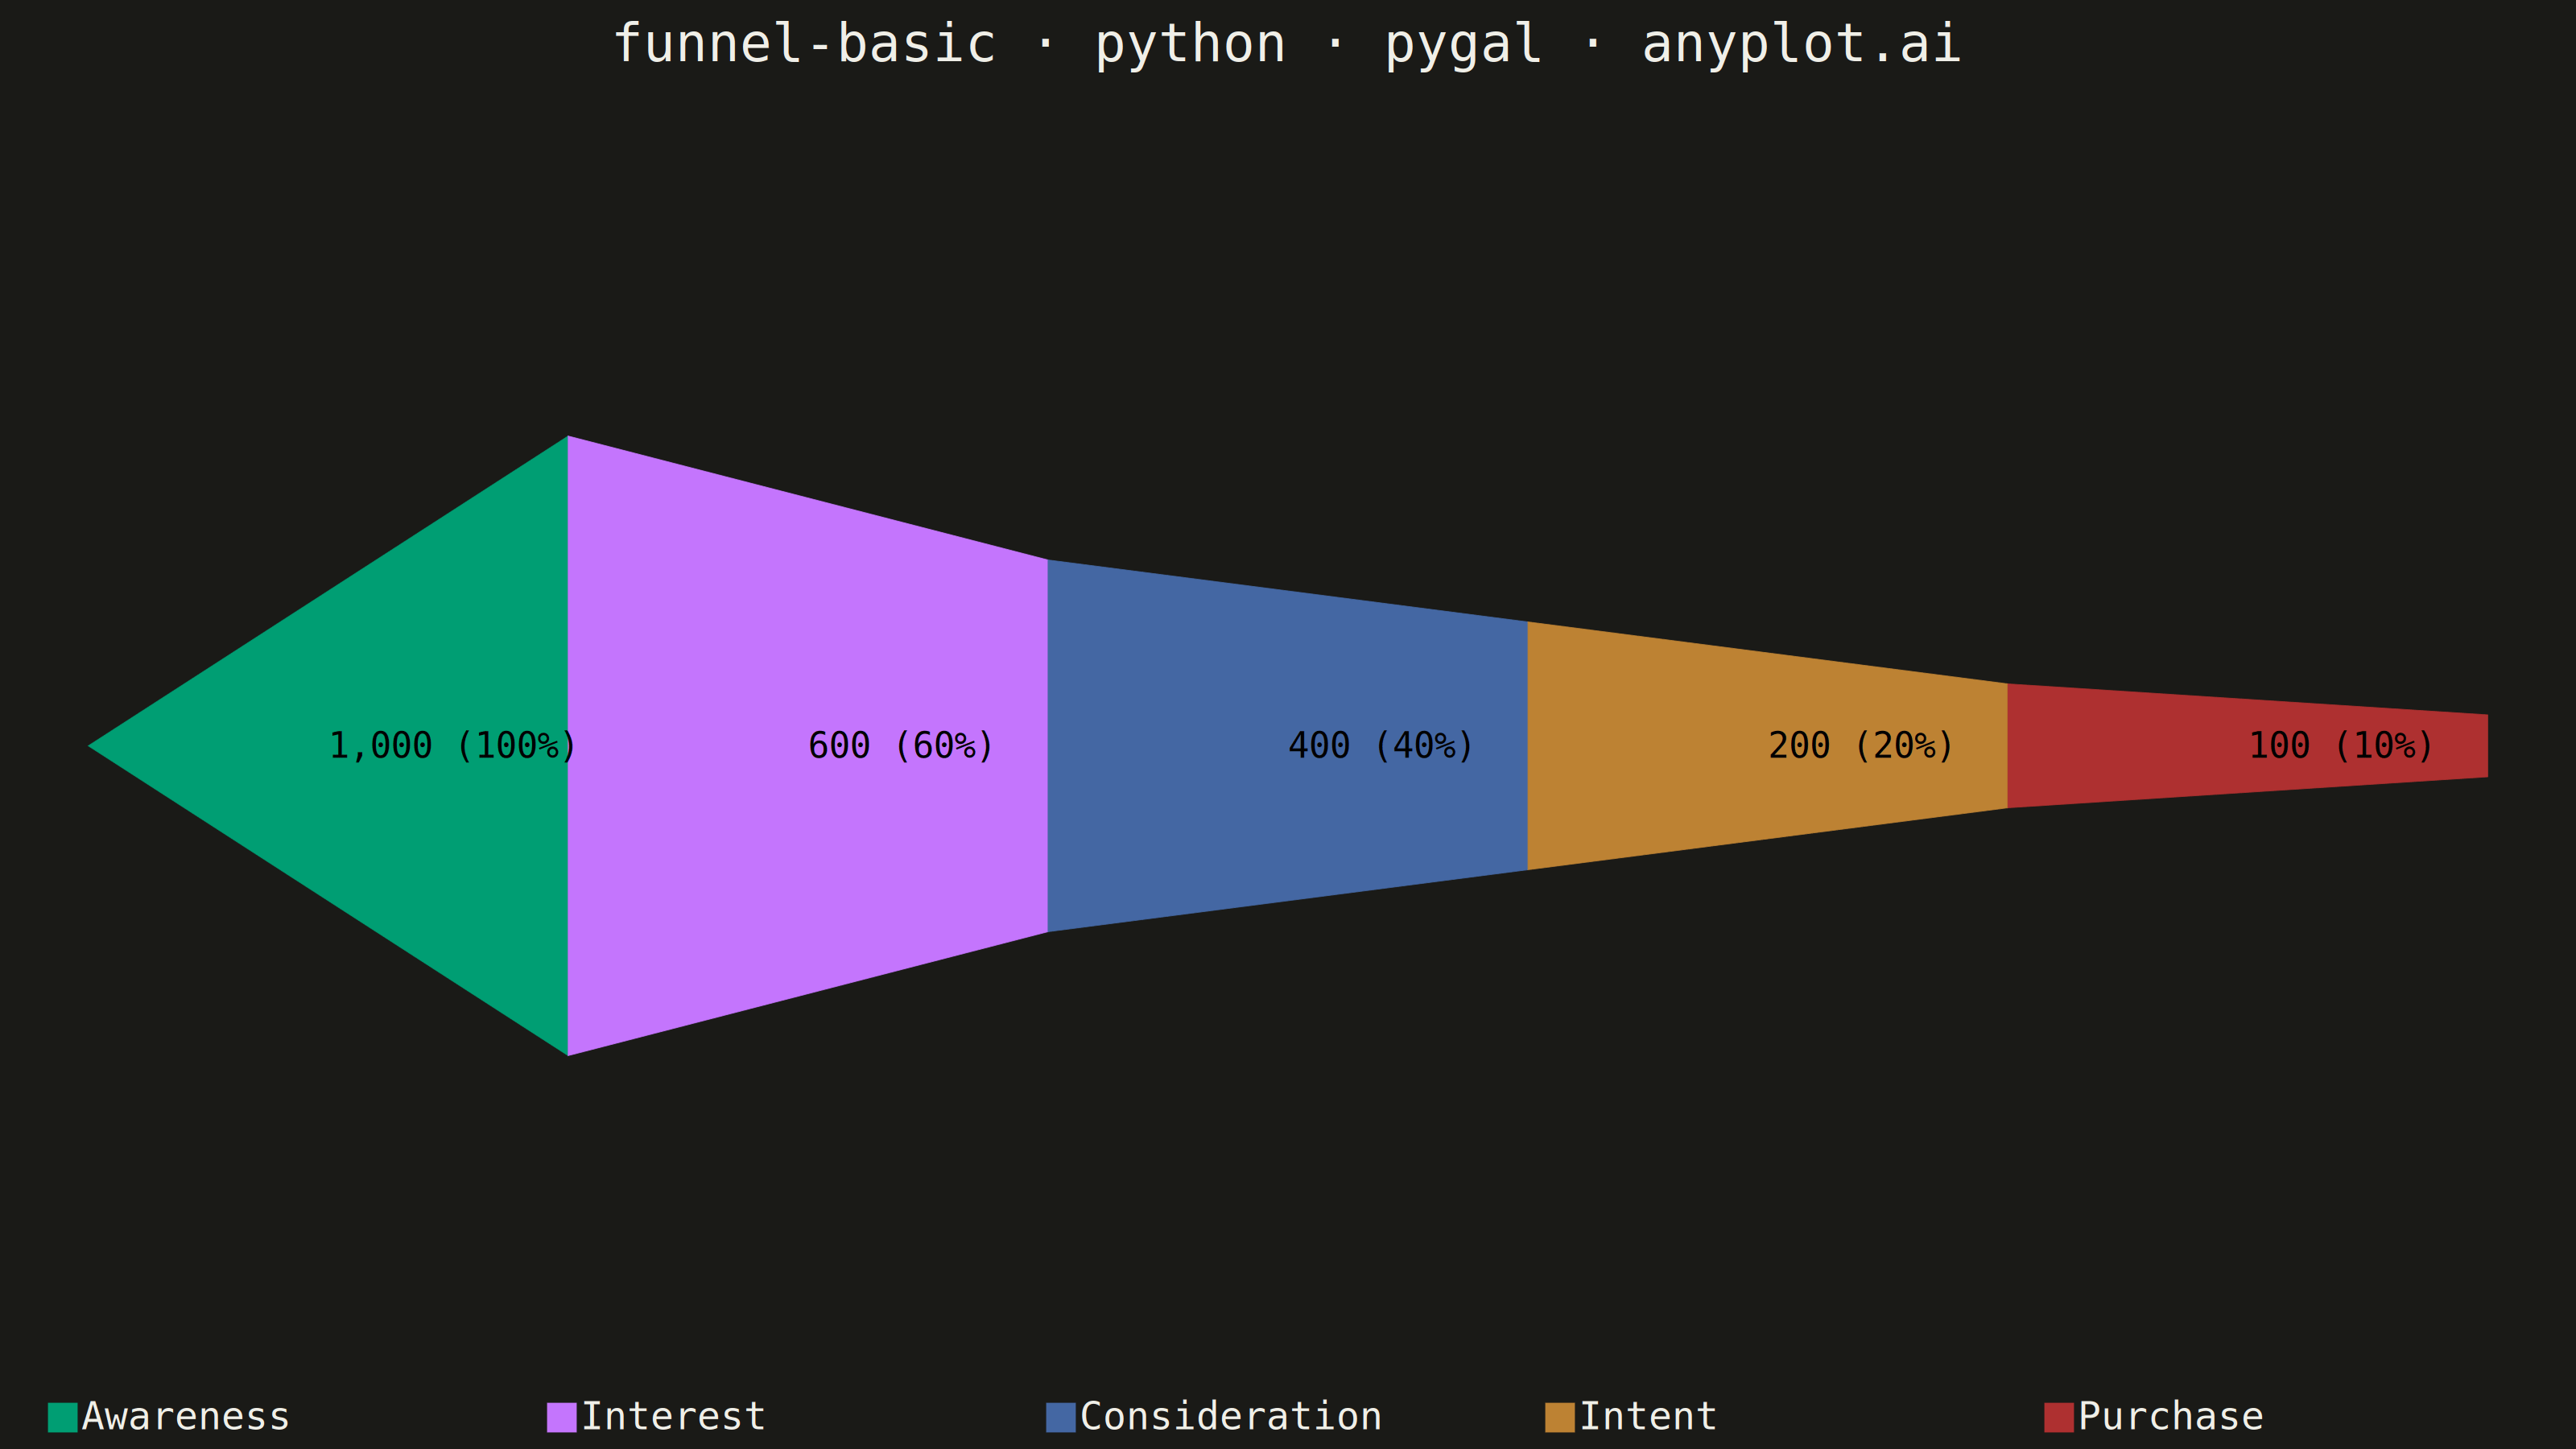
A funnel chart visualizes sequential stages of a process where values progressively decrease from one stage to the next. Each stage is represented as a trapezoidal segment that narrows from top to bottom, making it easy to identify drop-offs between stages. This chart is ideal for tracking conversion rates, sales pipelines, and multi-step processes where understanding stage-to-stage transitions is critical.
""" anyplot.ai
funnel-basic: Basic Funnel Chart
Library: pygal 3.1.0 | Python 3.13.13
Quality: 87/100 | Updated: 2026-06-16
"""

import os

import pygal
from pygal.style import Style


# Theme tokens (see prompts/default-style-guide.md "Theme-adaptive Chrome")
THEME = os.getenv("ANYPLOT_THEME", "light")
PAGE_BG = "#FAF8F1" if THEME == "light" else "#1A1A17"
INK = "#1A1A17" if THEME == "light" else "#F0EFE8"
INK_MUTED = "#6B6A63" if THEME == "light" else "#A8A79F"

# Imprint palette — first series is ALWAYS brand green (#009E73)
IMPRINT_PALETTE = ("#009E73", "#C475FD", "#4467A3", "#BD8233", "#AE3030")

# Data — sales conversion funnel, stages ordered largest (top) → smallest (bottom)
# Deterministic data, no random seed needed
stages = ["Awareness", "Interest", "Consideration", "Intent", "Purchase"]
values = [1000, 600, 400, 200, 100]
base_value = values[0]

# Style — pygal's Style carries every theme token. Font sizes are unitless and
# render straight onto the 3200-px source grid (see default-style-guide.md
# "Why the Native-pixel numbers look so much bigger").
custom_style = Style(
    background=PAGE_BG,
    plot_background=PAGE_BG,
    foreground=INK,
    foreground_strong=INK,
    foreground_subtle=INK_MUTED,
    colors=IMPRINT_PALETTE,
    title_font_size=66,
    label_font_size=56,
    major_label_font_size=44,
    legend_font_size=48,
    value_font_size=44,
    tooltip_font_size=40,
    opacity=1,
)

# pygal's Funnel pads its y-box to [-max, +max] while the tallest segment only
# spans [-max/2, +max/2], so by default the funnel fills just half the plot
# height. An explicit symmetric range tightens that padding to ~0.6·max, giving
# the funnel a more commanding vertical presence without clipping any segment.
funnel_half = base_value * 0.6

# Plot — pygal's native Funnel chart; each stage is its own series so the
# segments carry distinct Imprint colors and the legend names every stage.
chart = pygal.Funnel(
    width=3200,
    height=1800,
    title="funnel-basic · python · pygal · anyplot.ai",
    style=custom_style,
    print_values=True,
    value_formatter=lambda v: f"{v:,.0f}  ({v / base_value * 100:.0f}%)",
    range=(-funnel_half, funnel_half),
    margin=50,
    margin_bottom=15,
    show_legend=True,
    legend_at_bottom=True,
    legend_at_bottom_columns=5,
    legend_box_size=36,
    show_x_labels=False,
    show_y_labels=False,
    show_y_guides=False,
    truncate_legend=-1,
)

# Each stage added as a single-value series — the value (and conversion %) is
# printed on the segment via the value_formatter above.
for stage, value in zip(stages, values, strict=True):
    chart.add(stage, value)

# Save — theme-suffixed PNG (cairosvg) plus interactive HTML (pygal is interactive)
chart.render_to_png(f"plot-{THEME}.png")
with open(f"plot-{THEME}.html", "wb") as f:
    f.write(chart.render())
Runnable source as JSON, for any HTTP client: https://api.anyplot.ai/specs/funnel-basic/pygal/code. Any spec id and library id listed in llms-full.txt fit the same URL shape; every URL below is complete and callable.
{
  "spec_id": "funnel-basic",
  "language": "python",
  "library": "pygal",
  "page": "https://anyplot.ai/funnel-basic/python/pygal",
  "hub": "https://anyplot.ai/funnel-basic",
  "code_json": "https://api.anyplot.ai/specs/funnel-basic/pygal/code",
  "spec_json": "https://api.anyplot.ai/specs/funnel-basic",
  "render_light_png": "https://storage.googleapis.com/anyplot-images/plots/funnel-basic/python/pygal/plot-light.png",
  "render_dark_png": "https://storage.googleapis.com/anyplot-images/plots/funnel-basic/python/pygal/plot-dark.png",
  "interactive_light_html": "https://storage.googleapis.com/anyplot-images/plots/funnel-basic/python/pygal/plot-light.html",
  "interactive_dark_html": "https://storage.googleapis.com/anyplot-images/plots/funnel-basic/python/pygal/plot-dark.html",
  "quality_score": 87.0,
  "license": "MIT",
  "guide": "https://anyplot.ai/llms.txt"
}
Part of Basic Funnel Chart on anyplot.ai.